- Image and text skills
We often use PPT for speech reporting, and sometimes we need to insert charts into PPT to assist us in reporting. So how to insert charts into PPT and edit chart data?

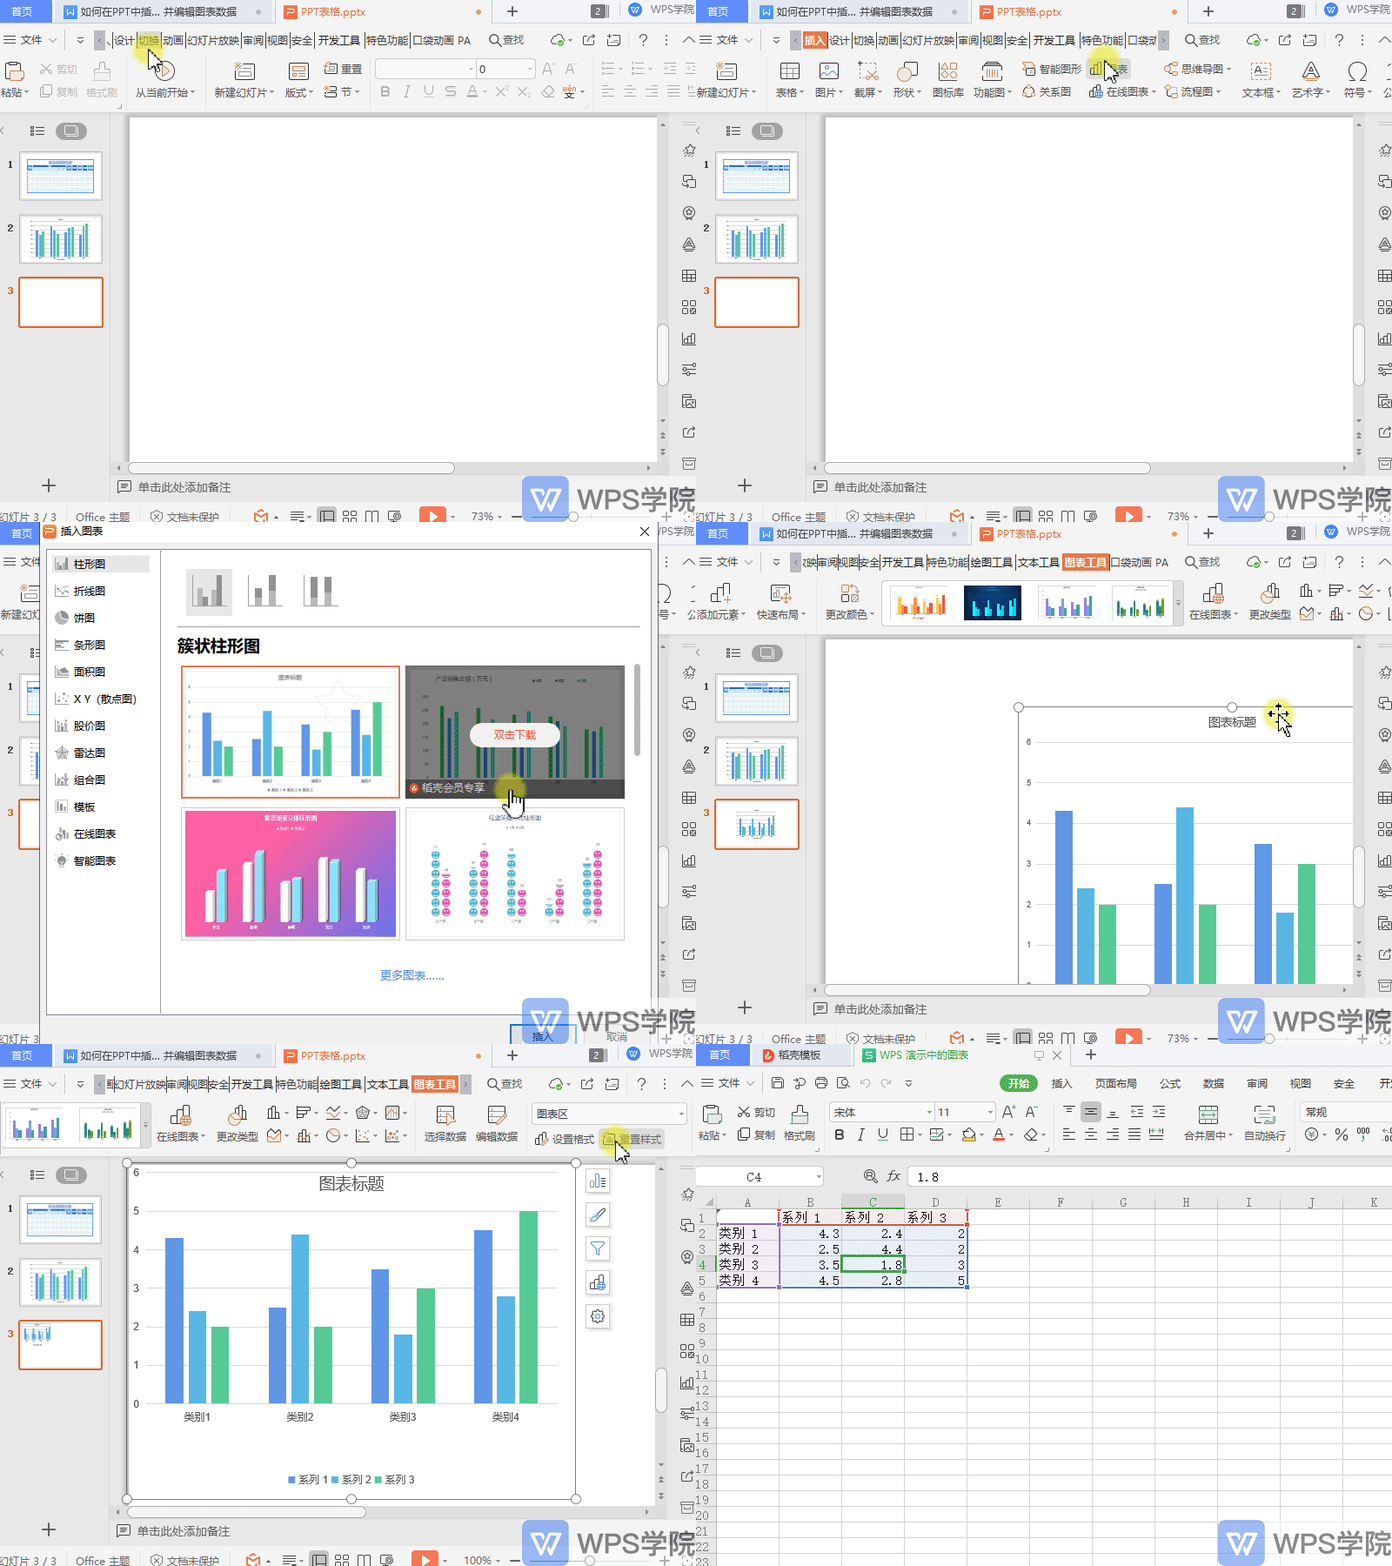
▪ Taking this PPT as an example, click Insert - Chart on the menu bar above and select a chart to insert.
Here we choose to insert a column chart, so that the chart is inserted into the PPT.

▪How to edit the data in the chart?
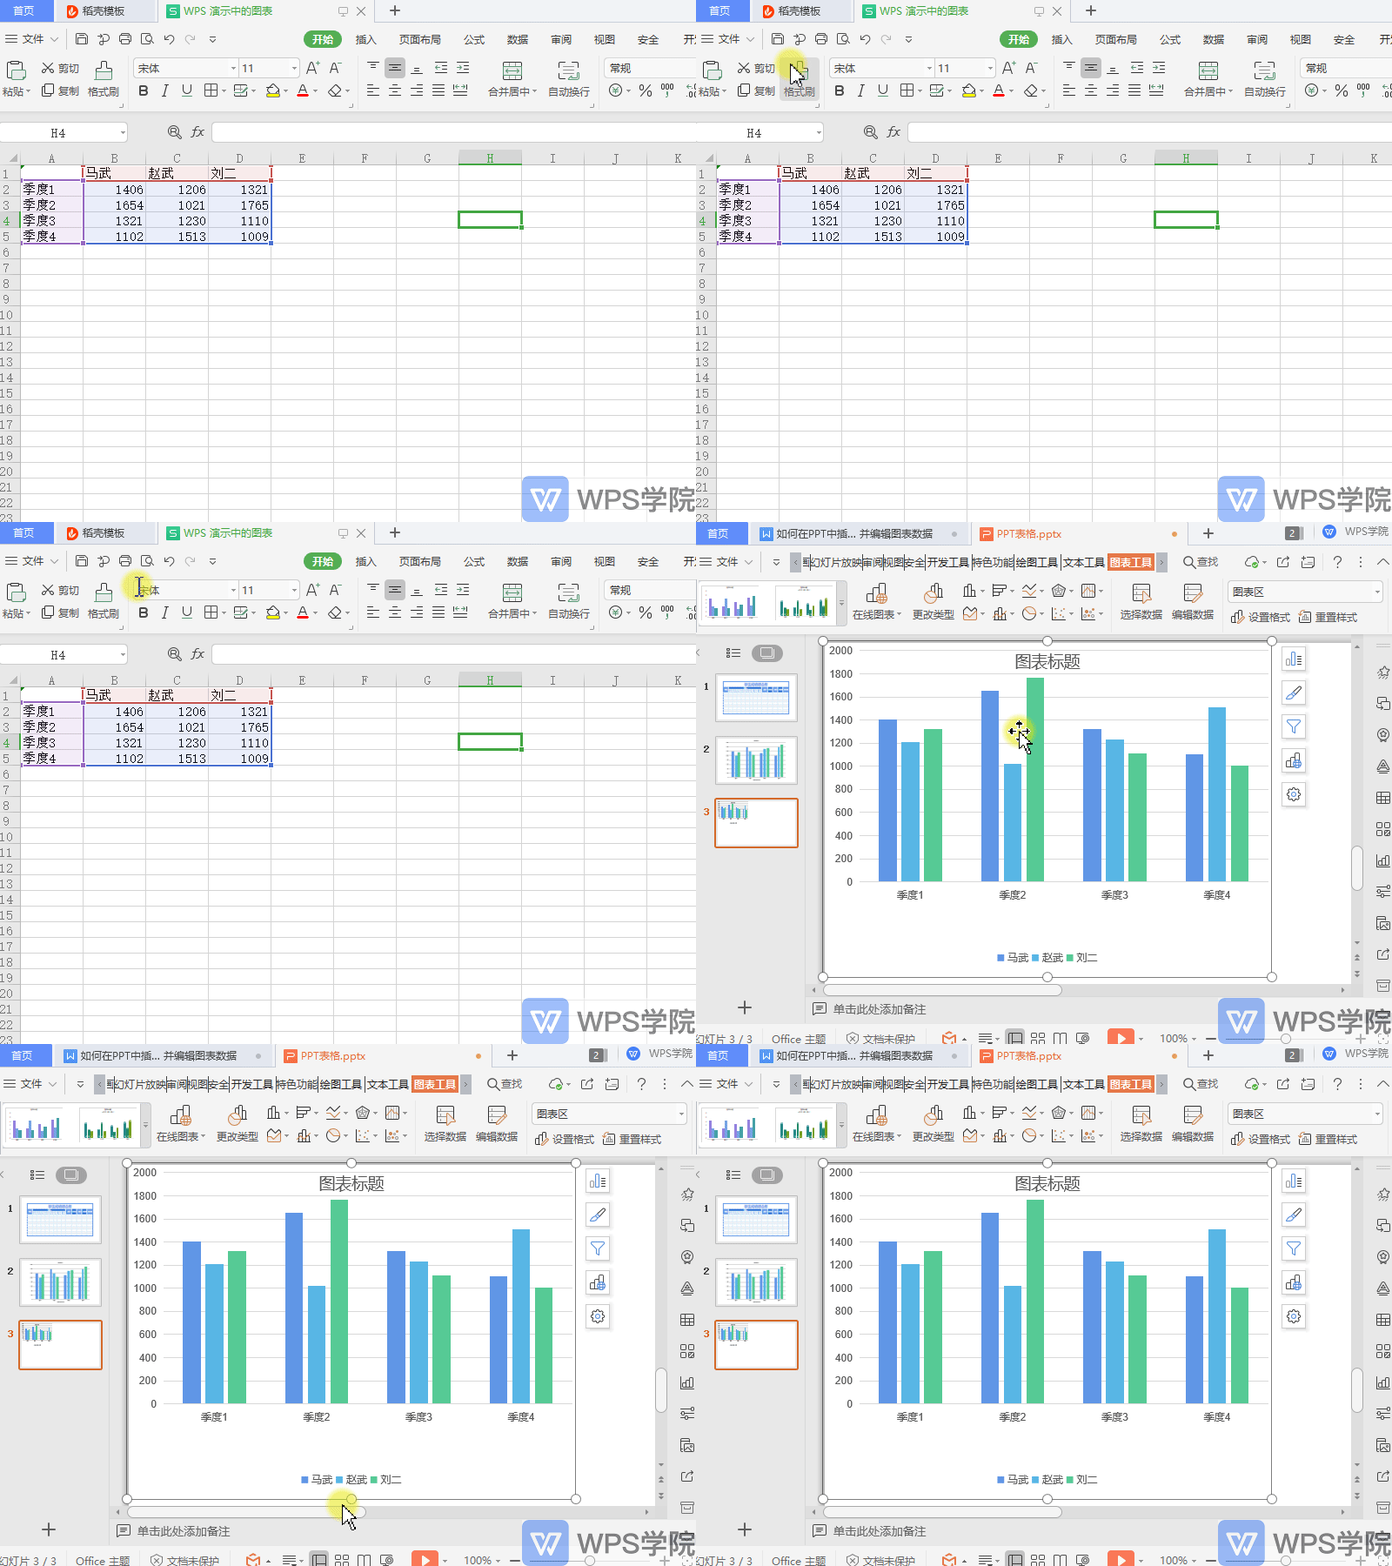
Click Chart Tools-Edit Data on the upper menu bar, and the "Chart in WPS Demo" will automatically open.
We modify the data in this table and click Save, so that the chart in the PPT will change based on the data in the data table.

Articles are uploaded by users and are for non-commercial browsing only. Posted by: Lomu, please indicate the source: https://www.daogebangong.com/en/articles/detail/yan-shi-xin-shou-jiao-cheng-ru-he-zai-PPT-zhong-cha-ru-tu-biao-bing-bian-ji-tu-biao-shu-ju.html

 支付宝扫一扫
评论列表(196条)
测试