- Picture and text skills
When processing data, in order to achieve an intuitive effect, it is often made into a data chart, but the original chart is not very good-looking.
Today I will teach you how to make chartsmore beautiful.

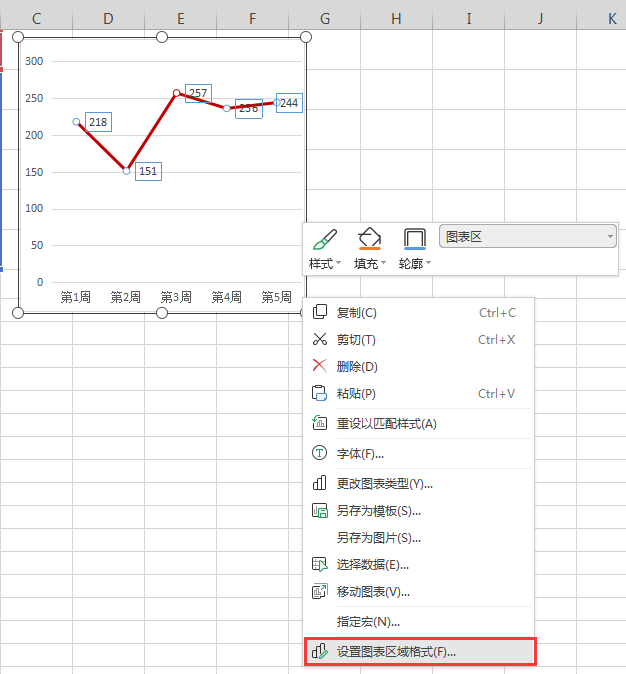
■ Take this chart as an example, right-click the chart and select "Format Icon Area";

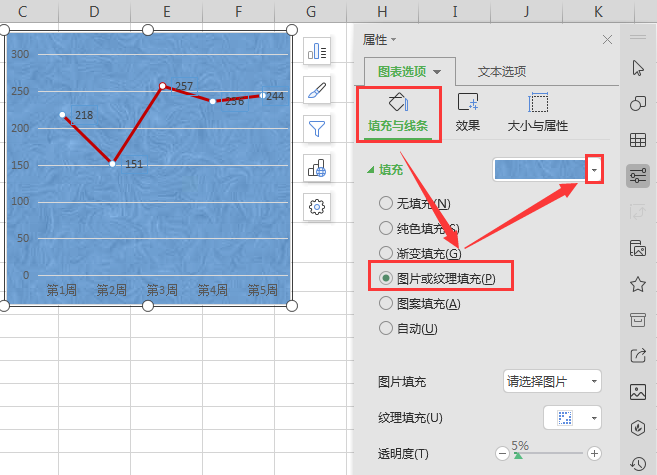
■ Click "Chart Options", select "Fill and Line" and click "Picture or Texture Fill" in the "Fill" option.
At this time, the white background turns into a blue textureBackground, click the drop-down box to switch the fill color at will.

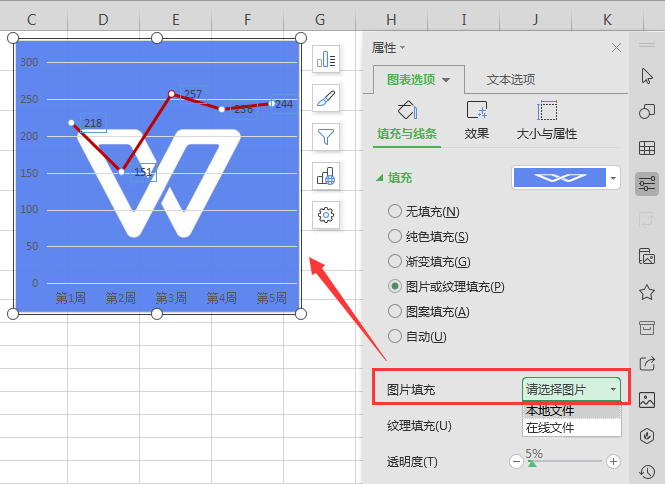
■ What if I want to add the company's logo image as the background?
Find "Image Fill" and select local or online images. My pictures aresaved locally, so I choose local pictures.
Find the path where the image is saved, click "Open", and the image you just selected will be filled in as the background of the chart.

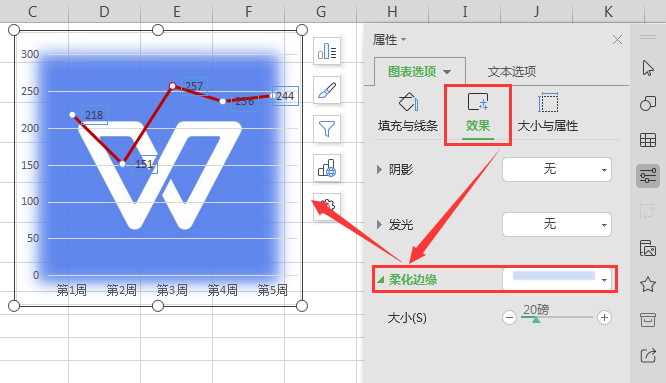
■ If you think the color is too dark, you can pull the "Transparency" progress bar to adjust it. You can also click "Effect" to perform secondary processing on the image.
Select "Soften Edges" and adjust it a little.

Articles are uploaded by users and are for non-commercial browsing only. Posted by: Lomu, please indicate the source: https://www.daogebangong.com/en/articles/detail/tu-biao-bu-gou-piao-liang-da-shen-jiao-ni-jue-zhao.html

 支付宝扫一扫
评论列表(196条)
测试