- Picture and text skills
When doing data aggregation work, if there are too many data categories, it will look very messy.
Today I will teach you how to use colors to represent data.
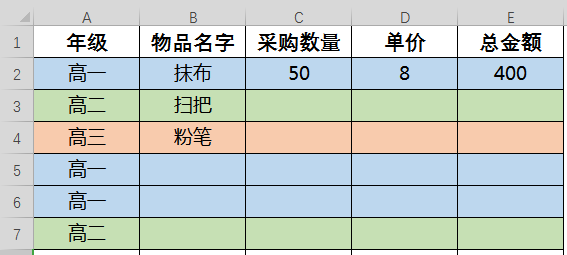
Take the following grade item purchase table as an example. Now I want to distinguish the data for different grades.

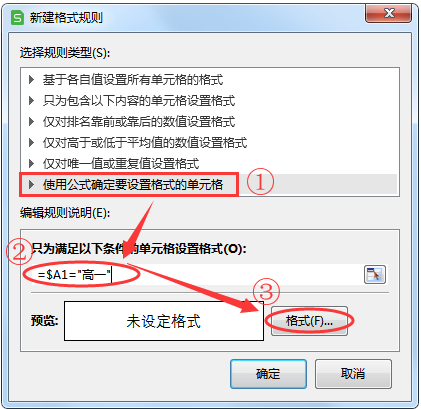
■ First select the A-E data columns, click "Conditional Formatting" under the "Start" menu bar, and select "New Rule".

■ In the pop-up dialog box, select "Use formulas to determine the cells to be formatted" and fill in the formula =$A1=高一 under the editing rule description

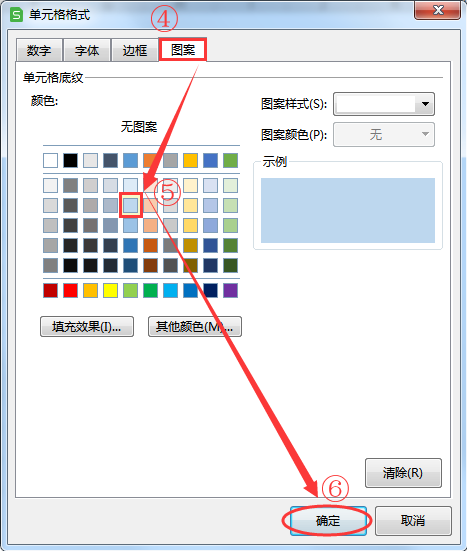
■ ThenClick "Format" and select " "Pattern" fill color, I choose light blue, which means that if you enter a higher value in column A, the cell will turn blue, click "OK"

■ Now go to column A and enter "高一", and this line will automatically turn into a light blue mark. Repeat the above operations for other grades.
After the settings are completed, enter the corresponding settings in the table and the color matching will be performed.

Articles are uploaded by users and are for non-commercial browsing only. Posted by: Lomu, please indicate the source: https://www.daogebangong.com/en/articles/detail/shu-ru-nei-rong-ji-zi-dong-pei-se-zen-me-zuo.html

 支付宝扫一扫
评论列表(196条)
测试