- Image and text skills
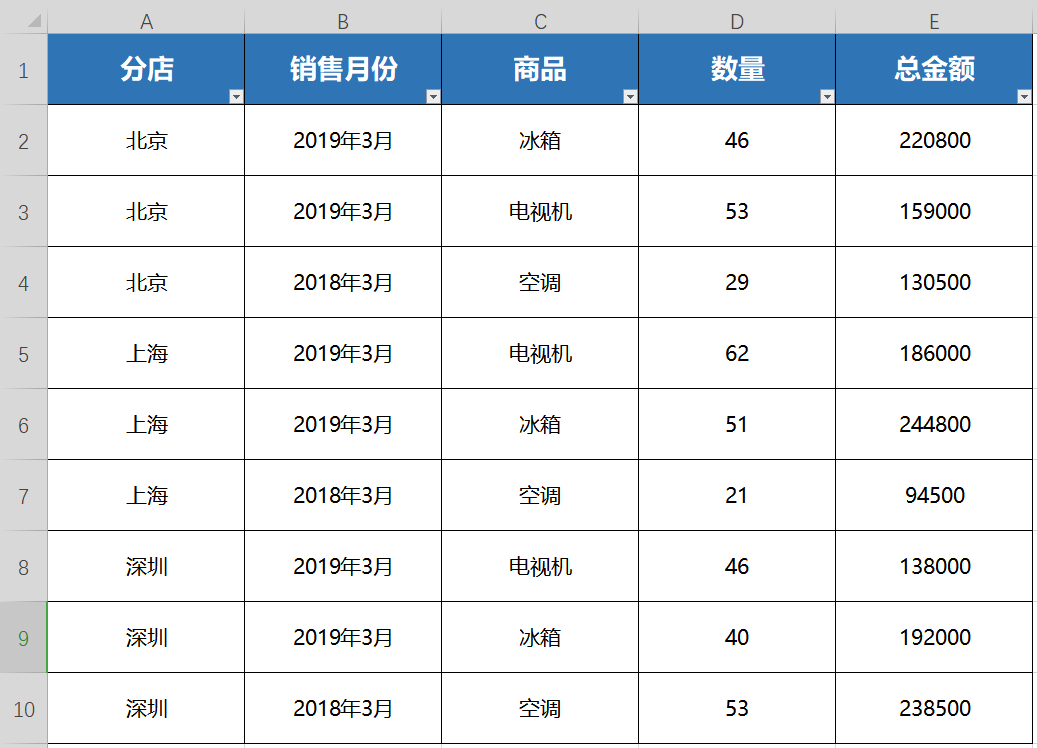
This is a data table of products sold by a certain brand branch in March. Now I want to count the total sales of each product and each branch. I can use the filter + sum function.
But the stepsare complicated. Today I will introduce a practical data processing tool - pivot table, which can quickly analyze and summarize data.

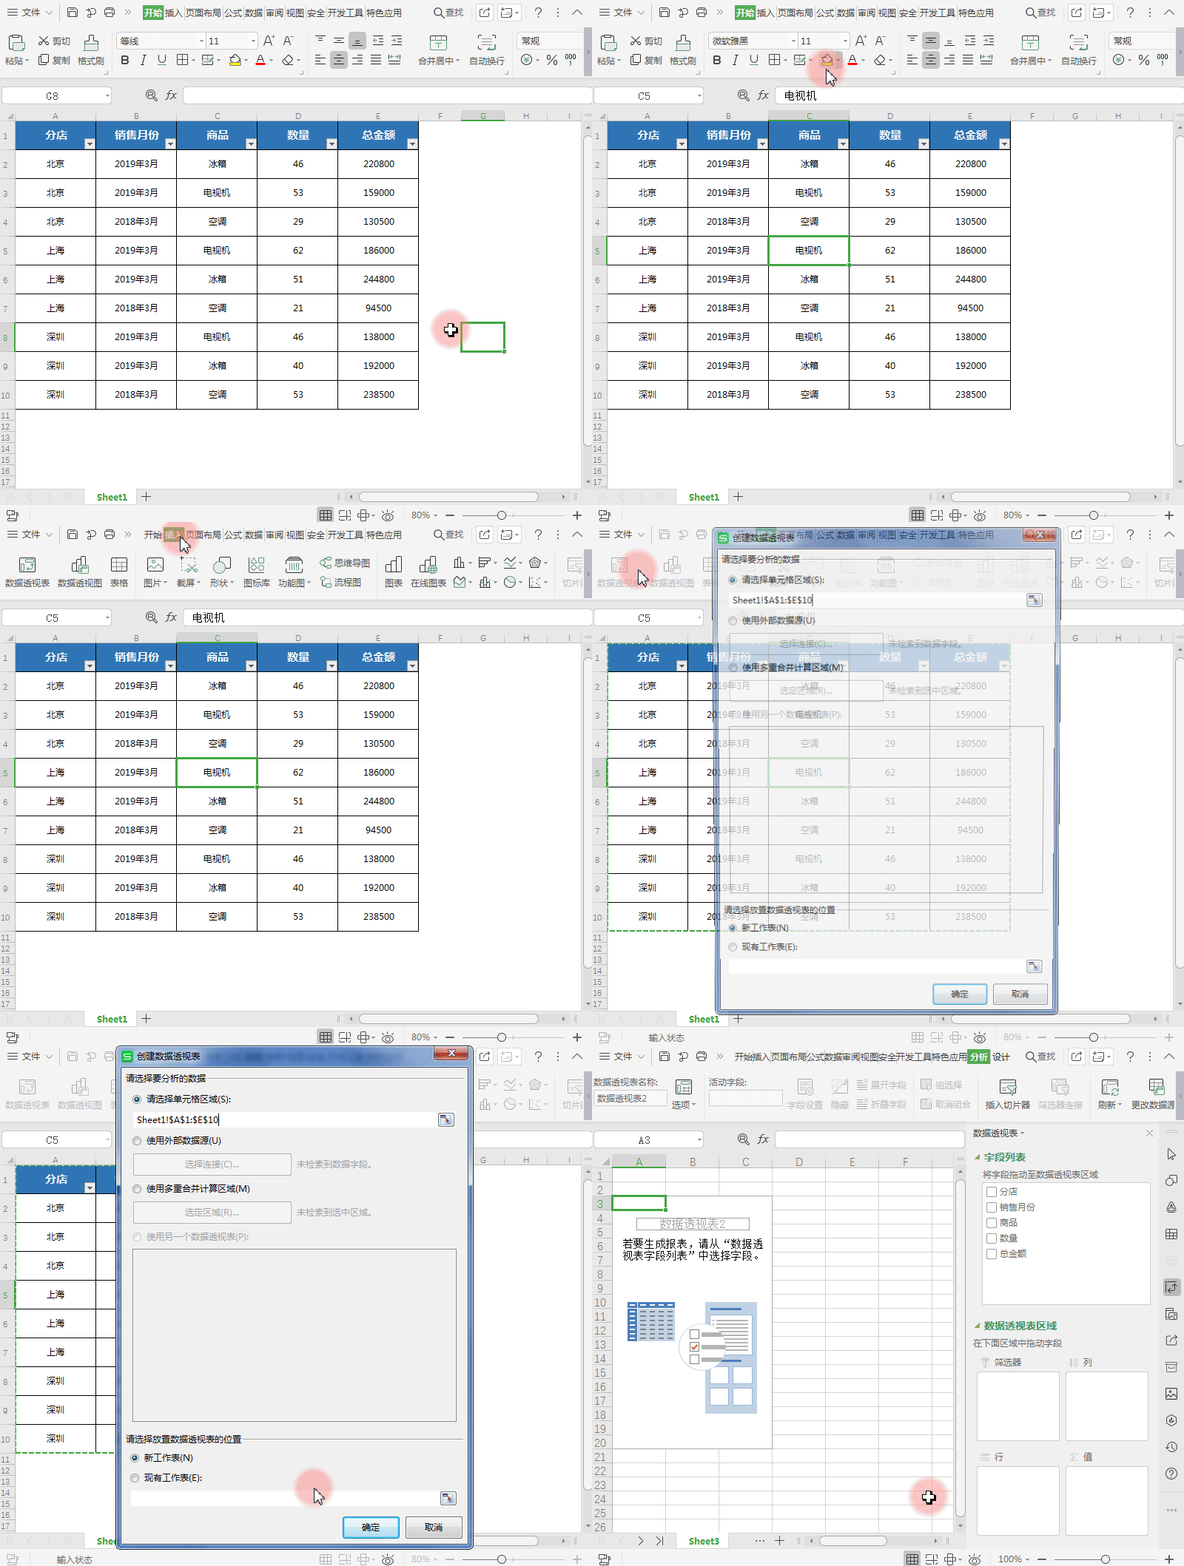
■ First, select a cell with data and click "Insert" - "Pivot Table" on the menu bar.
The area here will be automatically selected and does not need to be modified.Click "OK";
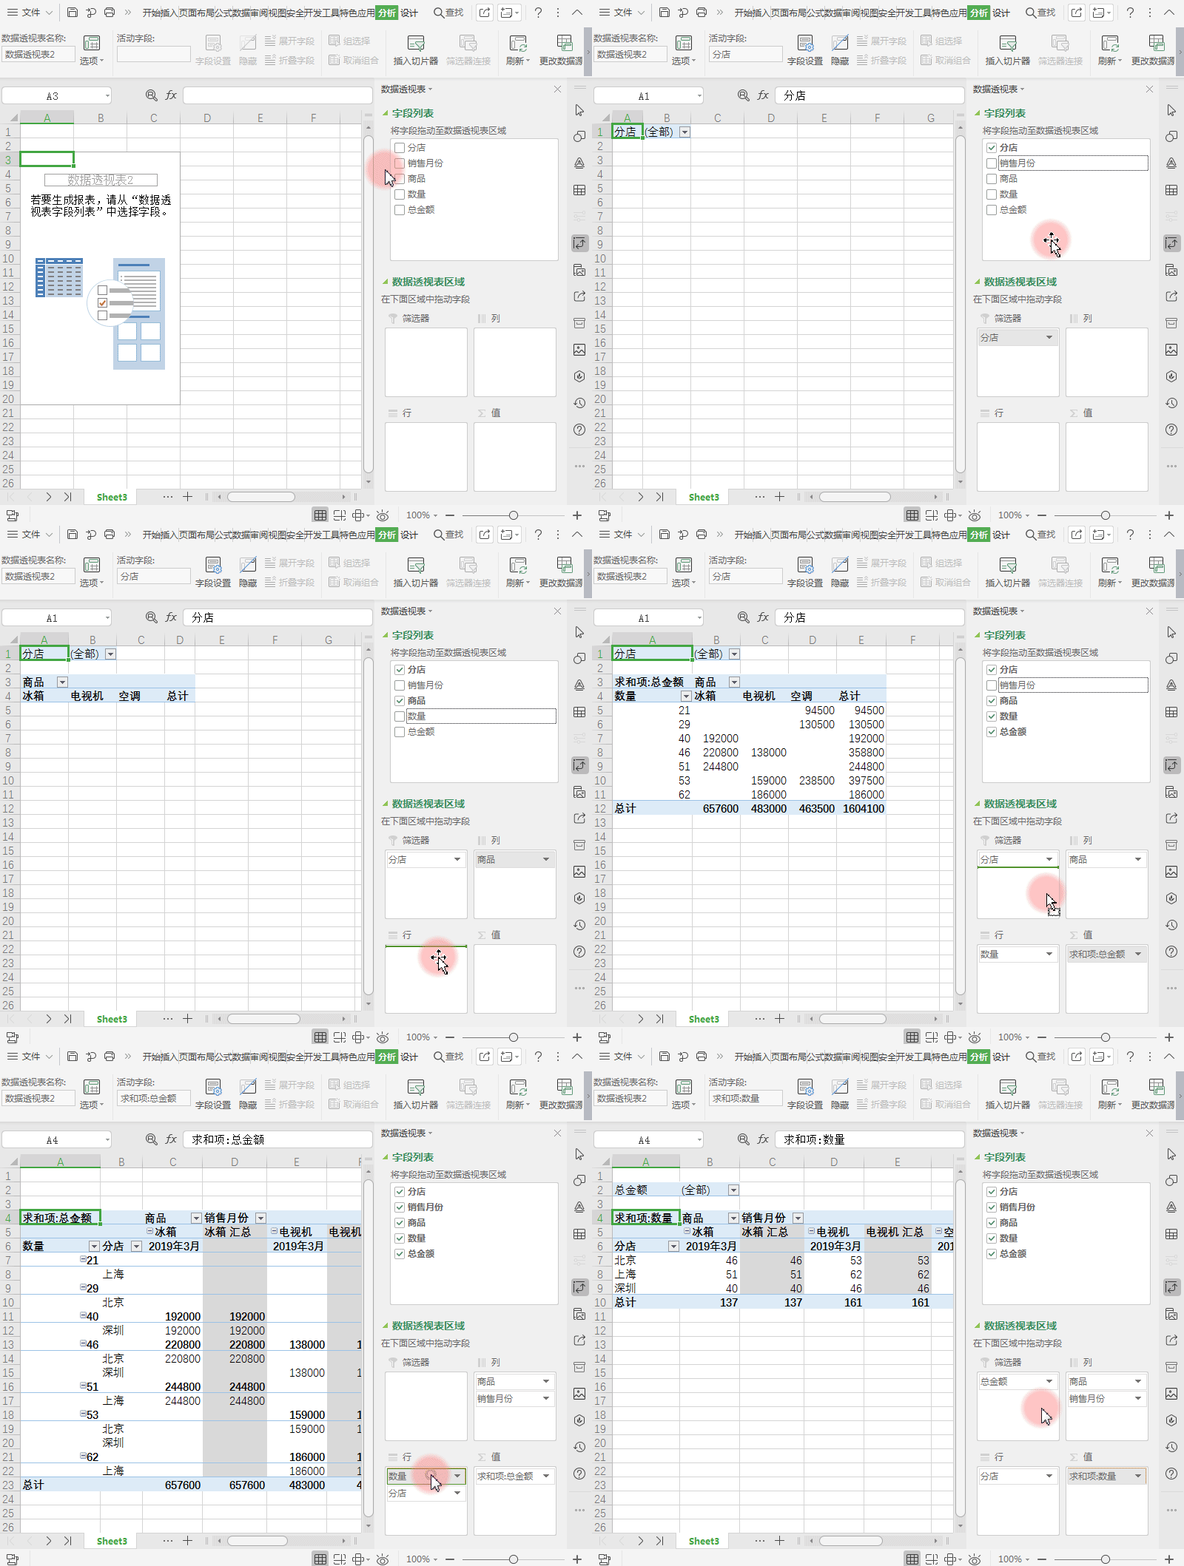
■ A new worksheet will pop up at this time, and you will see the PivotTable pane on the right, which is divided into two major sections, "Field List" and "PivotTable Area";
Andareaarea is divided into four parts, "row area", "column area", "value Area", "Filter".
Select the field that needs to be analyzed, long press and drag to the area where is needed, different views will appear. statistical results.
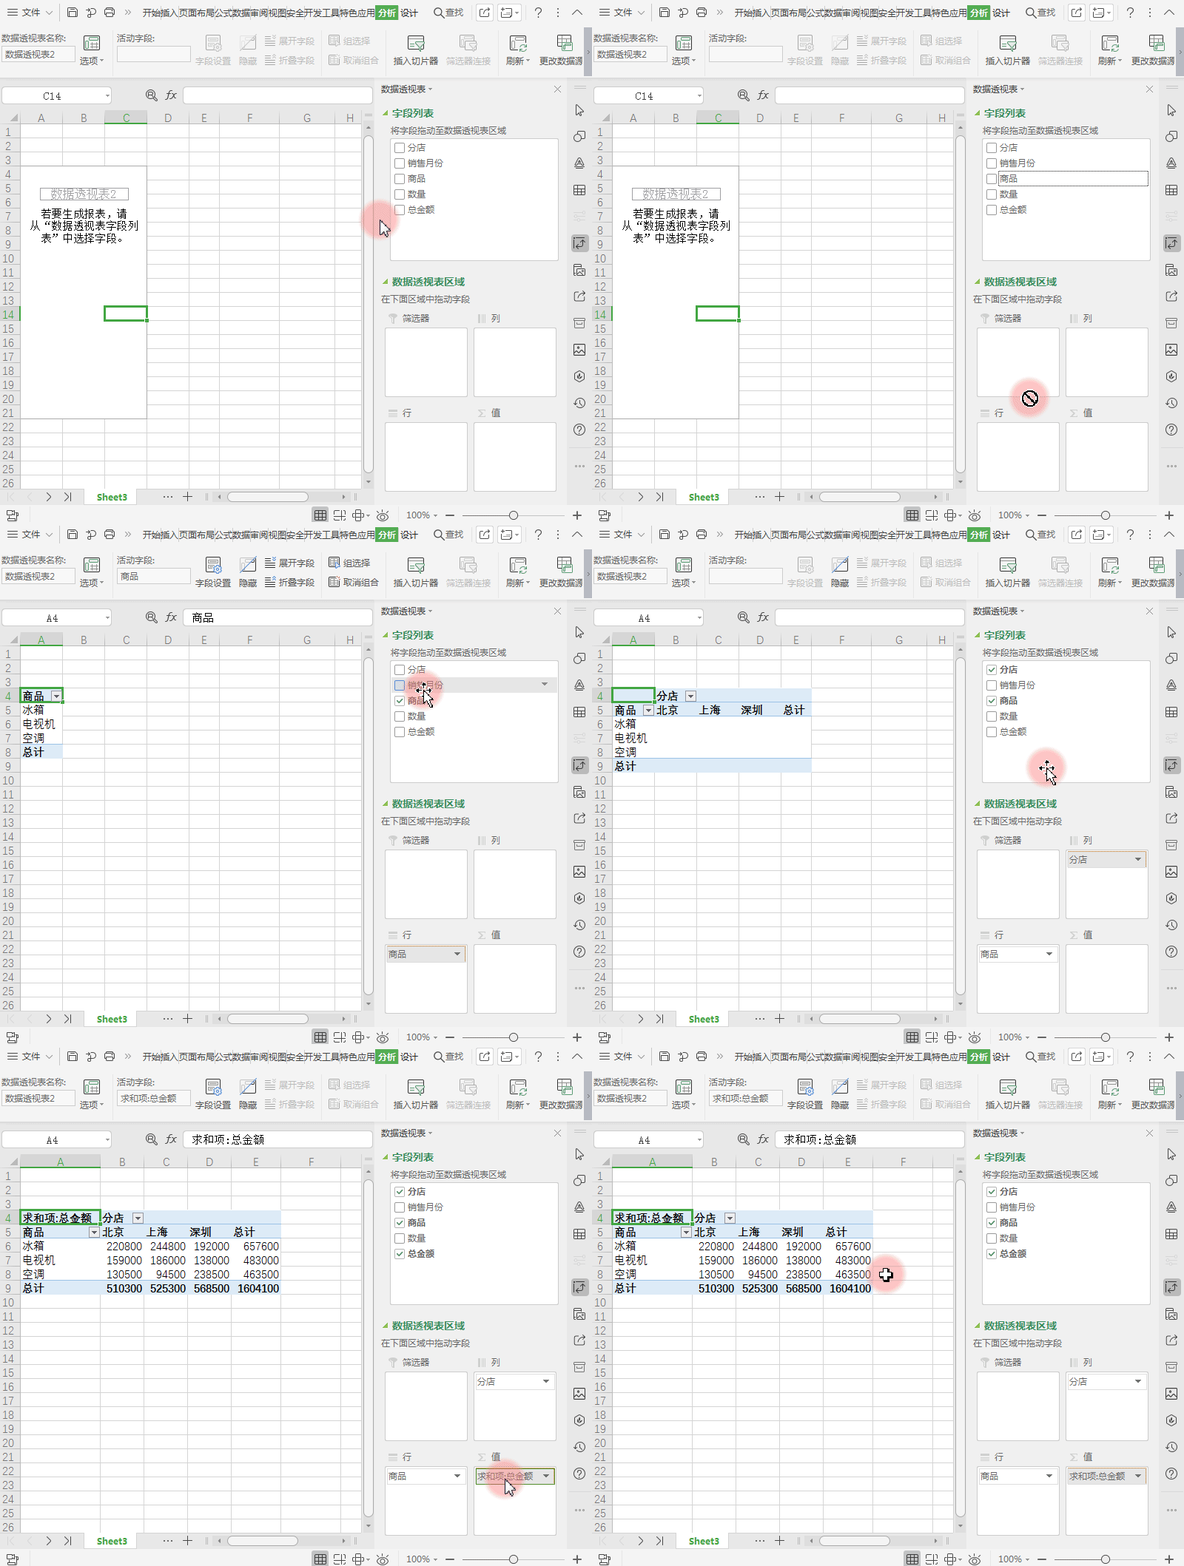
■ I want to count the total sales of each product and each branch.
So drag the "Product" field into the "Row Area", drag the "Branch" field into the "Column Area", Drag the "Total Amount" field into the "Value area".
At this point, you can see that the worksheet has automatically calculated the total sales of each product and each branch.
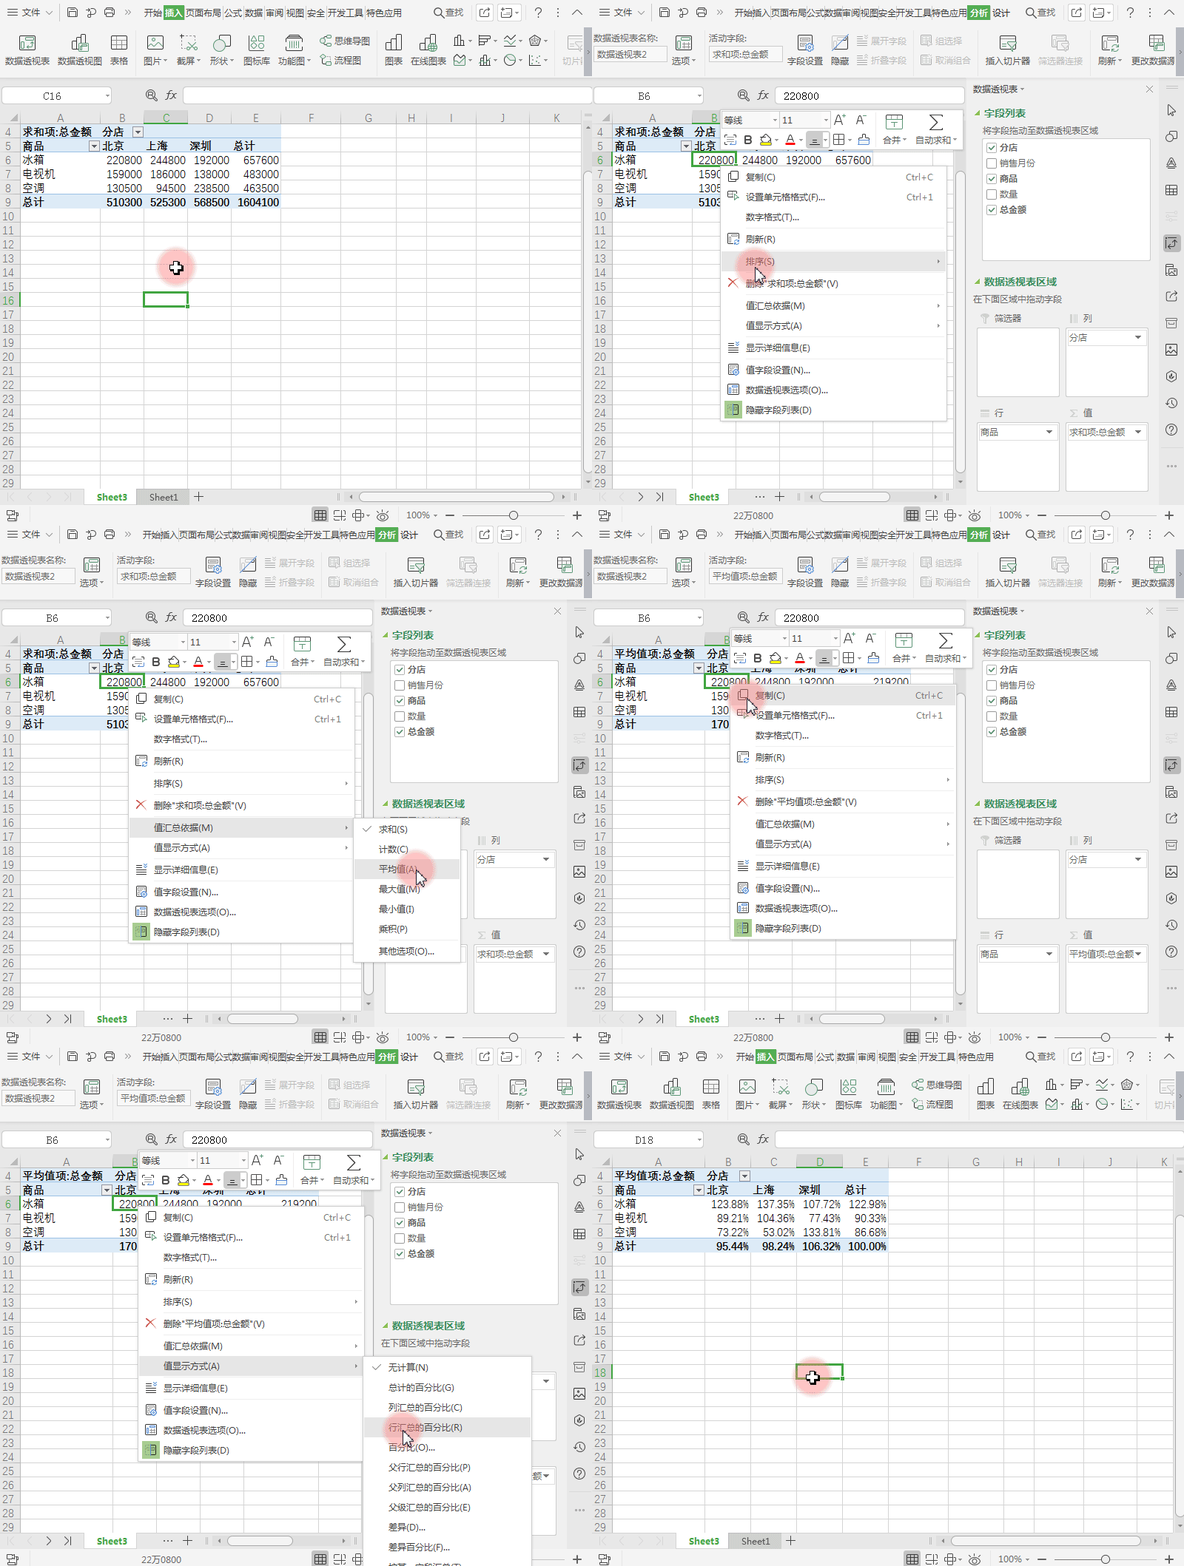
■ The "Value Summary" defaults to summation. We can also select a cell with data, right-click the mouse and find the "Value Summary Basis".
HereYou can choose "Count", "Average", "Maximum", etc.
Here you can see that the "value display mode" can also be changed, just set it according to your needs.
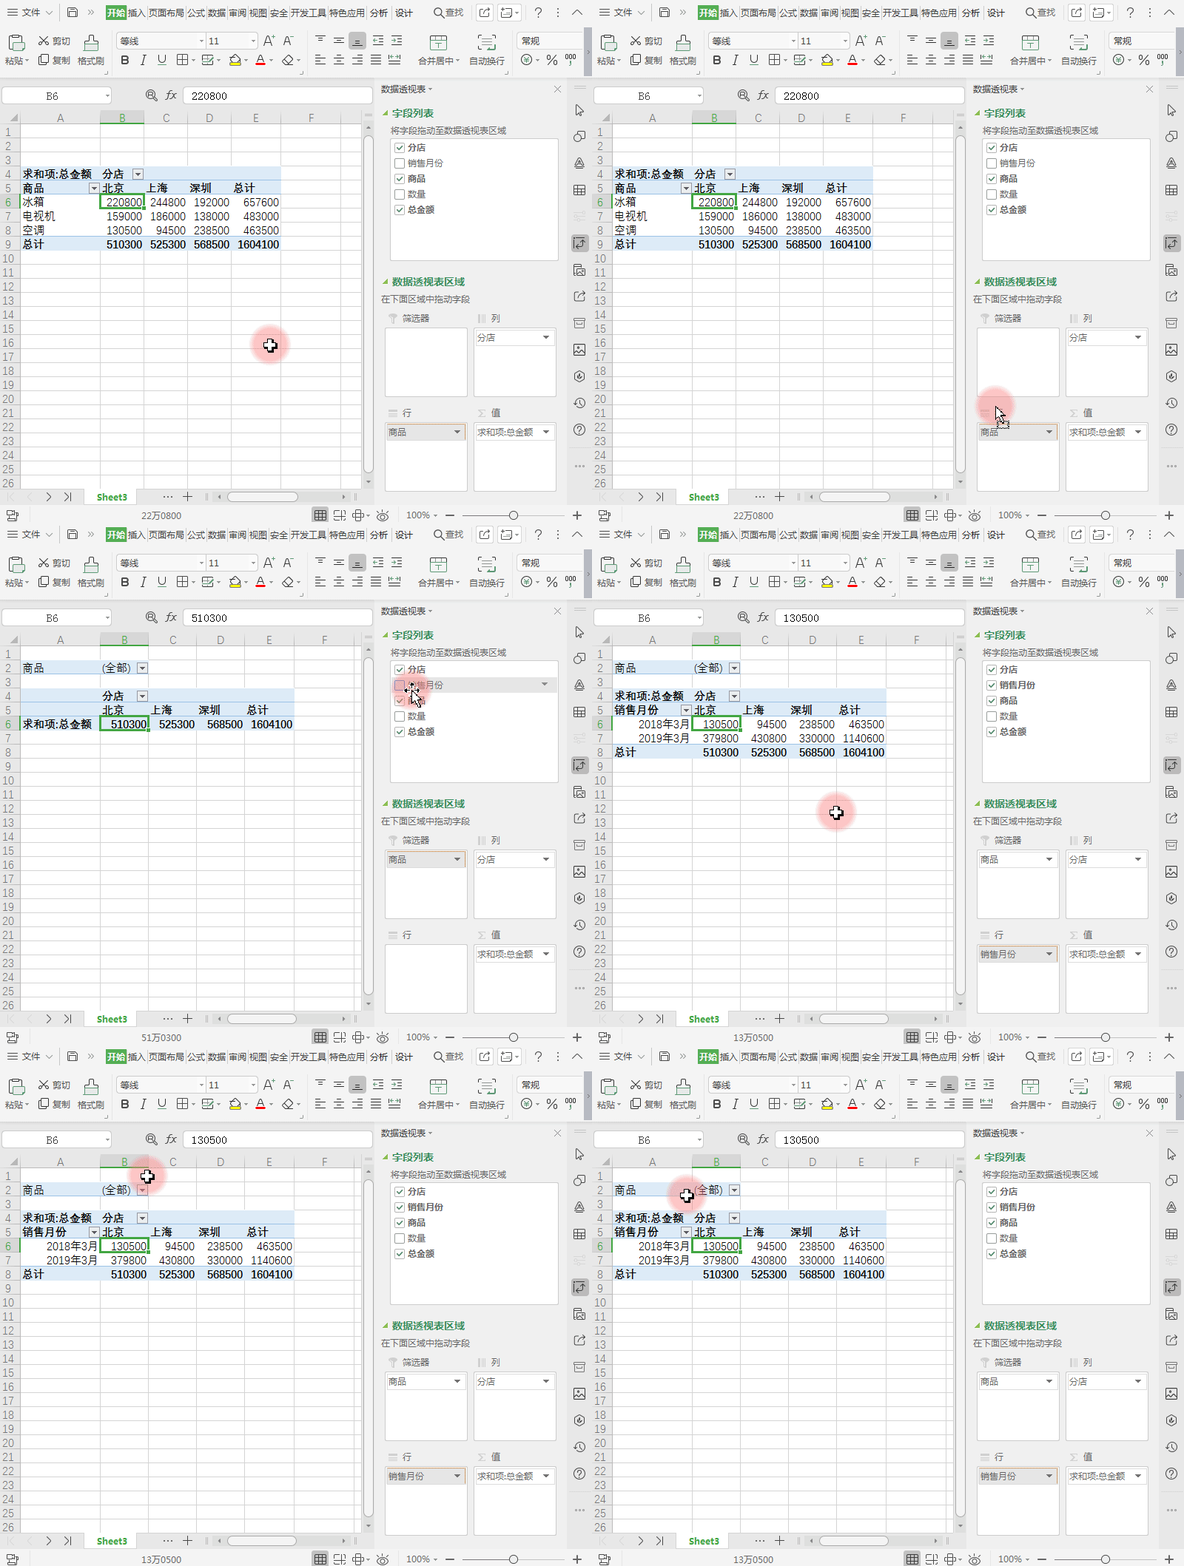
■ Now let’s take a look at the function of “filter” and adjust the position of the fields just now.
Drag "Product" to the "Filter" area and "Sales Month"Drag to the "Rows area" .
At this time, the table layout has changed, and a "product" item has been added to the first row;
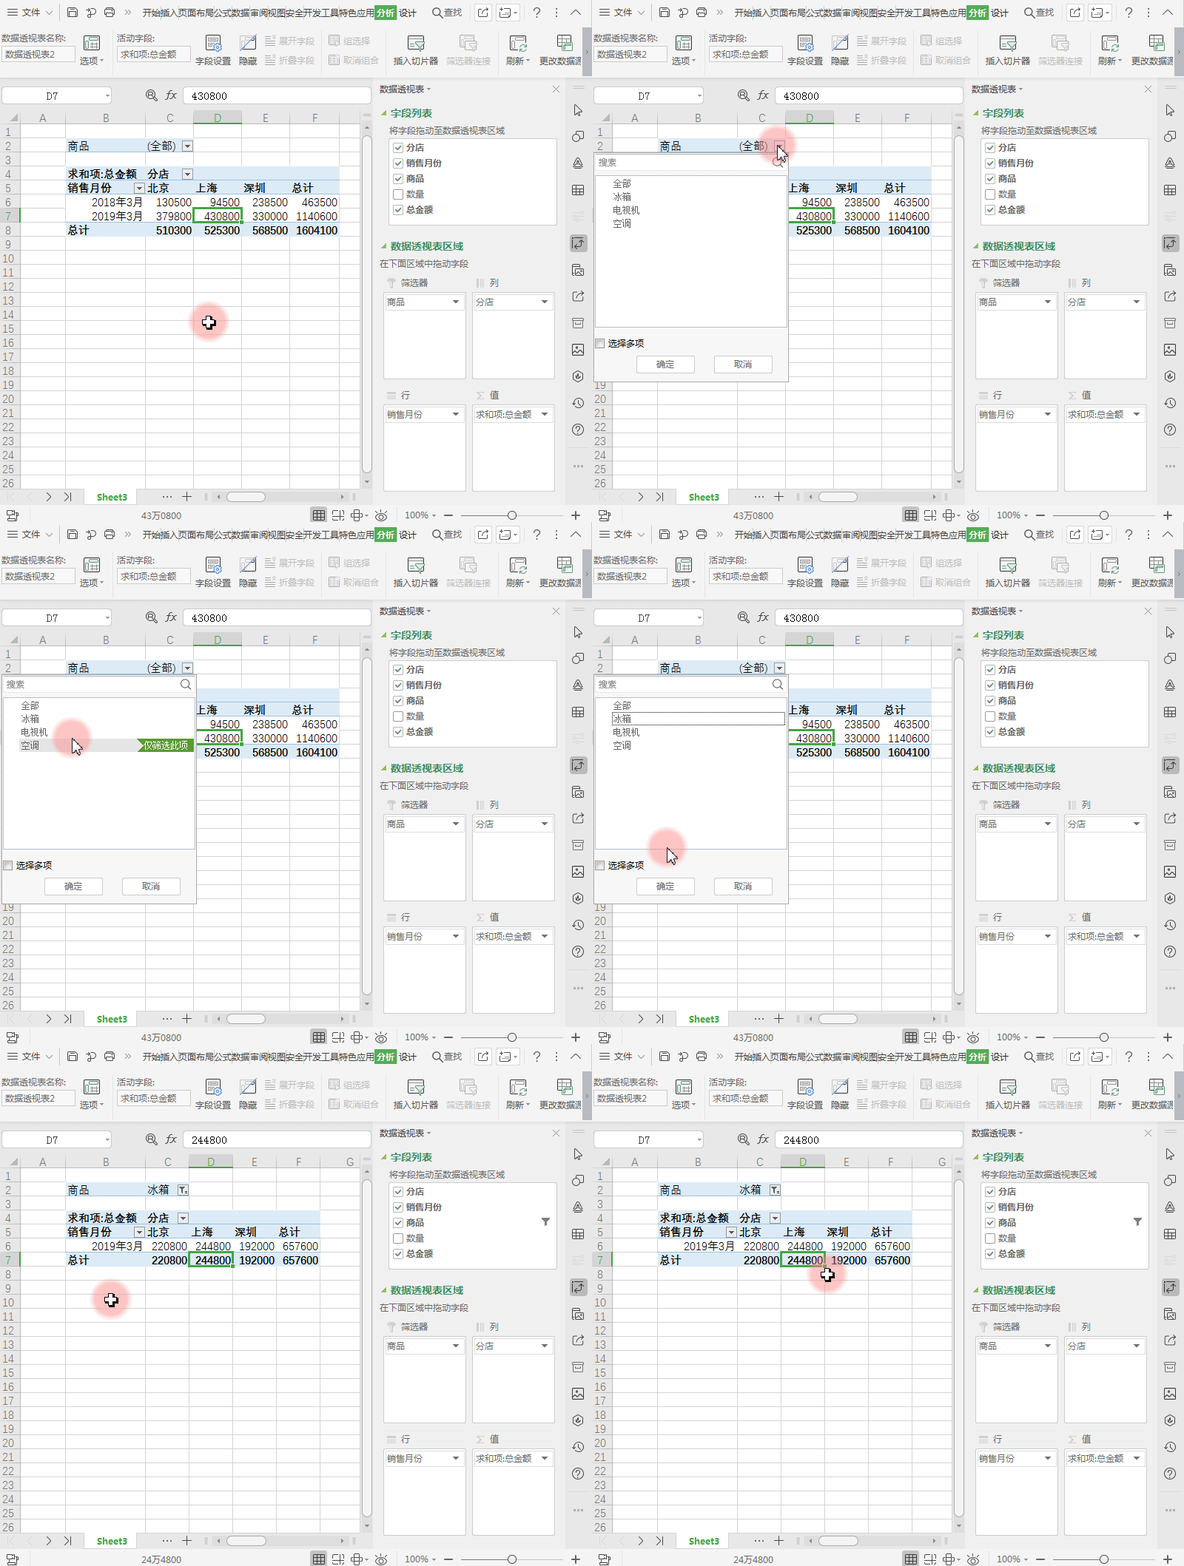
■ Click the "drop-down arrow" to select the product data you want to view, for example, select "Refrigerator".
Then the entire table now displays the sales data of refrigerators in each branch in March.
Articles are uploaded by users and are for non-commercial browsing only. Posted by: Lomu, please indicate the source: https://www.daogebangong.com/en/articles/detail/shu-ju-tou-shi-biao-shi-li-yu-ying-yong-3-fen-zhong-cong-ling-xue-hui-shu-ju-tou-shi-biao.html

 支付宝扫一扫
评论列表(196条)
测试