- Graphic and text skills
In data analysis, it is very useful to set conditional formatting for tables to make visual comparisons of data.
By following these steps, we can mark the table:

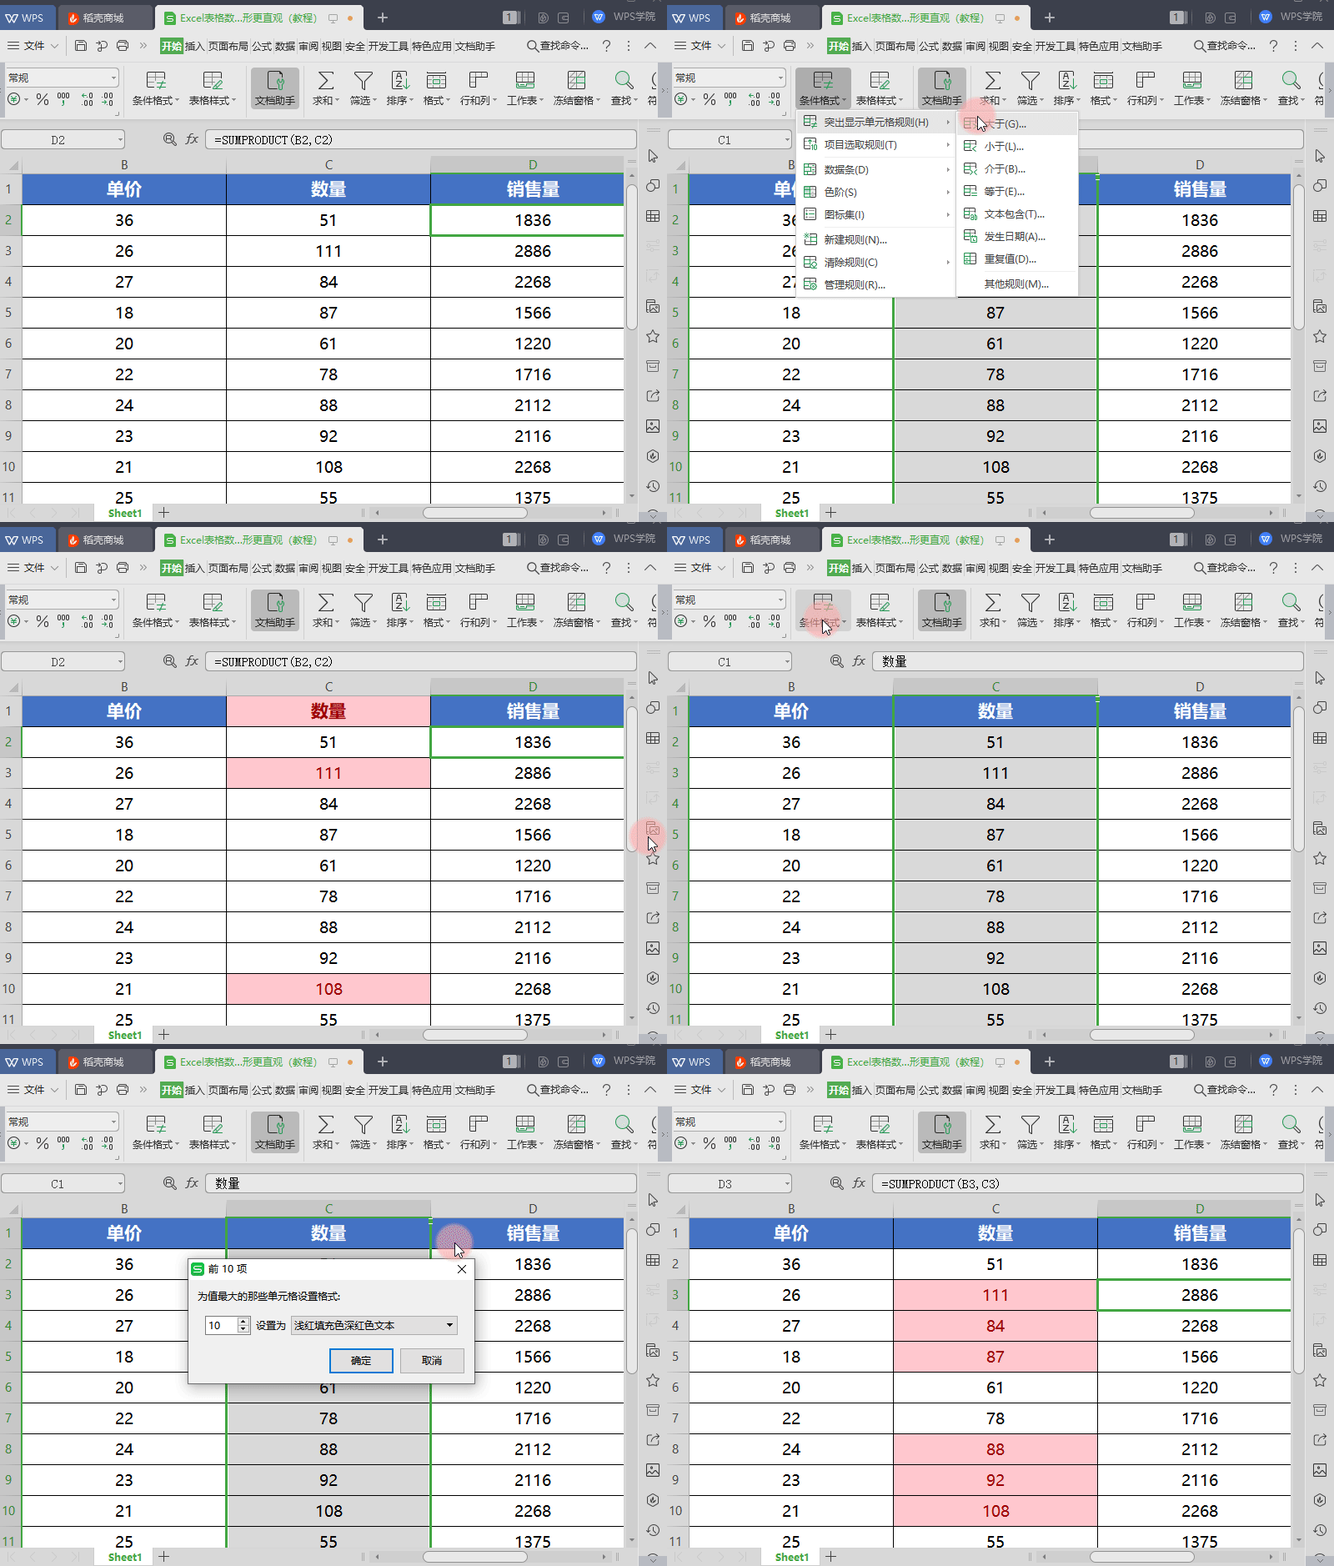
For example, if we want to filter out and label items with a quantity greater than 100, we can do this:
First, select the quantity range, then select Conditional Formatting on the Home tab, followed by Highlight Cell Rules. In the pop-up window, you can choose different rules, such as greater than, less than, between, equal to, etc.
Select the "Greater than" option, enter 100 in the condition, and set the fill color to light red and the border color to dark red to mark cells with a number greater than 100.
We can also select the top ten items to mark. In the "Item Selection Rules", you can choose options such as the first 10 items, the last 10 items, the top 10%, and the last 10%. Select "Top 10 Items" and set the corresponding fill and border colors.

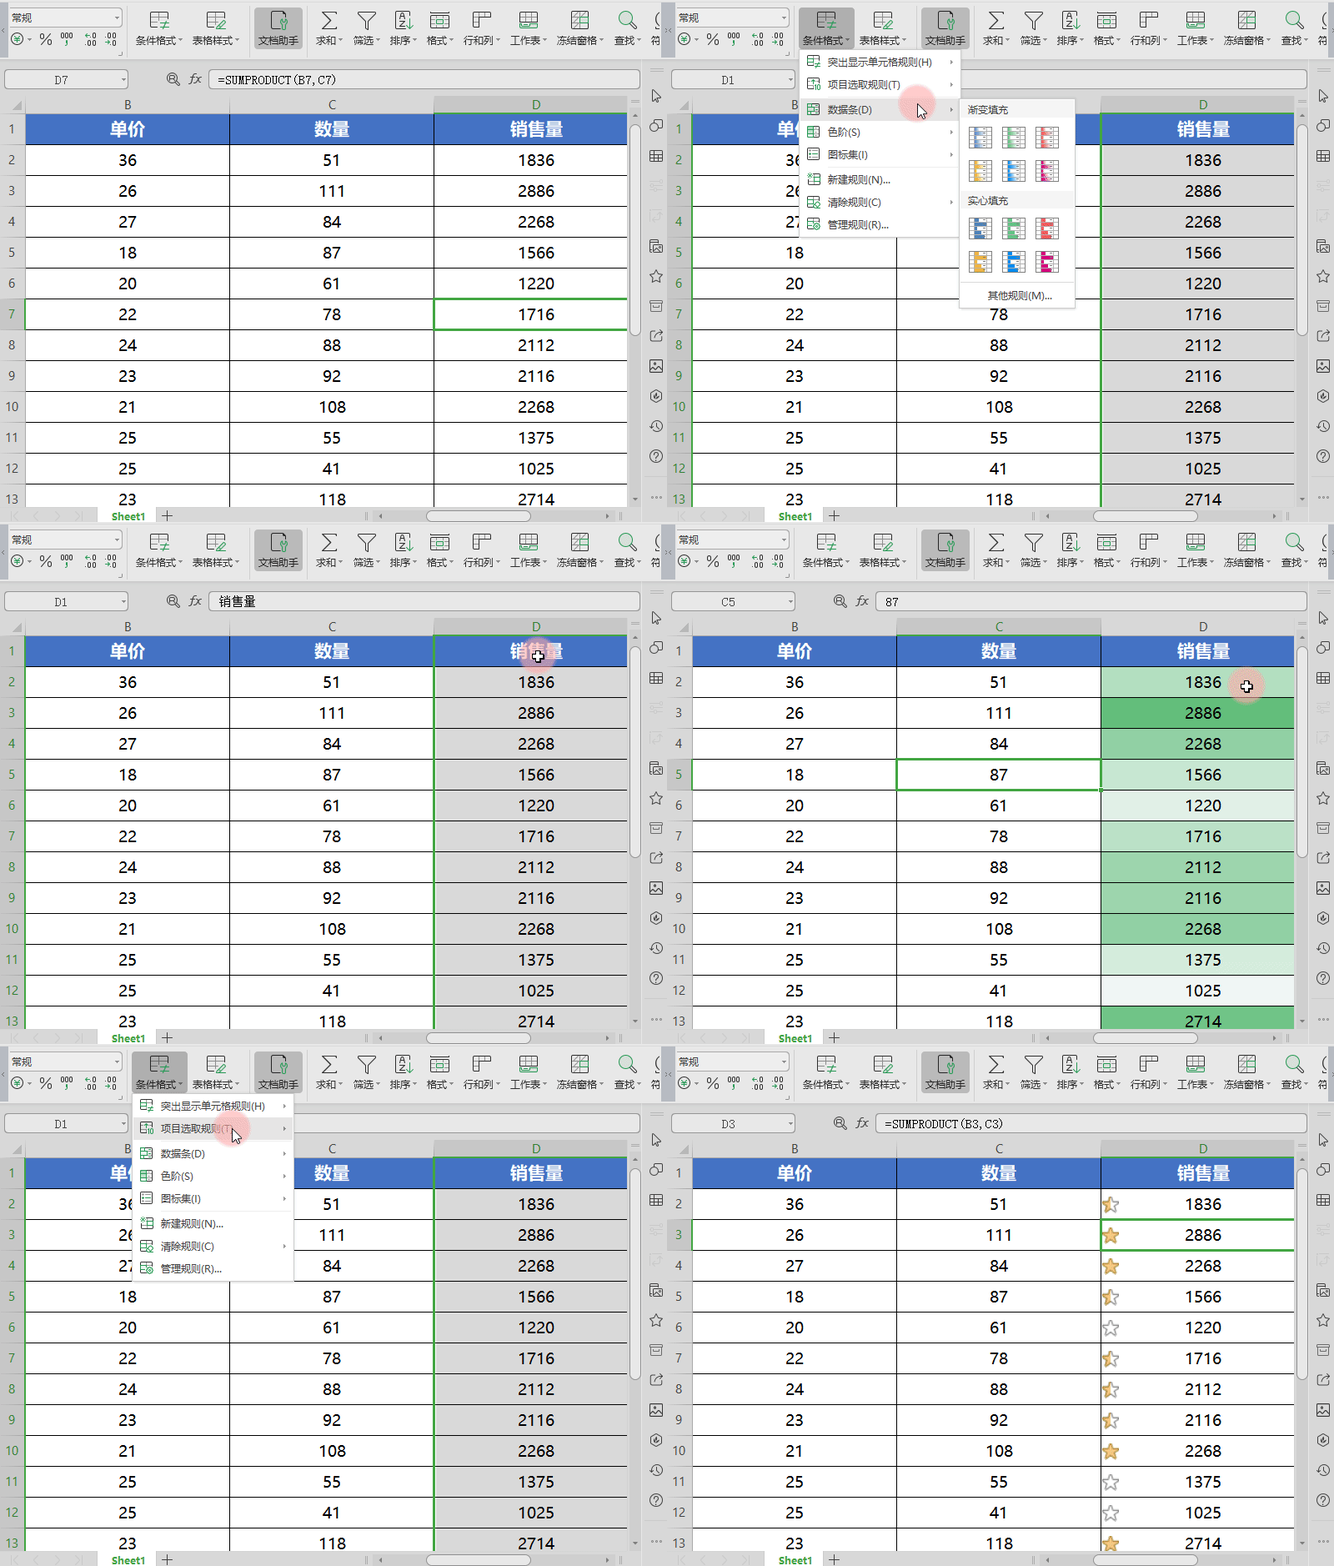
Data bars are a tool for visually displaying data trends. Select the sales volume area and click the "Data Bar" option to choose styles such as gradient fill and solid fill. Select gradient fill blue to more intuitively display the comparison of data.
Color scale is also a way to show data trends. Select the sales volume area, select "Color scale", and click "Green and white scale", so that the data trend will be presented in color scale.
Graph sets can also show data trends. Select the sales area, click "Graph Set", select "Level-Three Stars", and the data trend will be presented graphically.

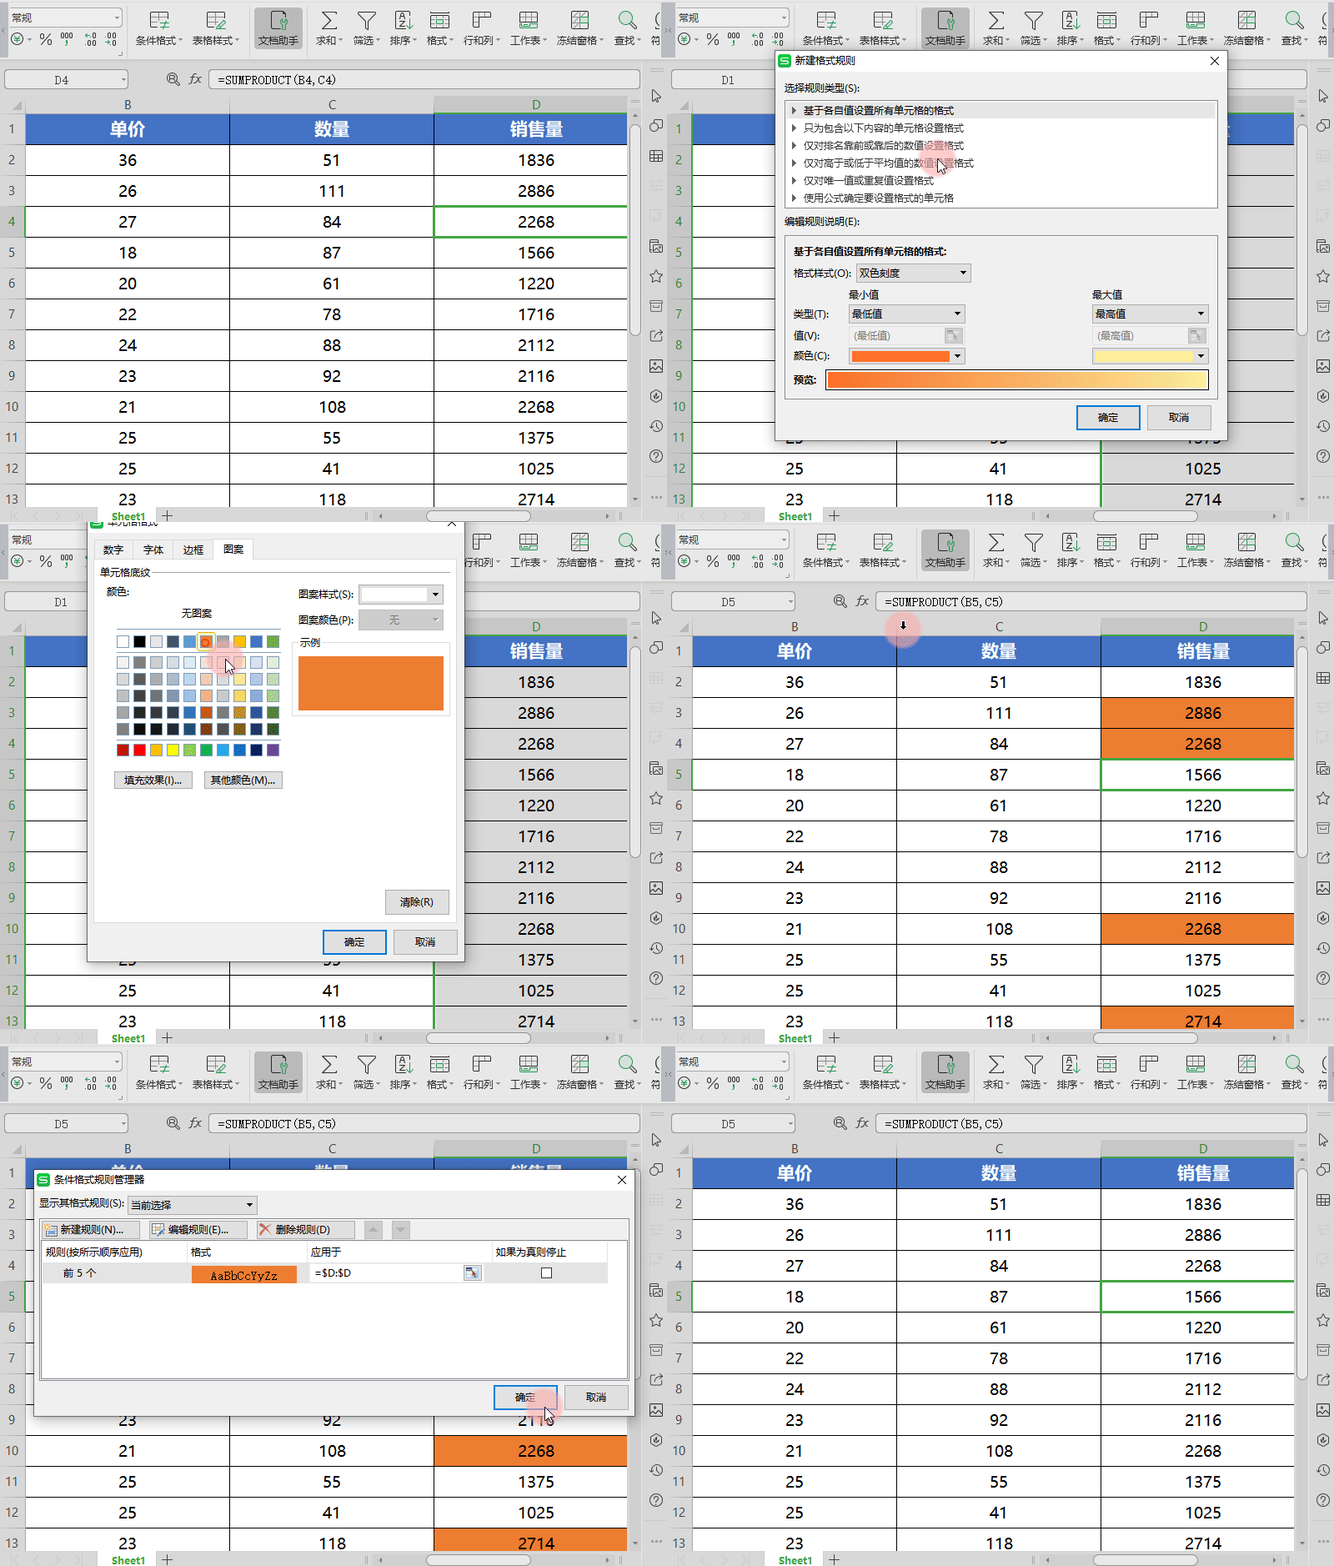
If the preset rules don't meet your needs, we can create custom rules. Select the sales area, click "New Rule", select the rule type in the pop-up dialog box, such as "Only format the top or bottom values", and enter the specific ranking, such as the top 5. Select the format in the preview, such as pattern color, and click OK.
In "Manage Rules", we can create new rules, edit rules or delete rules. If desired, you can also clear the rules for selected cells or clear all rules.

Using these functions can make the data more intuitive and help us better understand and analyze the data.
Articles are uploaded by users and are for non-commercial browsing only. Posted by: Lomu, please indicate the source: https://www.daogebangong.com/en/articles/detail/shu-ju-ke-shi-hua-ru-men-li-yong-tiao-jian-ge-shi-jian-hua-biao-ge-fen-xi.html

 支付宝扫一扫
评论列表(196条)
测试