Progress management is a common application of the project management process, which is very good By mastering the progress status, you can have a comprehensive understanding of the development of the entire project. You must have a comprehensive understanding of the development of anything, especially very important things.

For any project, first there is a plan, then a plan is made, and then it enters the construction and implementation stages. As a senior executive, you do not need to understand all the details, but you clearly know where the project is going. A phase is a necessary aspect.
If the progress is not well controlled, some follow-up work may be blocked, which will affect the smooth progress of the entire process and ultimately lead to failure or economic losses. Believe in these results, no one likes to see them.
This section introduces how to use Excel VBA to create a schedule.
Actually, the focus is not on the details of how to implement it with code. The focus is on having a detailed understanding of how the entire table is formed, and then combining it with your own needs to complete the process at your own pace. Table, this is a very good learning process.
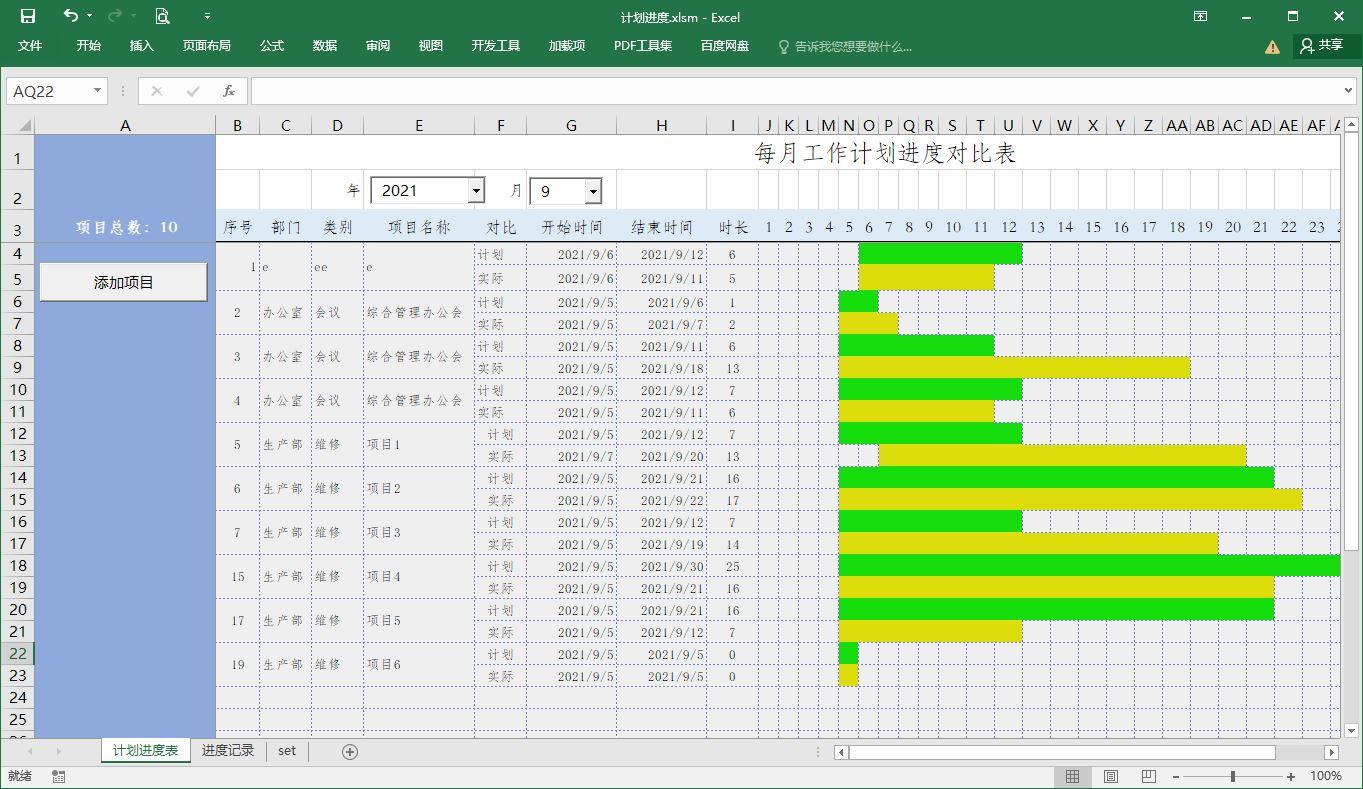
The picture above shows the results of the entire worksheet. The first half of the table is the progress project content, and the second half is the graphical display of the progress results.
This schedule is based on months. If cross-month progress management is implemented, the table structure will be changed. Therefore, progress management is not a fixed model. If it is based on years or ten years, The unit is another matter.
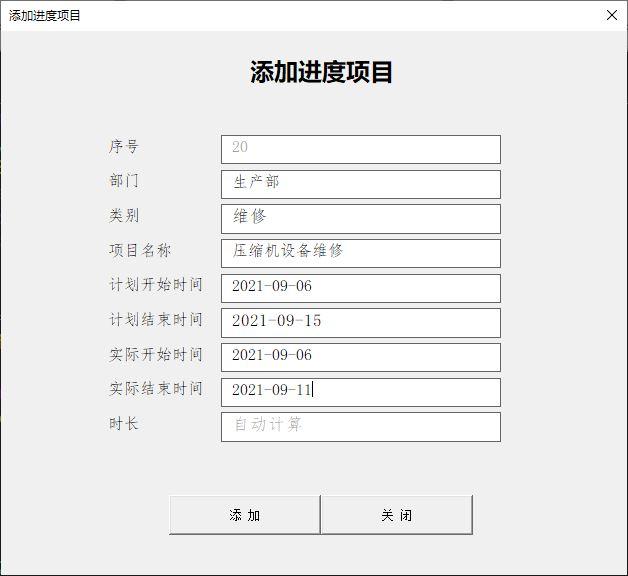
The picture below shows the Add Progress dialog box. For the convenience of input, the form input function is directly implemented to avoid errors in the worksheet.
The form is very simple, but the code behind it is not. Some codes will be attached at the end of the article for learning reference.
The entire worksheet implementation process starts here. As long as the corresponding project content is entered, it will be automatically added to the worksheet, and time calculation and graphical representation will be performed without human intervention.
All you have to do is analyze the chart.
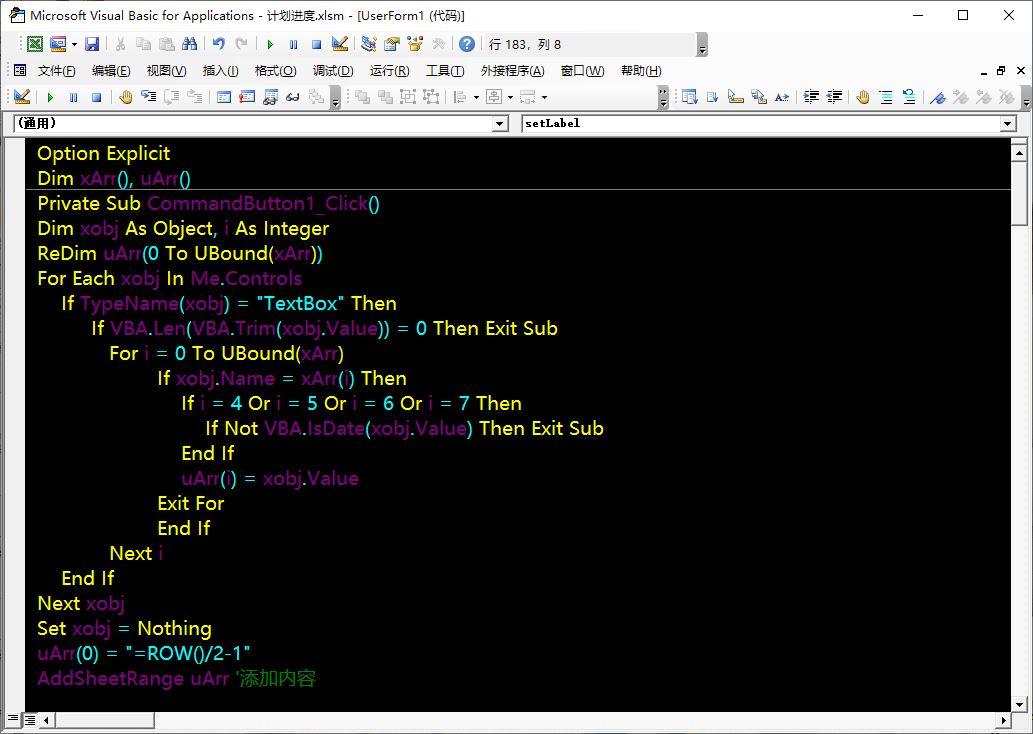
Add button code
Private Sub CommandButton1_Click()Dim xobj As Object, i As IntegerReDim uArr(0 To UBound(xArr))For Each xobj In Me.Controls If TypeName(xobj) = "TextBox" Then If VBA.Len( VBA.Trim(xobj.Value)) = 0 Then Exit Sub For i = 0 To UBound(xArr) If xobj.Name = xArr(i) Then If i = 4 Or i = 5 Or i = 6 Or i = 7 Then If Not VBA.IsDate(xobj.Value) Then Exit Sub End If uArr(i) = xobj.Value Exit For End If Next i End IfNext xobjSet xobj = NothinguArr(0) = "=ROW()/2-1"AddSheetRange uArr 'Add contentAddNewSheet uArr 'Add record tableEnd SubArray code
Private Sub getXarr() xArr = Array("Serial Number", "Department", "Category", "Project Name", _ "Planned Start Time", "Planned End Time", "Actual Start Time" , "Actual end time", "Duration")End SubAdd project process code (AddSheetRange())
Private Sub AddSheetRange(uArr)Dim s As Worksheet, cell As Range, ic As Integer, ix As IntegerDim st1 As Integer, st2 As Integer, xt1 As Integer, xt2 As IntegerSet s = ActiveSheetSet cell = s. Range("B4:AN5")cell.Insert shift:=xlDownWith cell .ClearFormats With .Font .Size = 10 .Name = "imitate Song" End With For ic = 1 To 4 cell.Cells(1, ic).Value = uArr(ic - 1) s.Range(cell.Cells(1, ic), cell.Cells(2, ic)).Merge Next ic .Interior.Color = RGB(239, 239, 239) .Borders.LineStyle = 3.Borders.Color = RGB(112, 121, 211) cell.Cells(1, 5).Value = "Plan" cell.Cells(2, 5).Value = "Actual" cell.Cells(1, 6) .Value = uArr(4) 'Planned start time cell.Cells(1, 7).Value = uArr(5) 'Planned end time cell.Cells(2, 6).Value = uArr(6) 'Actual start time cell .Cells(2, 7).Value = uArr(7) 'Actual end time cell.Cells(1, 8).Value = "=H4-G4" 'VBA.DateDiff("d", uArr(4), uArr (5)) 'Planned duration cell.Cells(2, 8).Value = "=H5-G5" 'VBA.DateDiff("d", uArr(6), uArr(7)) 'Actual duration st1 = VBA. Day(uArr(4)) + 8 st2 = VBA.Day(uArr(5)) + 8 xt1 = VBA.Day(uArr(6)) + 8 xt2 = VBA.Day(uArr(7)) + 8 s. Range(cell.Cells(1, st1), cell.Cells(1, st2)).Style = "S1" s.Range(cell.Cells(2, xt1), cell.Cells(2, xt2)).Style = "S2" ix = Application.WorksheetFunction.CountA(s.Range("B:B")) - 2End WithEnd SubDrawing of Gantt graphics It is an assignment to the table style. In this example, the style names are "S1" and "S2".
The first code is to set the style, including determining whether the style exists, adding and other operations.
Welcome to follow and collect
---END---
Articles are uploaded by users and are for non-commercial browsing only. Posted by: Lomu, please indicate the source: https://www.daogebangong.com/en/articles/detail/ru-he-zhi-zuo-xiang-mu-jin-du-ji-hua-biao-gan-te-tu-xian-shi-kan-wan-zhei-xie-yi-mu-liao-ran.html
 支付宝扫一扫
评论列表(196条)
测试