- Image and text skills
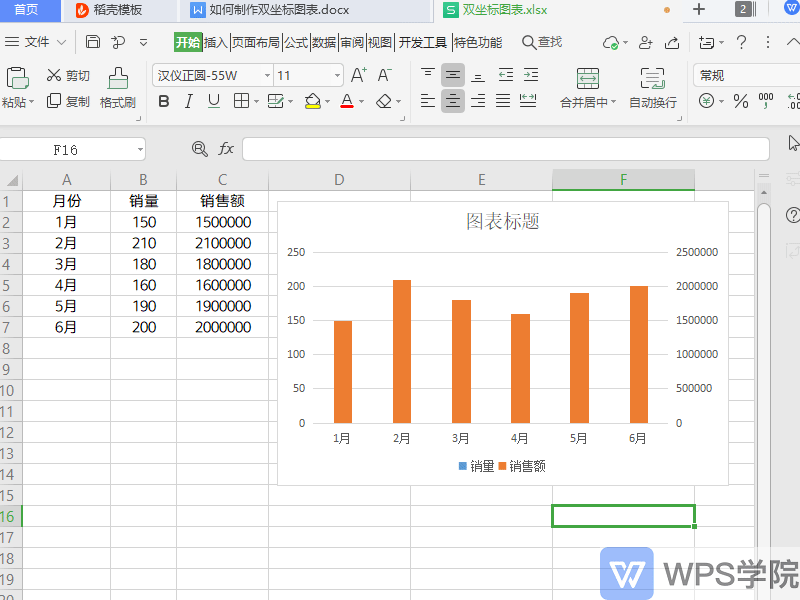
When we make tables and charts, we usually use a horizontal and vertical axis chart style.
Sometimes the data is in multiple groups. How to make a two-coordinate chart?


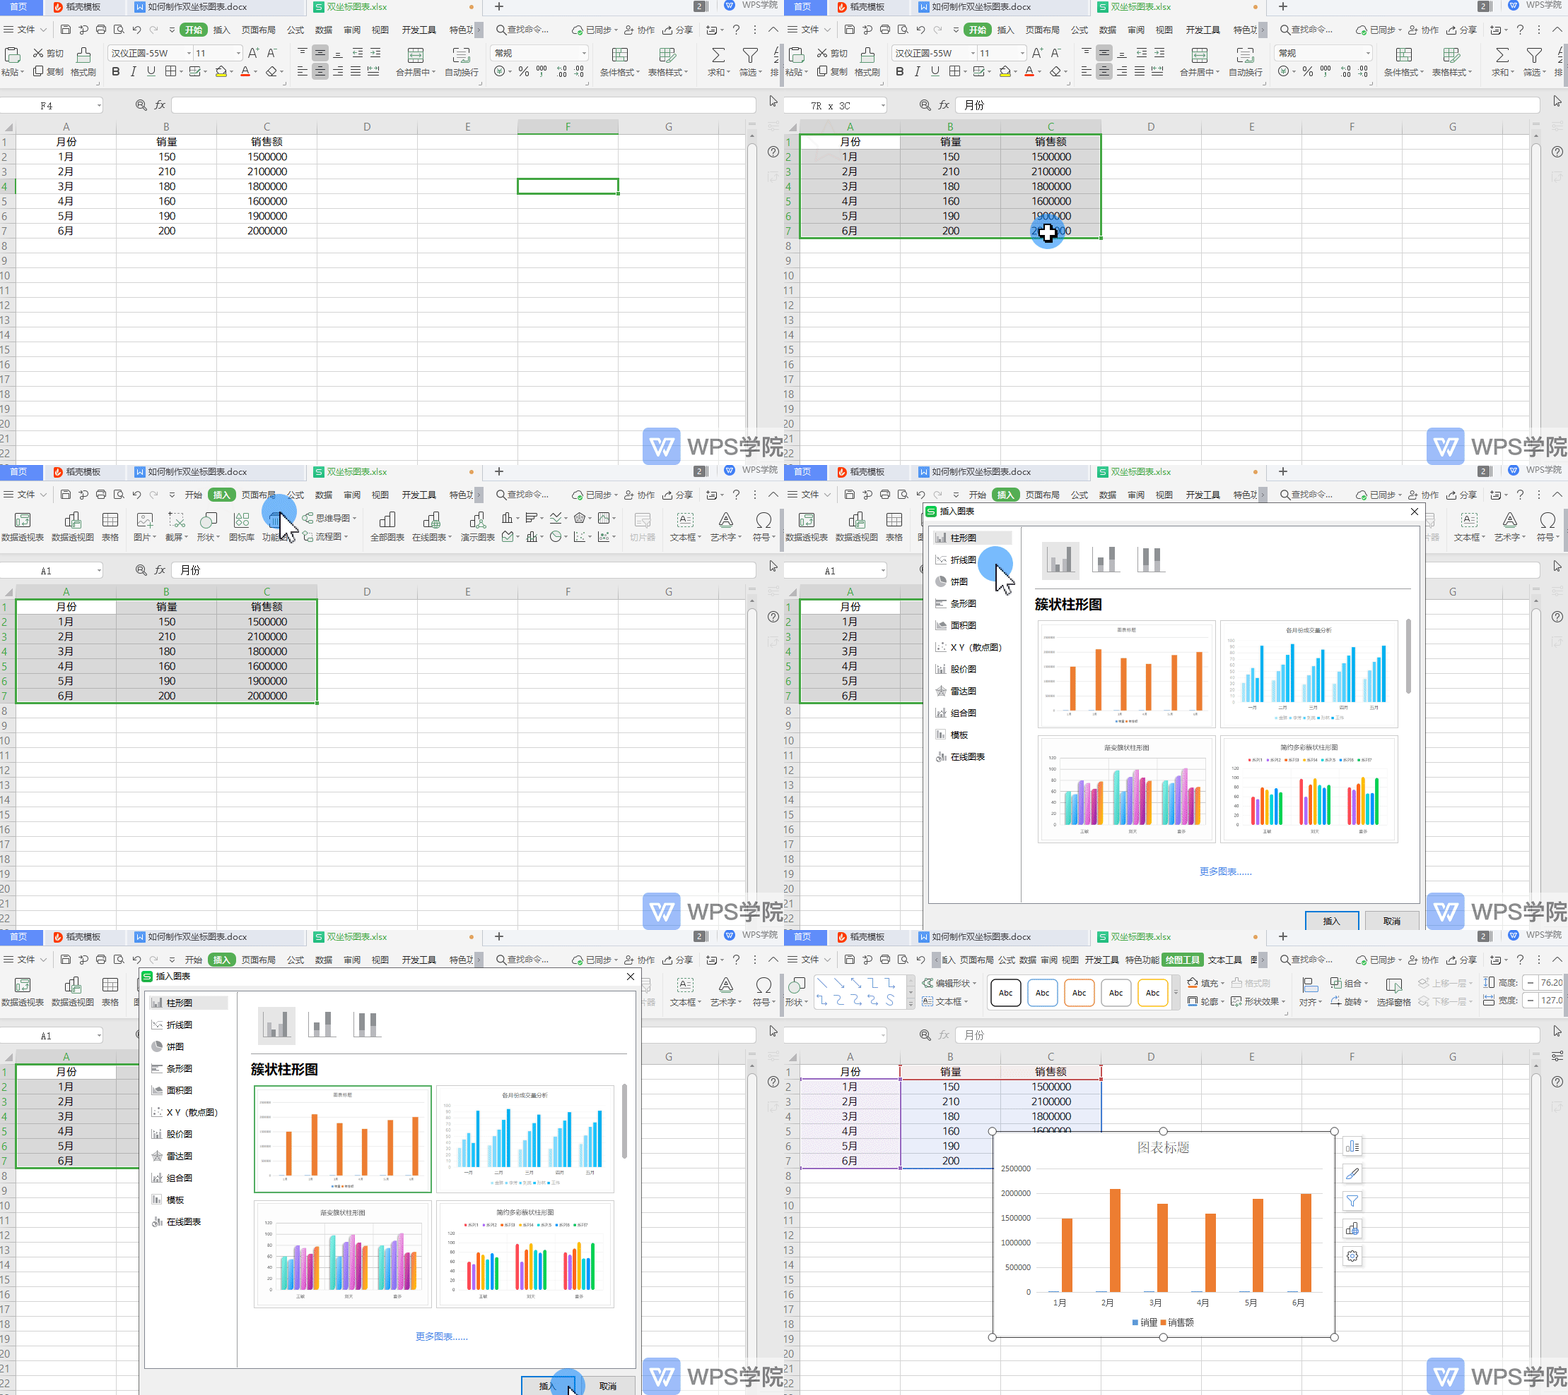
▪Taking this data table as an example, first we insert a column chart of this data.
Select the data content, click Insert - All Charts - Clustered Column Chart in the menu bar above.
Click the chart style to insert it into the table.

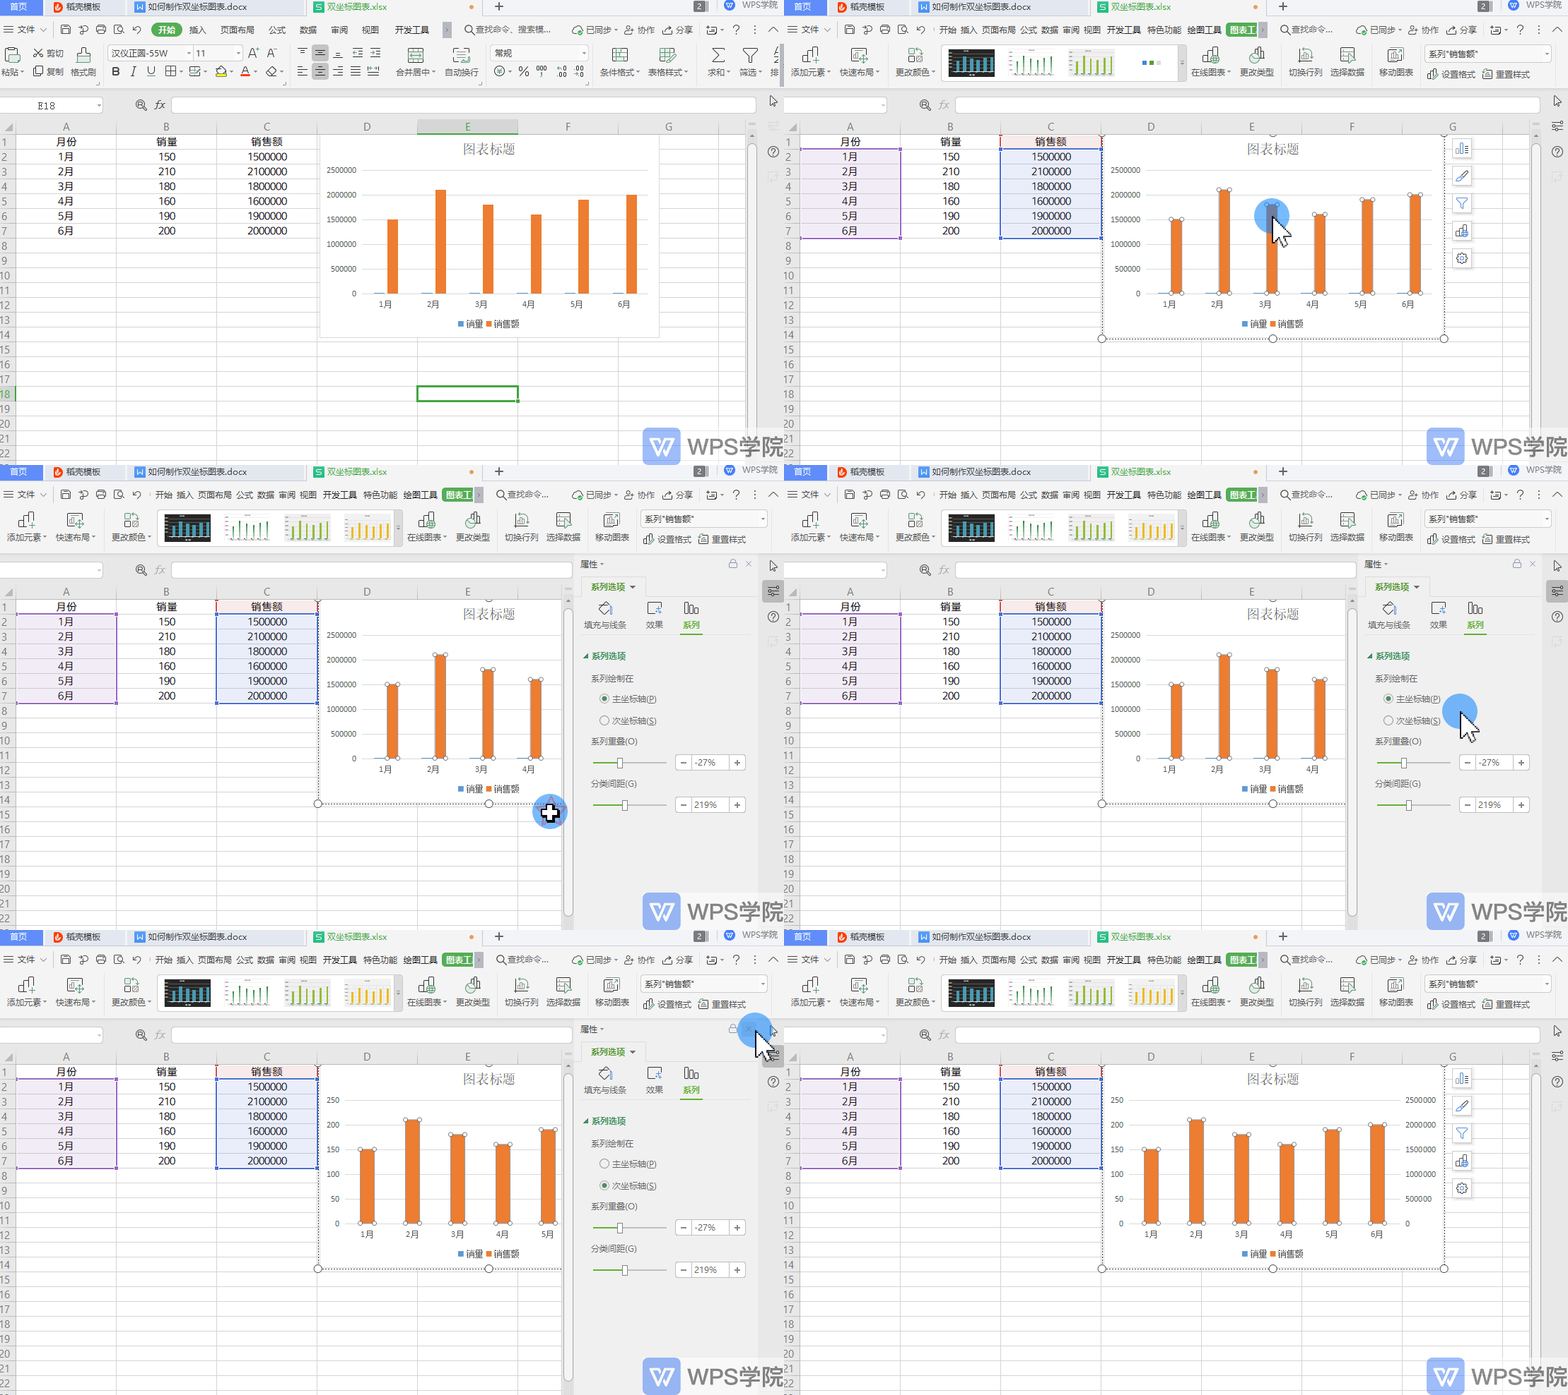
▪There are three sets of data in the data table, so how to set it to dual coordinate axes?
Select the column chart and right-click "Format Data Series".
Select the Series-Series option in the property bar on the right and set it to "Series is drawn on the secondary axis".

Articles are uploaded by users and are for non-commercial browsing only. Posted by: Lomu, please indicate the source: https://www.daogebangong.com/en/articles/detail/ru-he-zhi-zuo-shuang-zuo-biao-tu-biao.html

 支付宝扫一扫
评论列表(196条)
测试