- Picture and text skills
When we use WPS tables to make data reports, we sometimes need to draw stock price charts to show the fluctuation trend of stock prices.
How to draw a stock price chart?
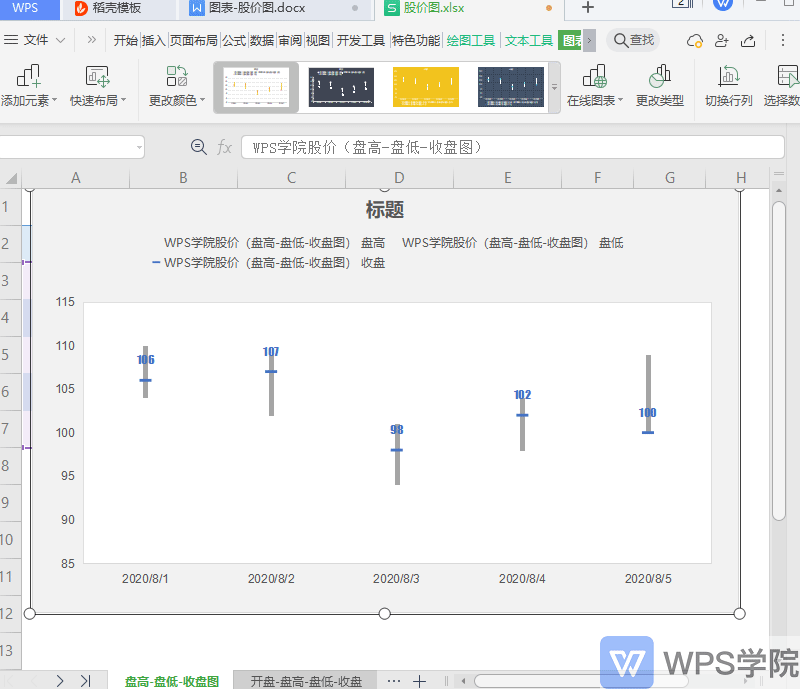

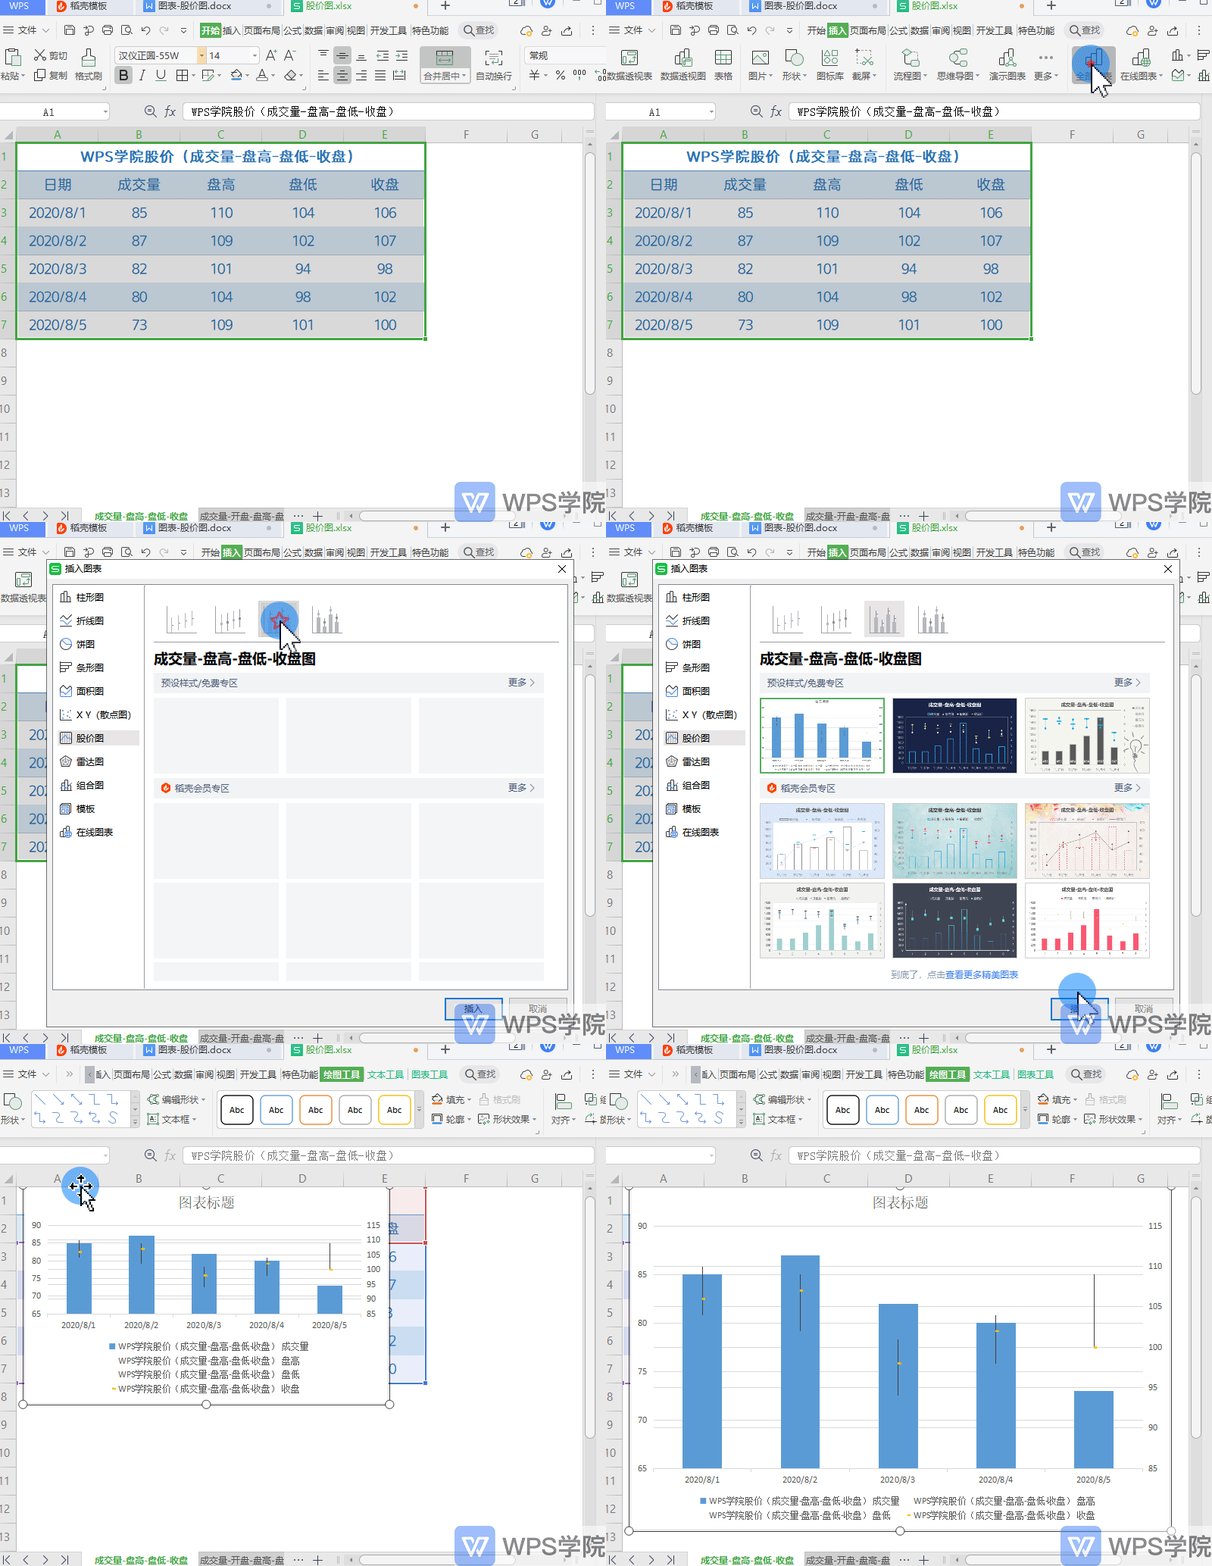
▪Taking this table as an example, if we want to draw a "high-low-closing chart" stock price chart.
First we need to create a stock price table with these three series.
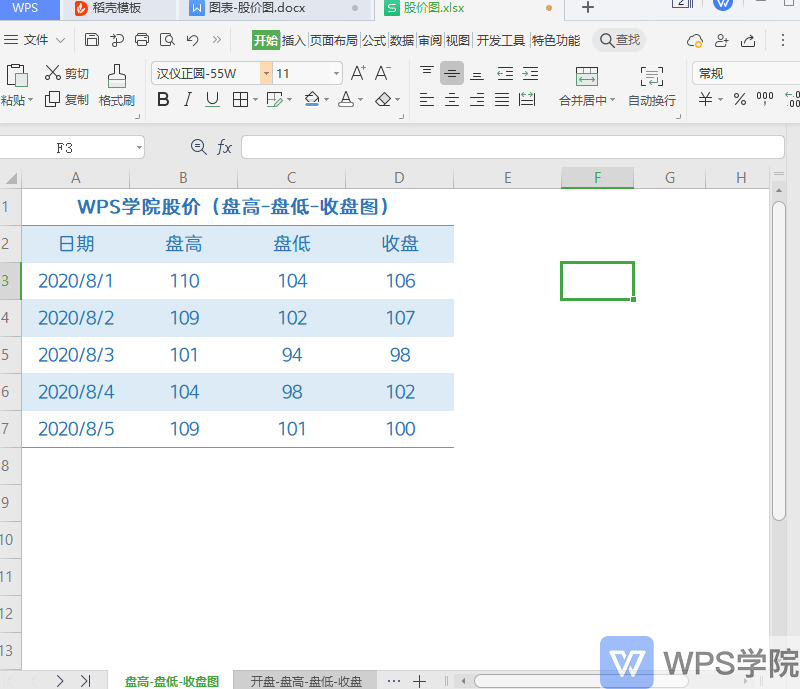
▪Select the table area and click Insert - Insert stock price chart on the menu bar above.
You can also click Insert-All Charts-Stock Price Chart and select the High-High-Low-Closing Chart stock price chart.
Based on this stock price chart, we can more clearly understand the relationship between the highest price, the lowest price and yesterday's closing price.
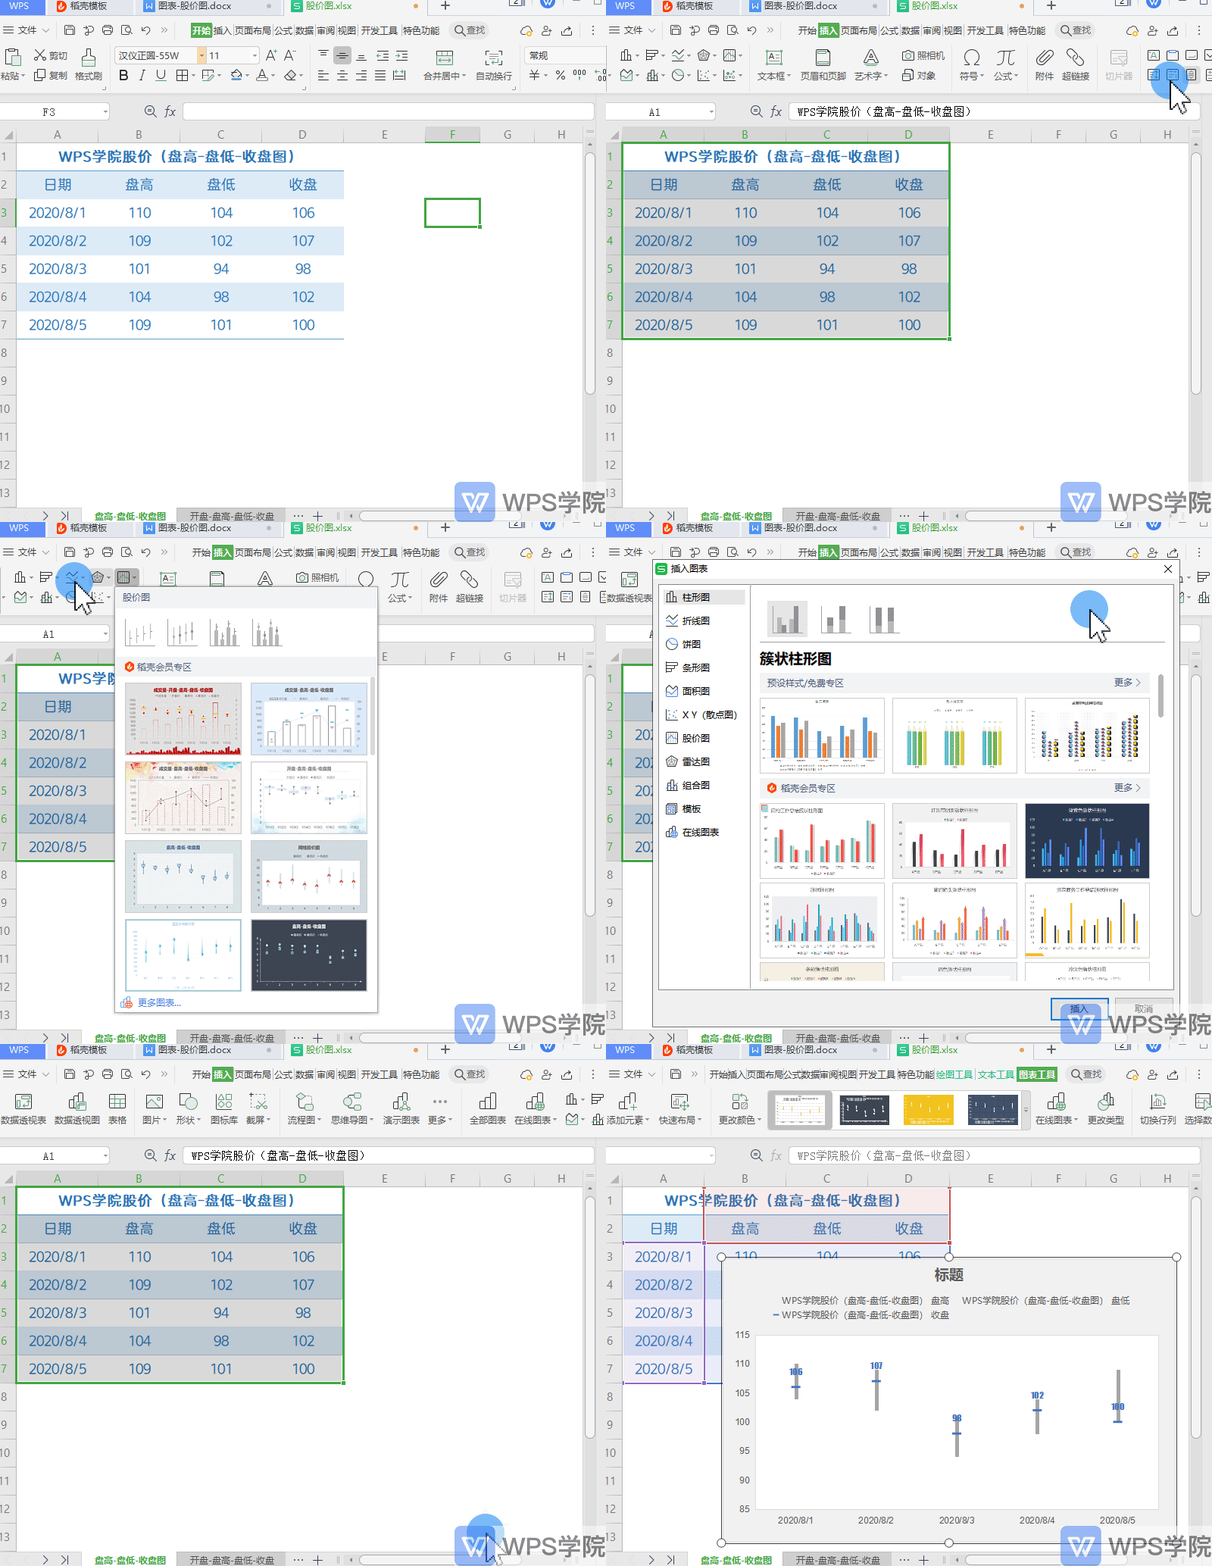
▪In addition, we can also create an "opening-high-low-closing" stock price chart;
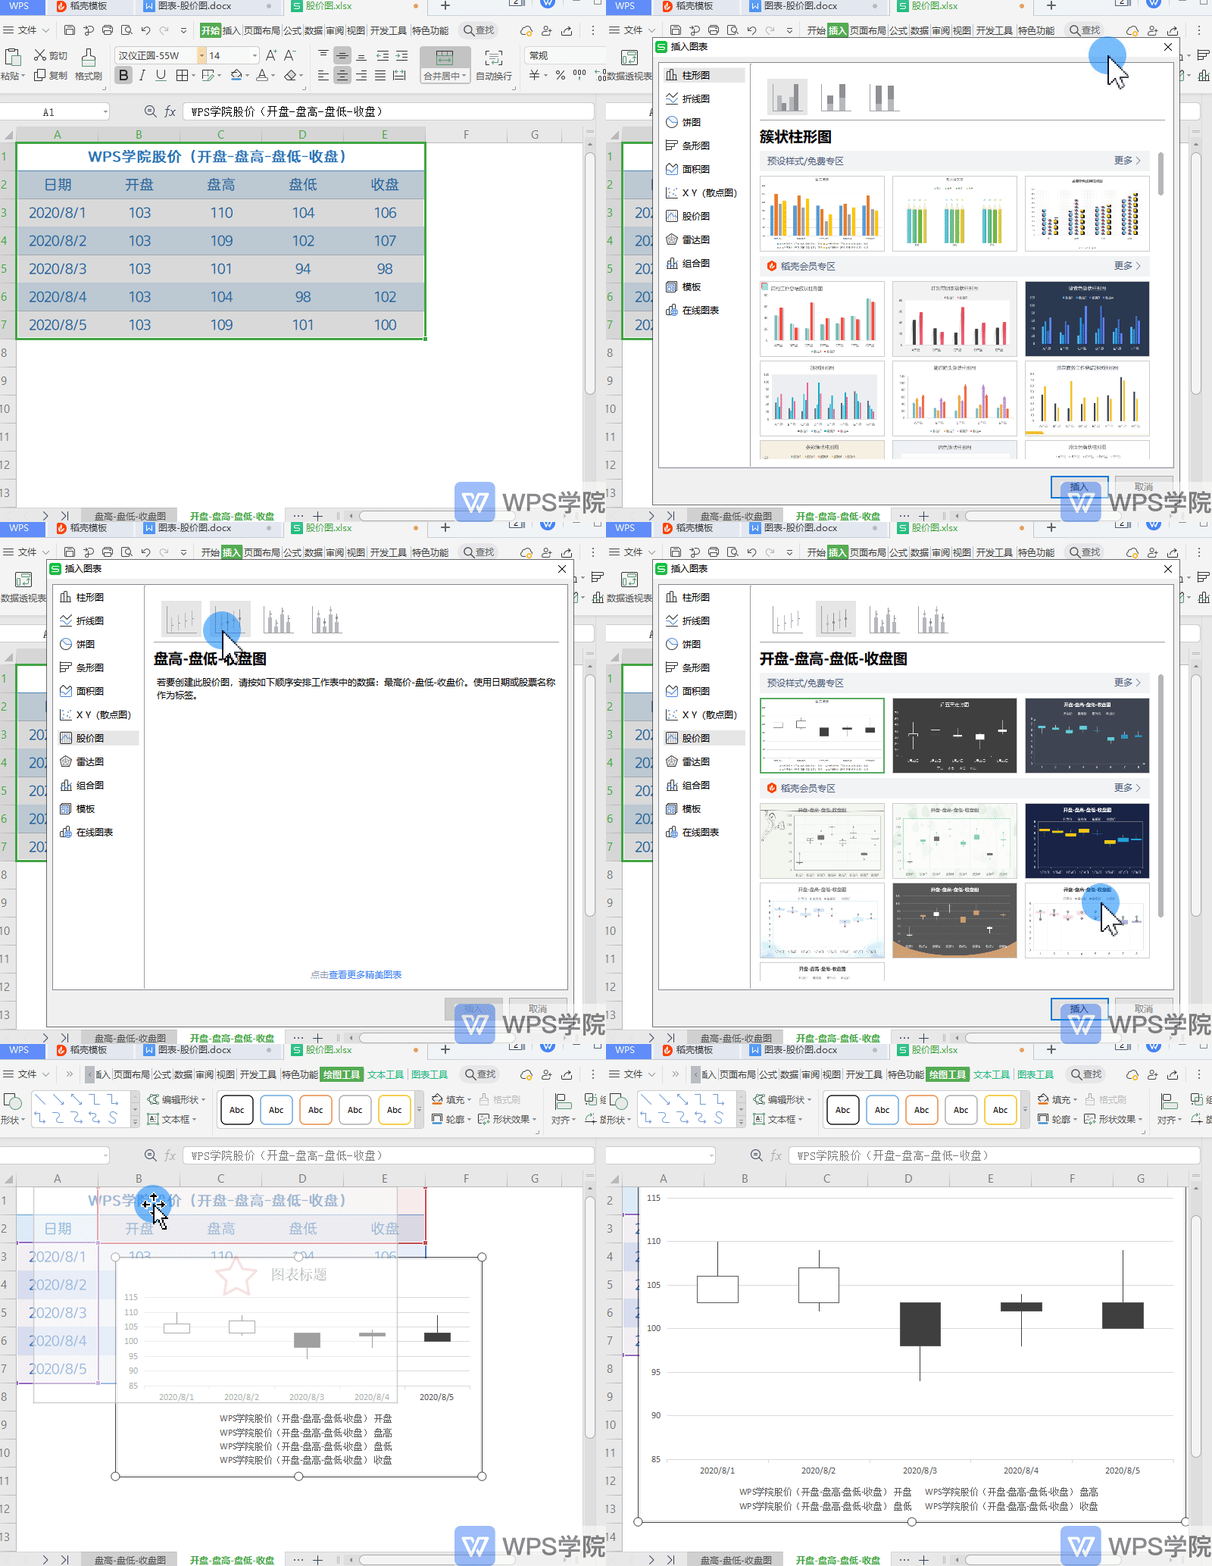
"Trading volume-high-low-closing" stock price chart;
"Trading volume-opening-high-low-closing" stock price chart.
Articles are uploaded by users and are for non-commercial browsing only. Posted by: Lomu, please indicate the source: https://www.daogebangong.com/en/articles/detail/ru-he-zhi-zuo-gu-jia-tu.html

 支付宝扫一扫
评论列表(196条)
测试