- Picture and text skills
When visualizing data, the data is usually converted into a visual form for reporting.
Scatter plot can visually observe the distribution of data points on the coordinate system plane, which can help us discover the relationship between variables and analyze and predict object behavior. A scatter plot is the best chart type if your data set contains a very large number of points.

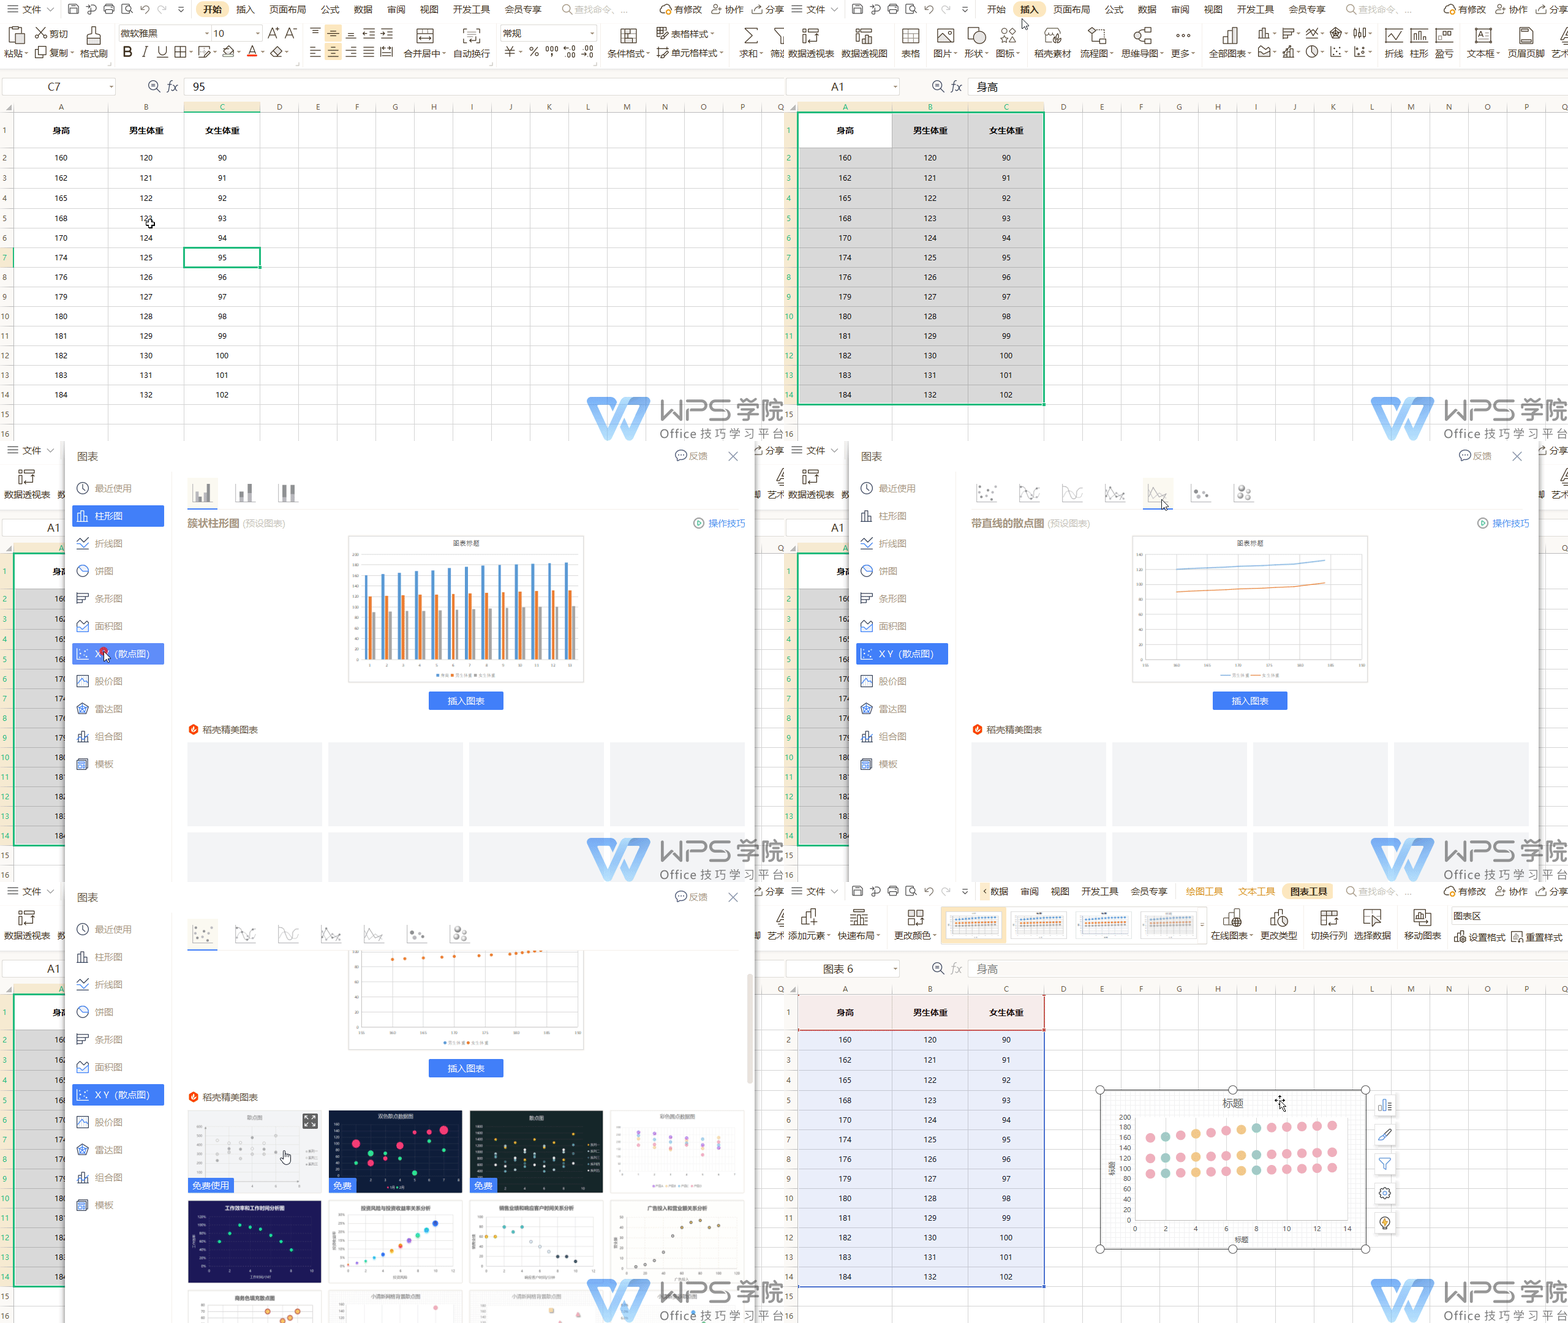
▪So how to draw a scatter plot? Take this data table as an example, if we want to draw a scatter plot of the height and weight of men and women. First select the data area, select "Scatter Chart" from "Insert" - "All Charts" in the upper menu bar, or click the scatter chart icon in the insert menu bar.
In the edit box, you can see different forms of scatter plots, such as scatter plots, scatter plots with straight lines, and scatter plots with straight lines and data markers. Above the edit box, you can see the thumbnail of the scatter plot of the selected data. WPS Rice Shell has thoughtfully prepared multiple styles of scatter plots for us to choose from.
Select a scatter plot of appropriate style and add it

▪How to use the function on the right side of the chart, How about making the chart more beautiful?
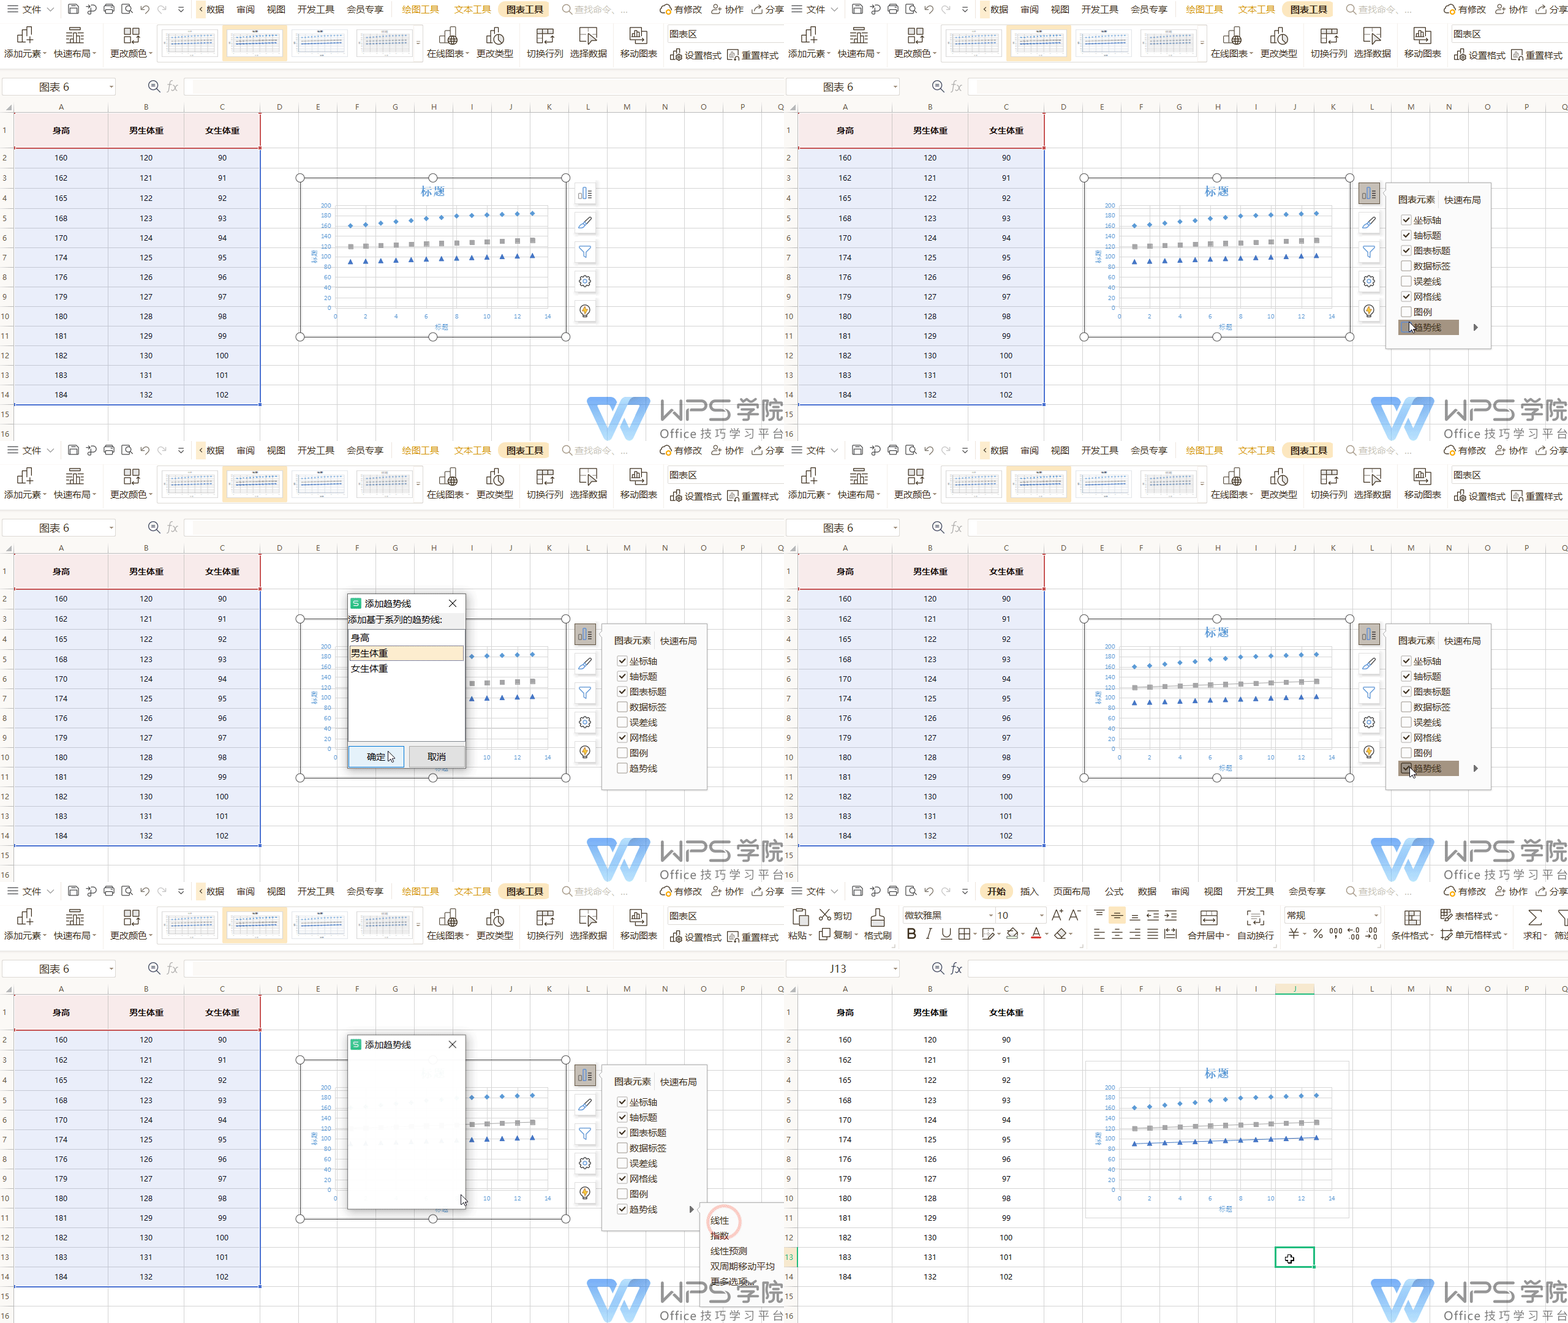
Click "Chart Elements" on the right side of the chart. You can check the information to be displayed according to your needs, check "Trend Line", select boys' height and girls' height, and click OK Click the button to see the height trend lines for boys and girls on the chart.

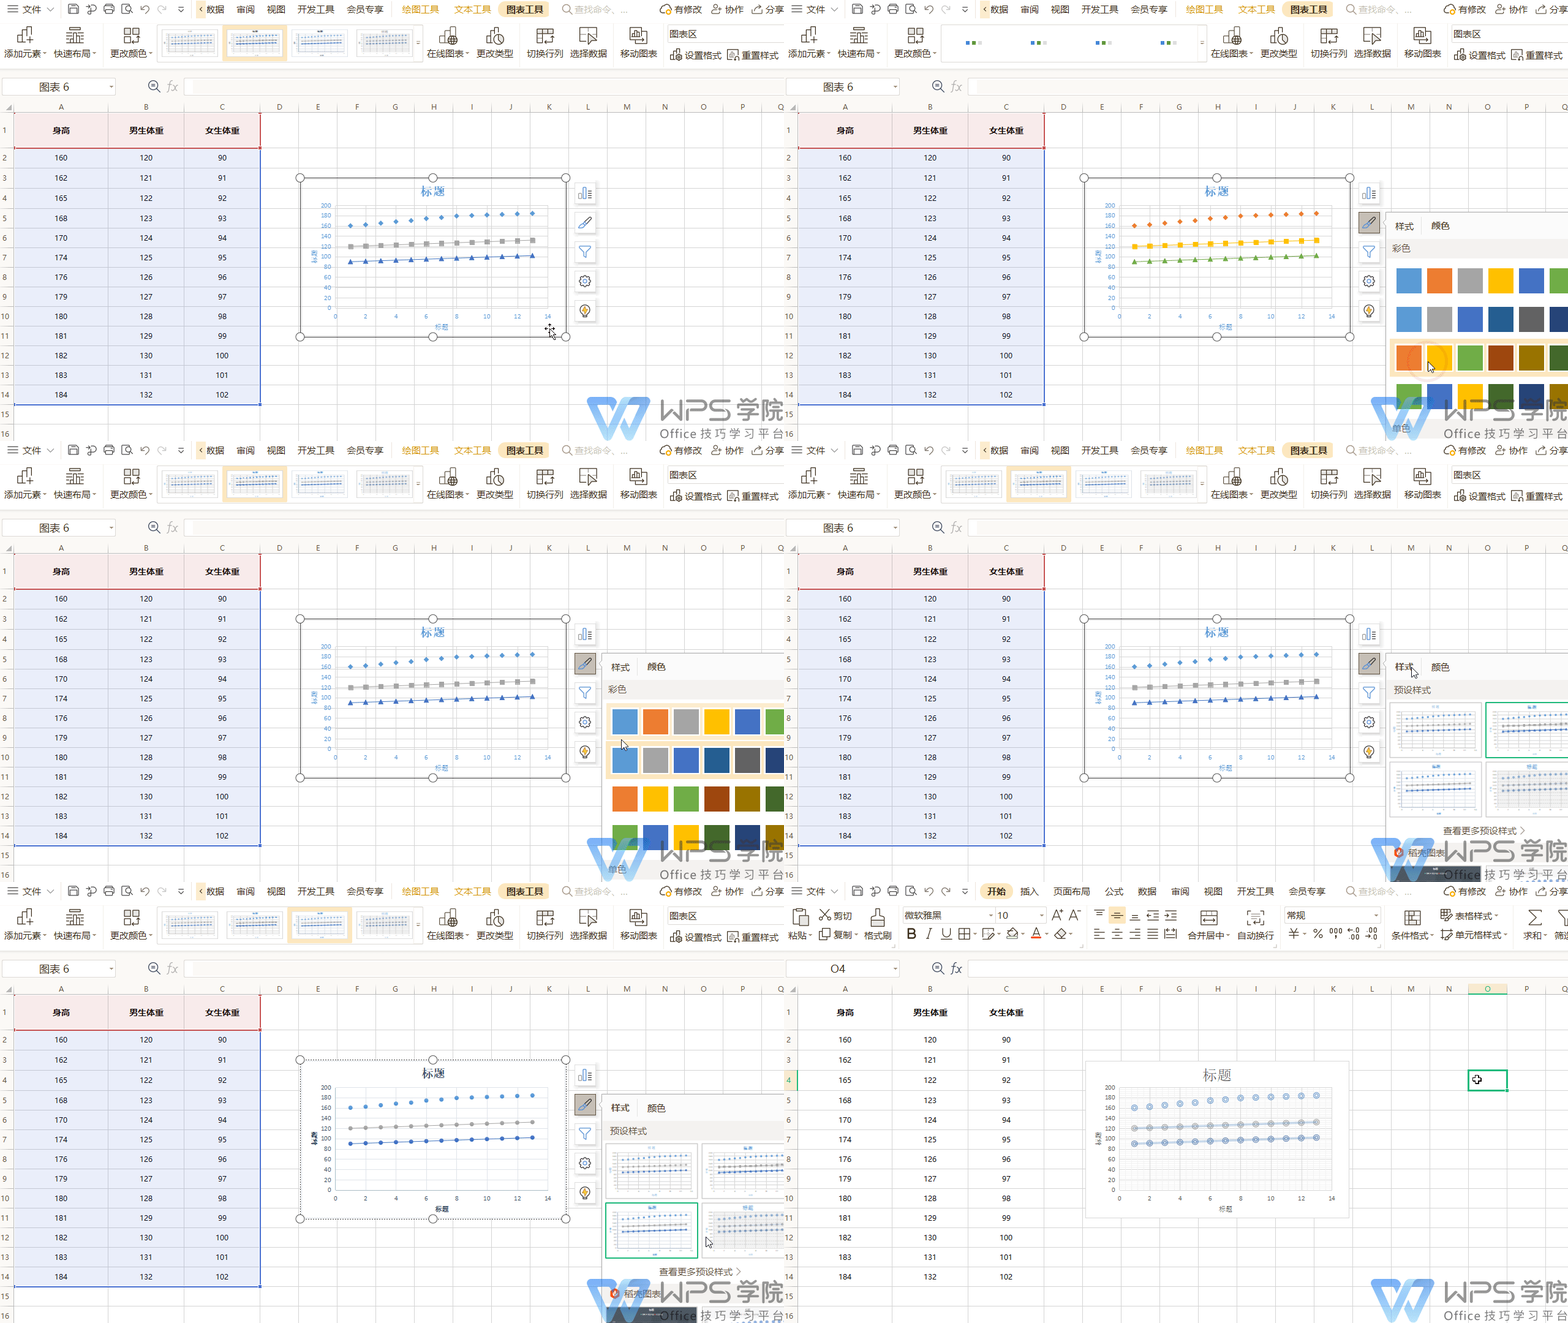
▪Click "Chart Style" on the right side of the chart. In the default style, click " View more preset styles button to change the style of coordinates in the chart.

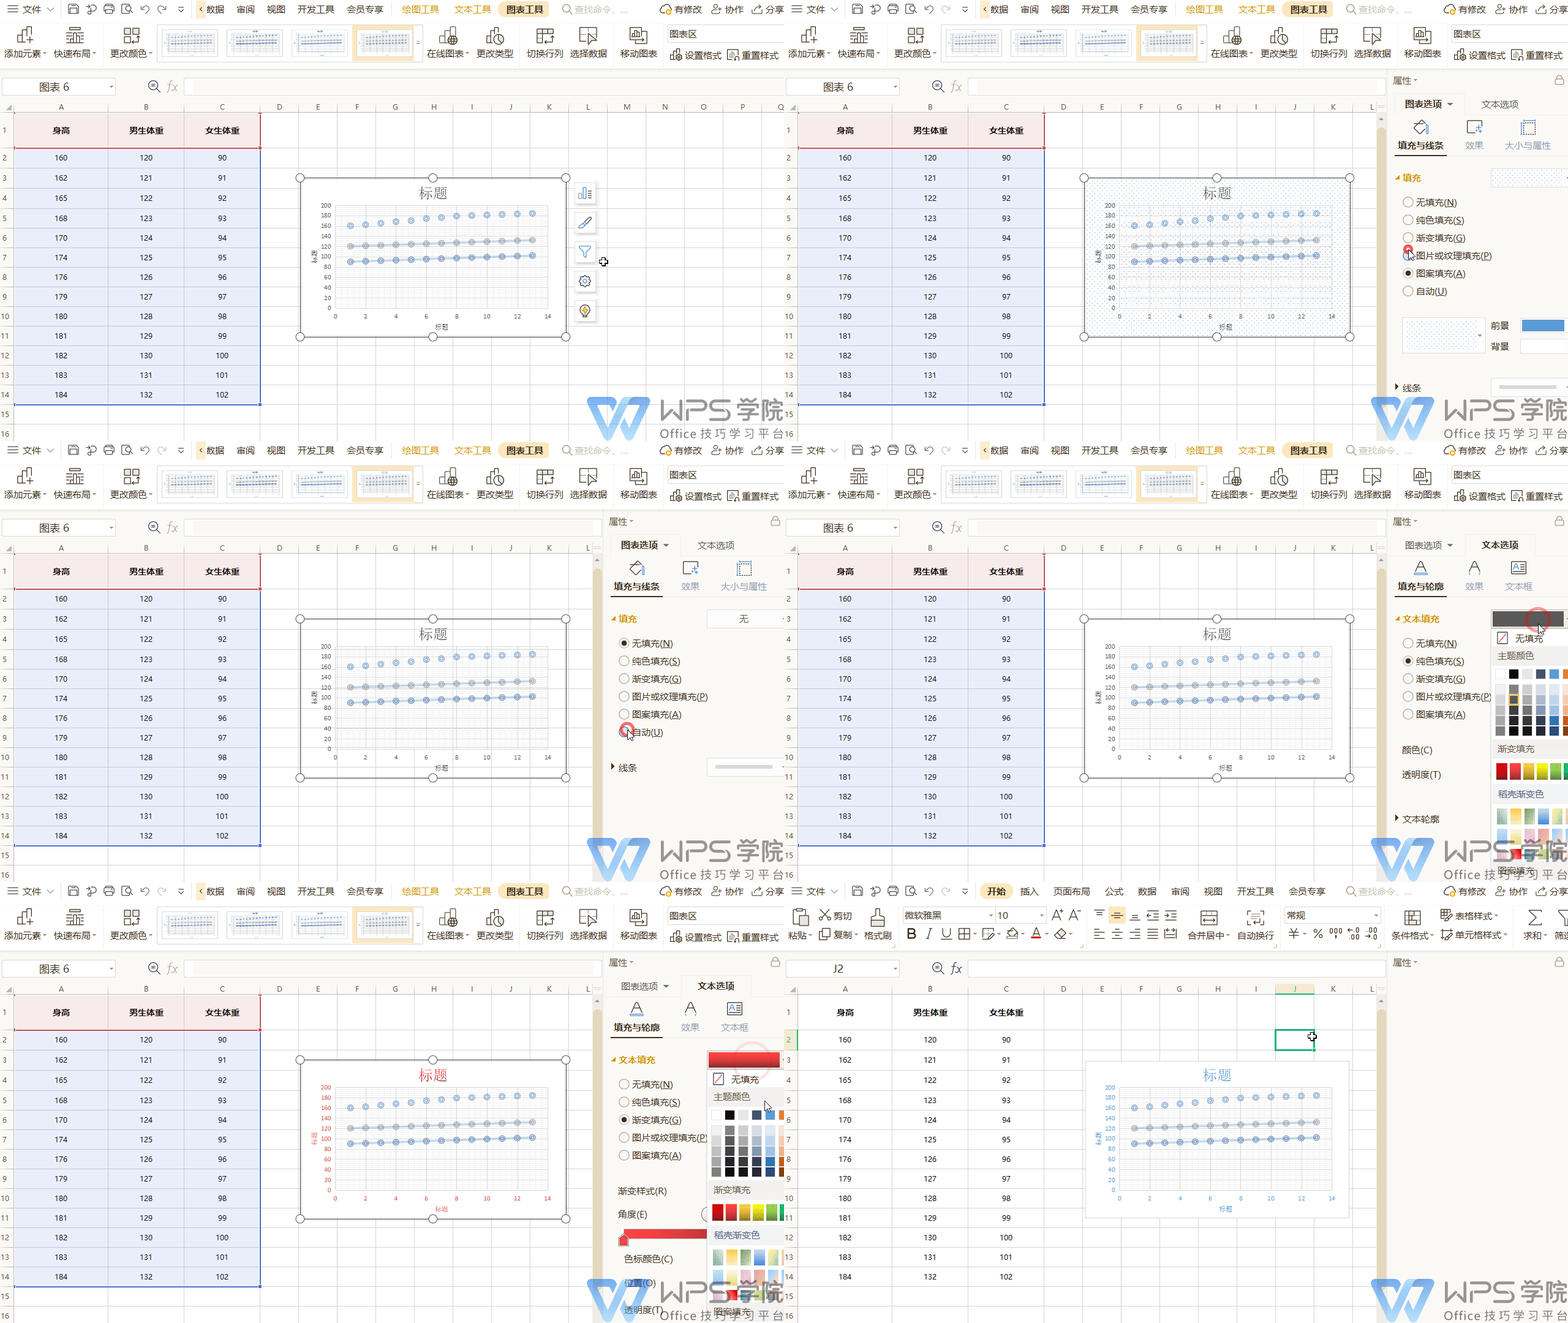
▪Click "Format Icon Area" on the right side of the chart in the property bar on the right. Multiple fill styles to choose from, and chart backgrounds can be customized. The effect can set the chart shadow transparency, etc.; the text box can change the text of the chart.

Articles are uploaded by users and are for non-commercial browsing only. Posted by: Lomu, please indicate the source: https://www.daogebangong.com/en/articles/detail/ru-he-hui-zhi-san-dian-tu.html

 支付宝扫一扫
评论列表(196条)
测试