- Picture and text skills
Bar chart is one of the common chart styles in tables, which can visually compare data differences.
How to draw a table bar chart?

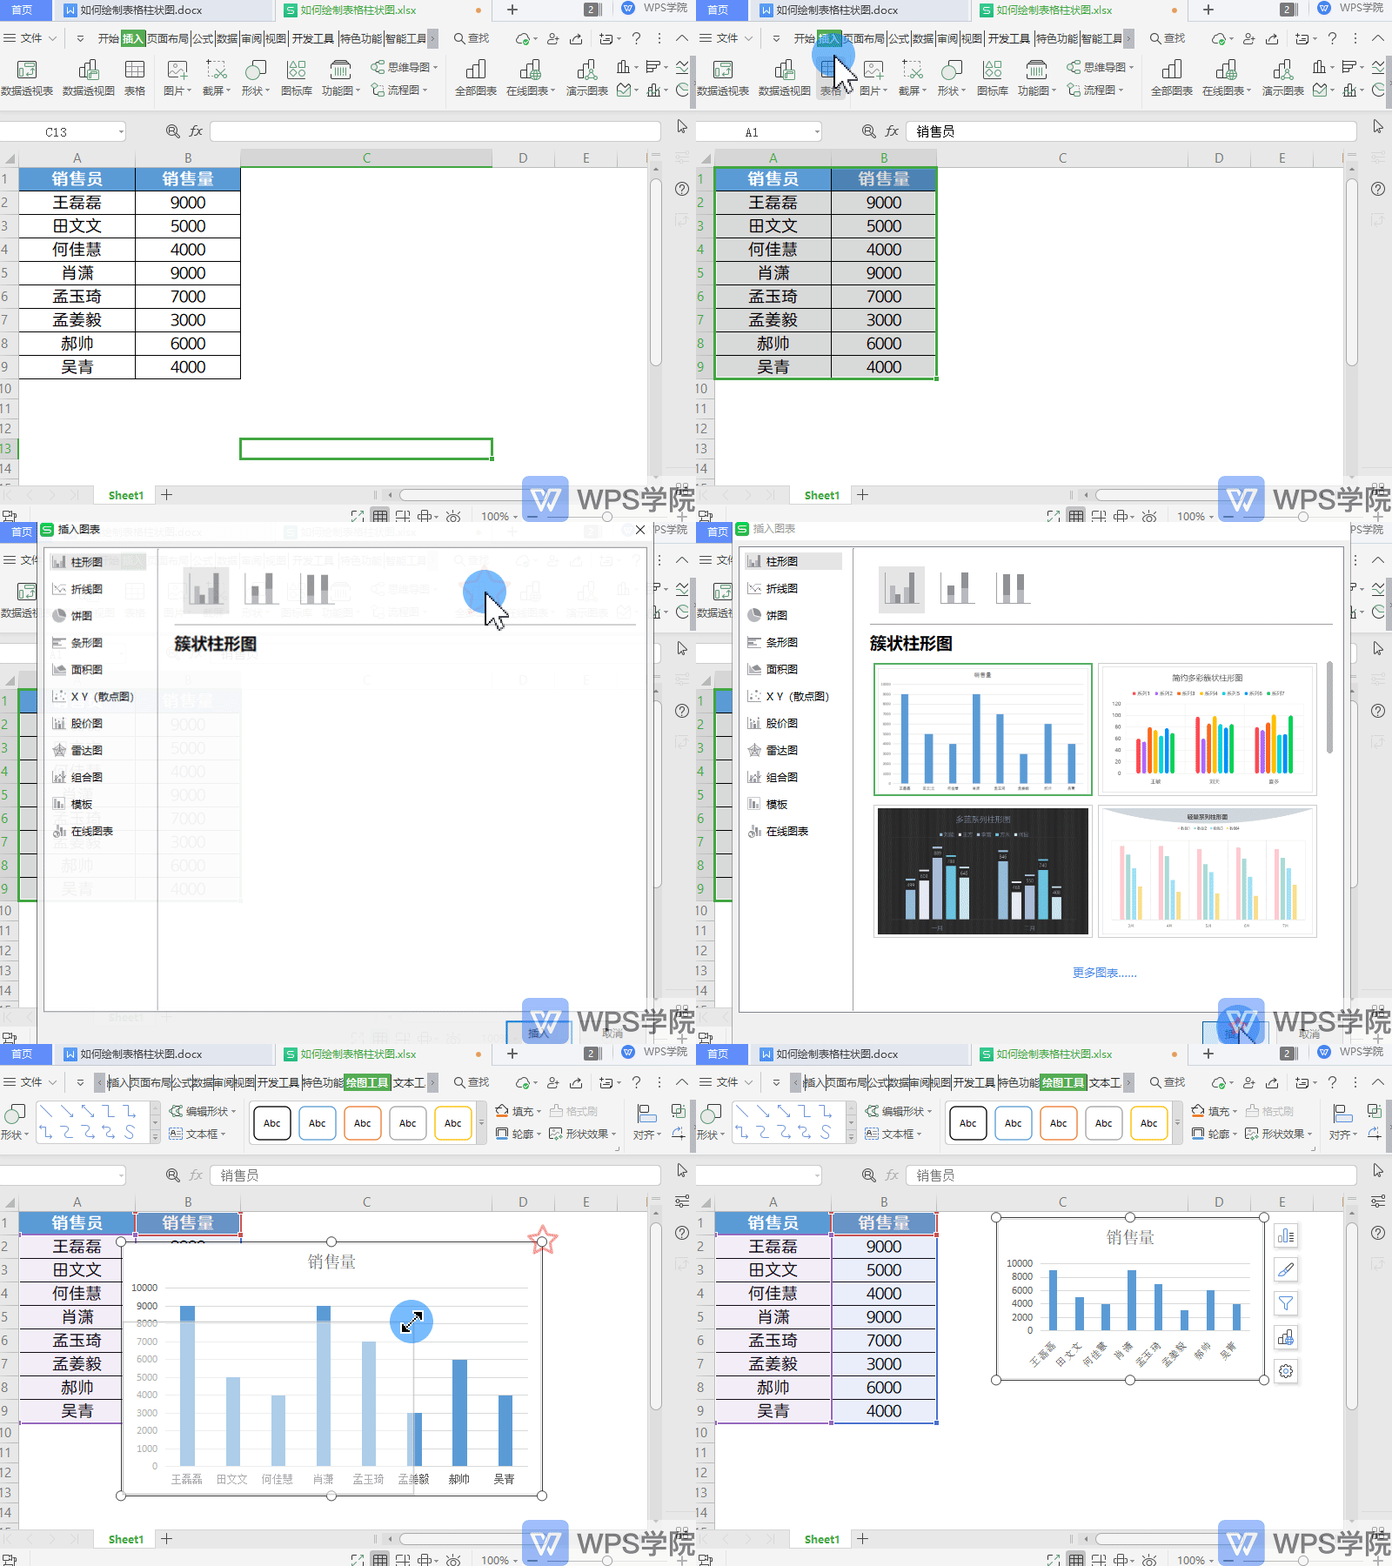
▪Take this table as an example and want to draw the data of this table histogram.
Select the table data cell and click Insert in the upper menu bar-All charts-Bar chart.
Select the bar chart style and click Insert.

▪How to insert the data standard line in the histogram?
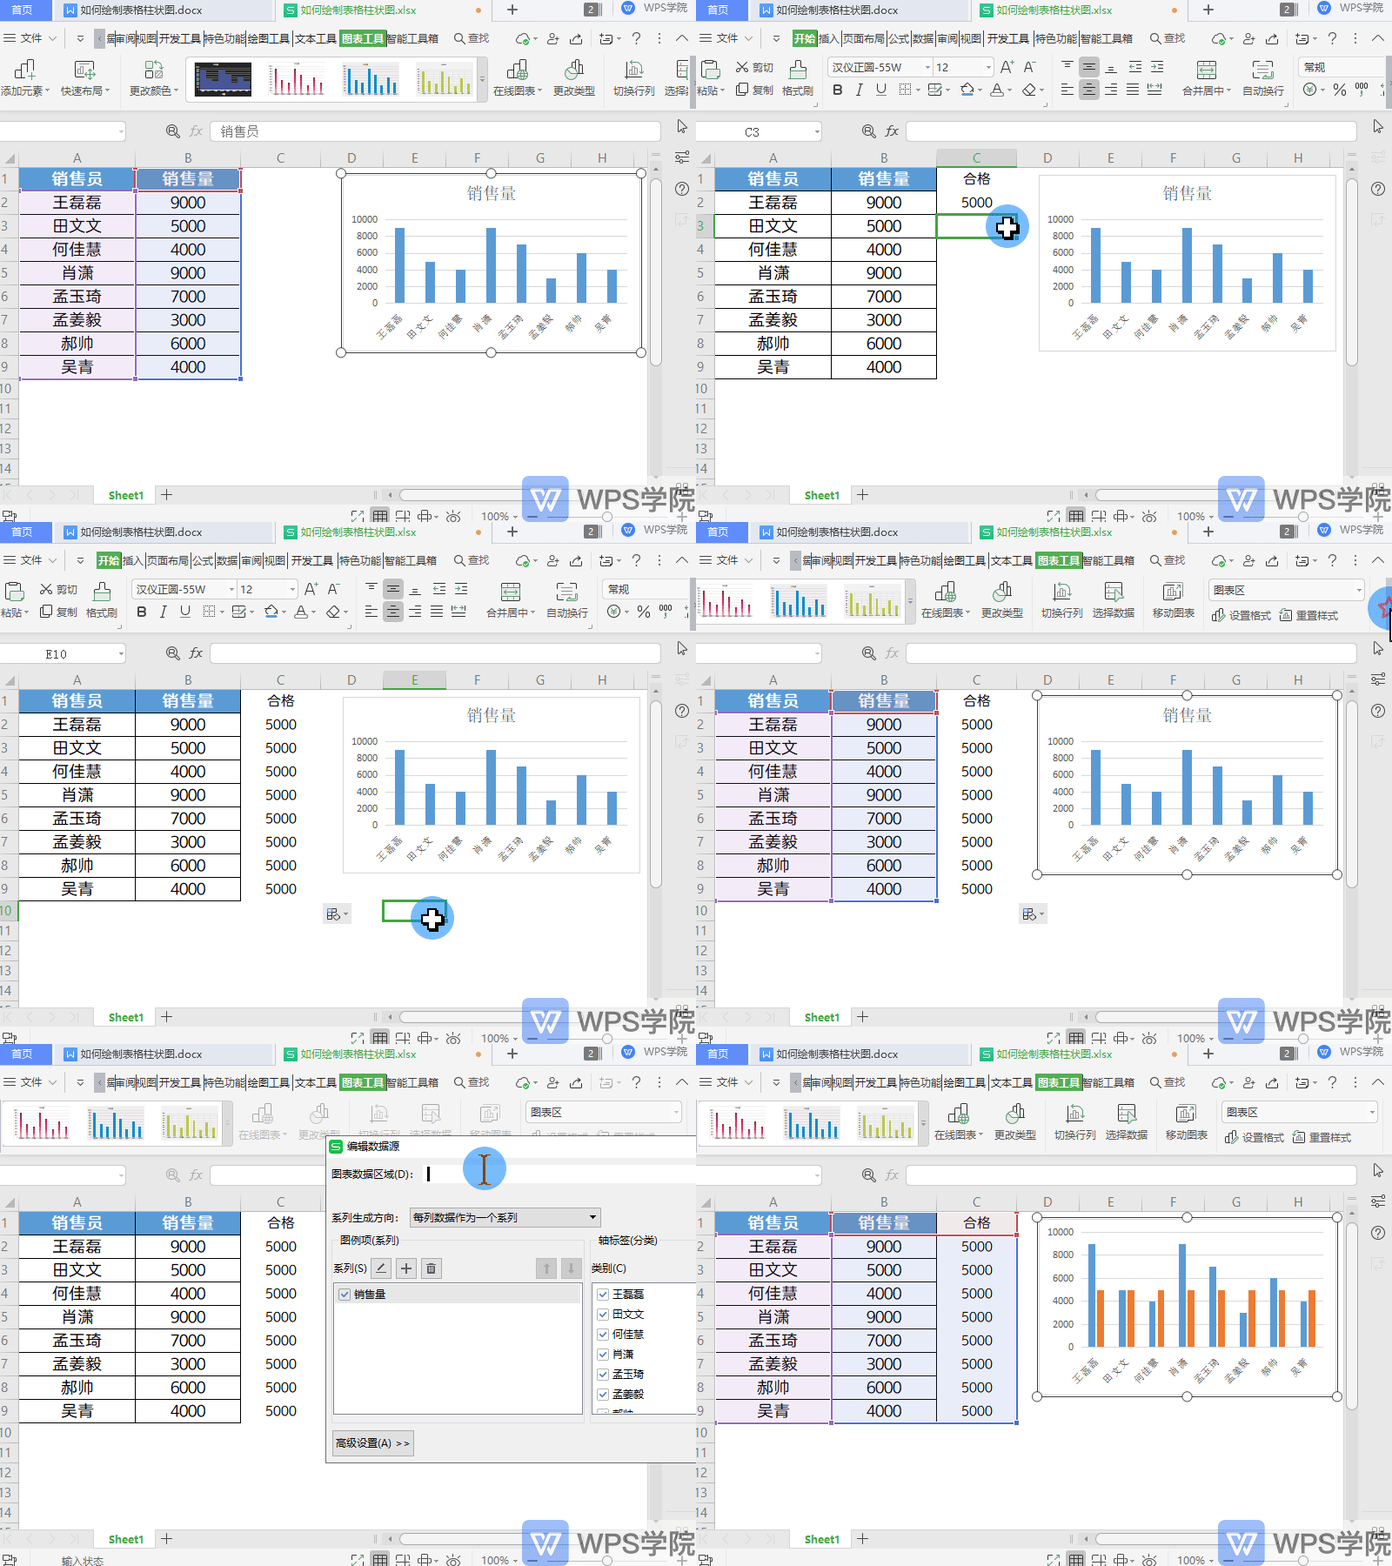
First, add the standard line data to the table data. Then click Chart Tools- to select data.
In the Edit Data Source dialog box, modify the data area of the chart and click OK.
In this way, the qualified data will appear in the chart.

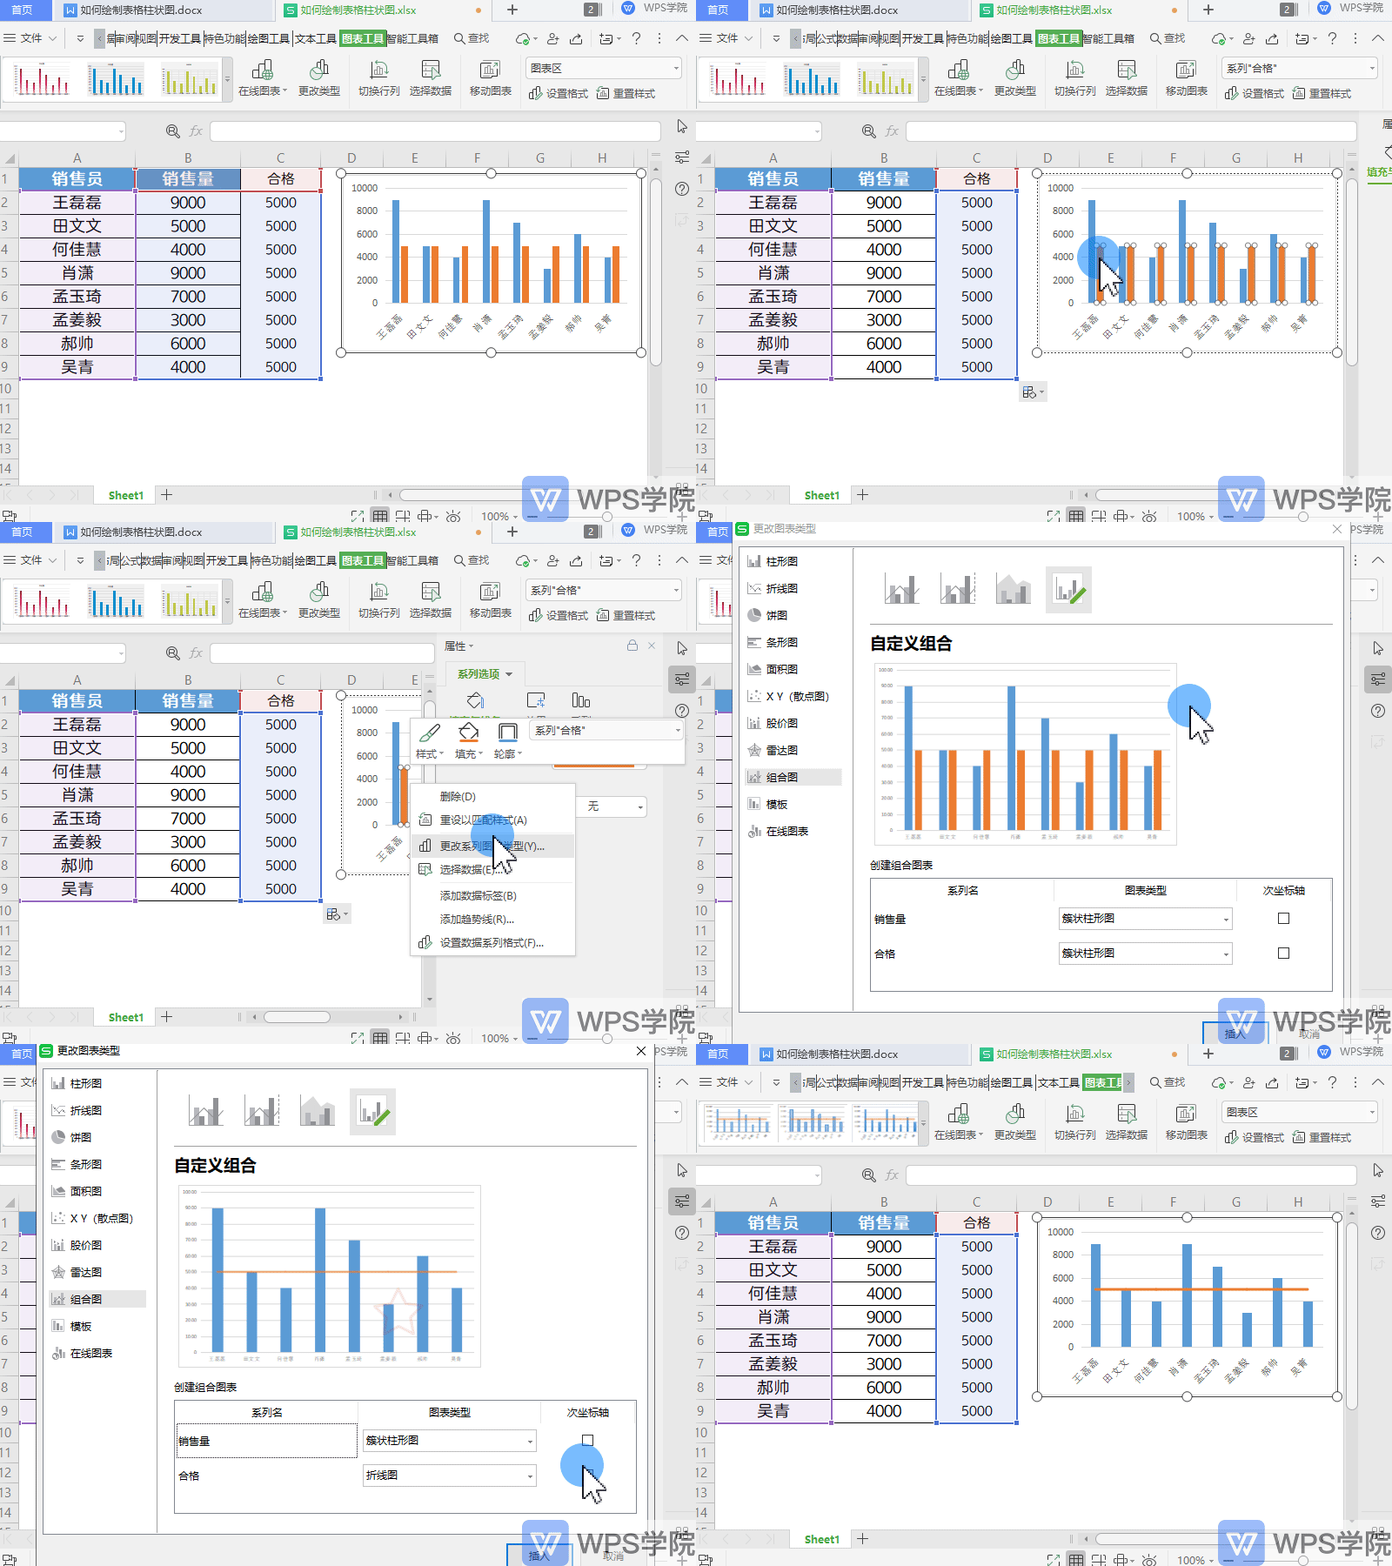
▪Click on the target in the chart Data, right-click and select "Change Series Chart Type".
In the Change Chart Type window, set to Combination Chart.
Set the chart type of series name "qualified" to "line chart".
Click to insert.

Articles are uploaded by users and are for non-commercial browsing only. Posted by: Lomu, please indicate the source: https://www.daogebangong.com/en/articles/detail/ru-he-hui-zhi-biao-ge-zhu-xing-tu.html

 支付宝扫一扫
评论列表(196条)
测试