- Picture and text skills
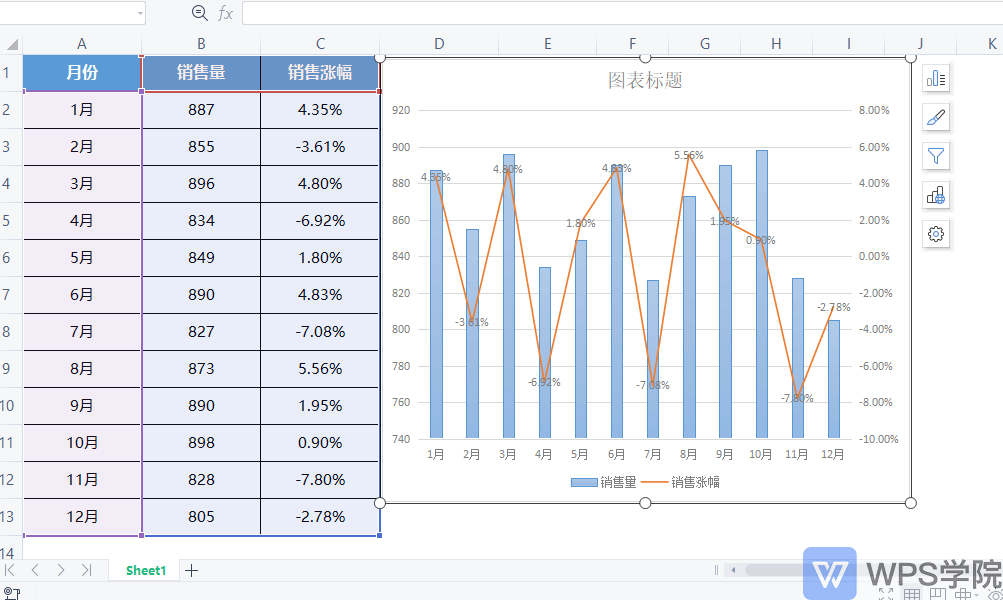
When Sales Wang is preparing an annual summary report, he wants to create a chart of sales volume and sales growth.
The sales volume is a bar chart and the sales growth is a line chart. How to draw it?


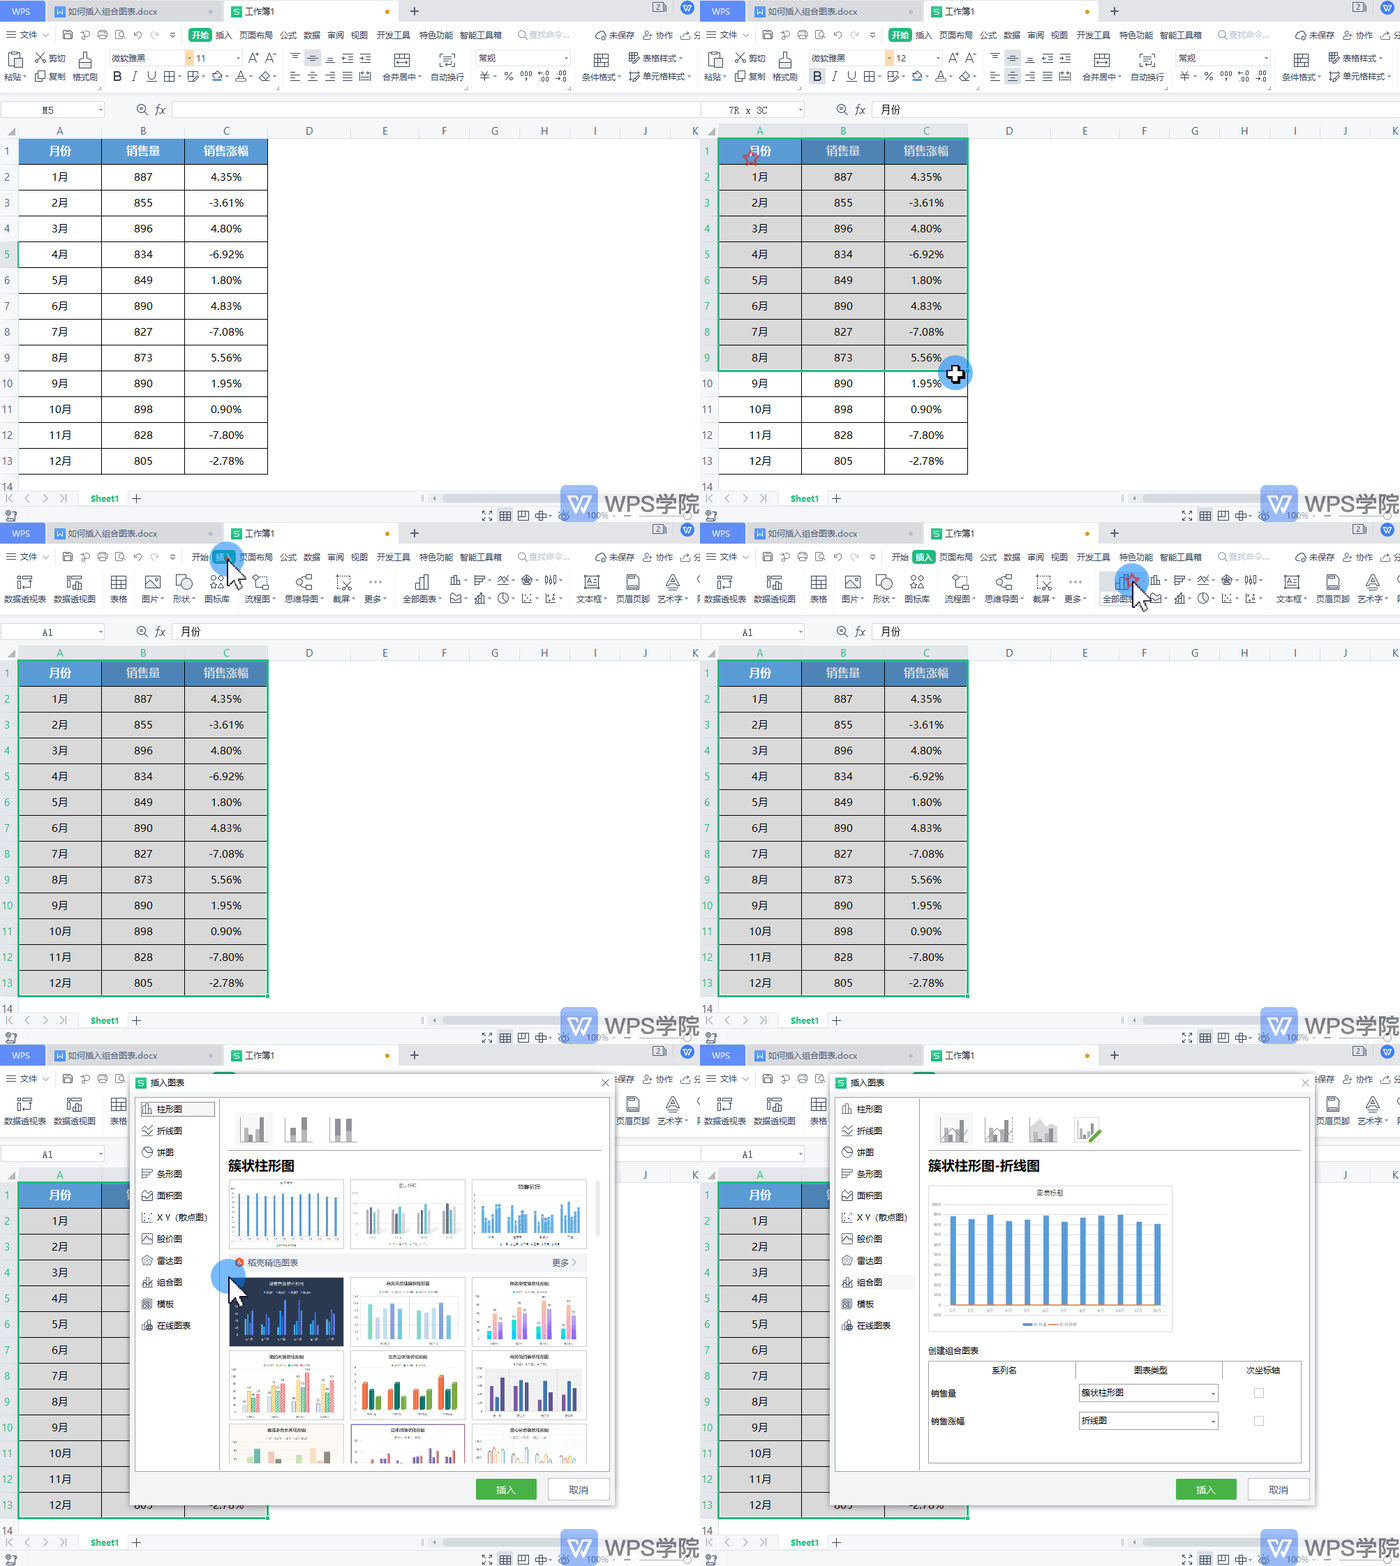
▪Taking this table as an example, select the data area and click Insert - All Charts in the upper menu bar.
The chart type dialog box will pop up, select "Combined Chart".

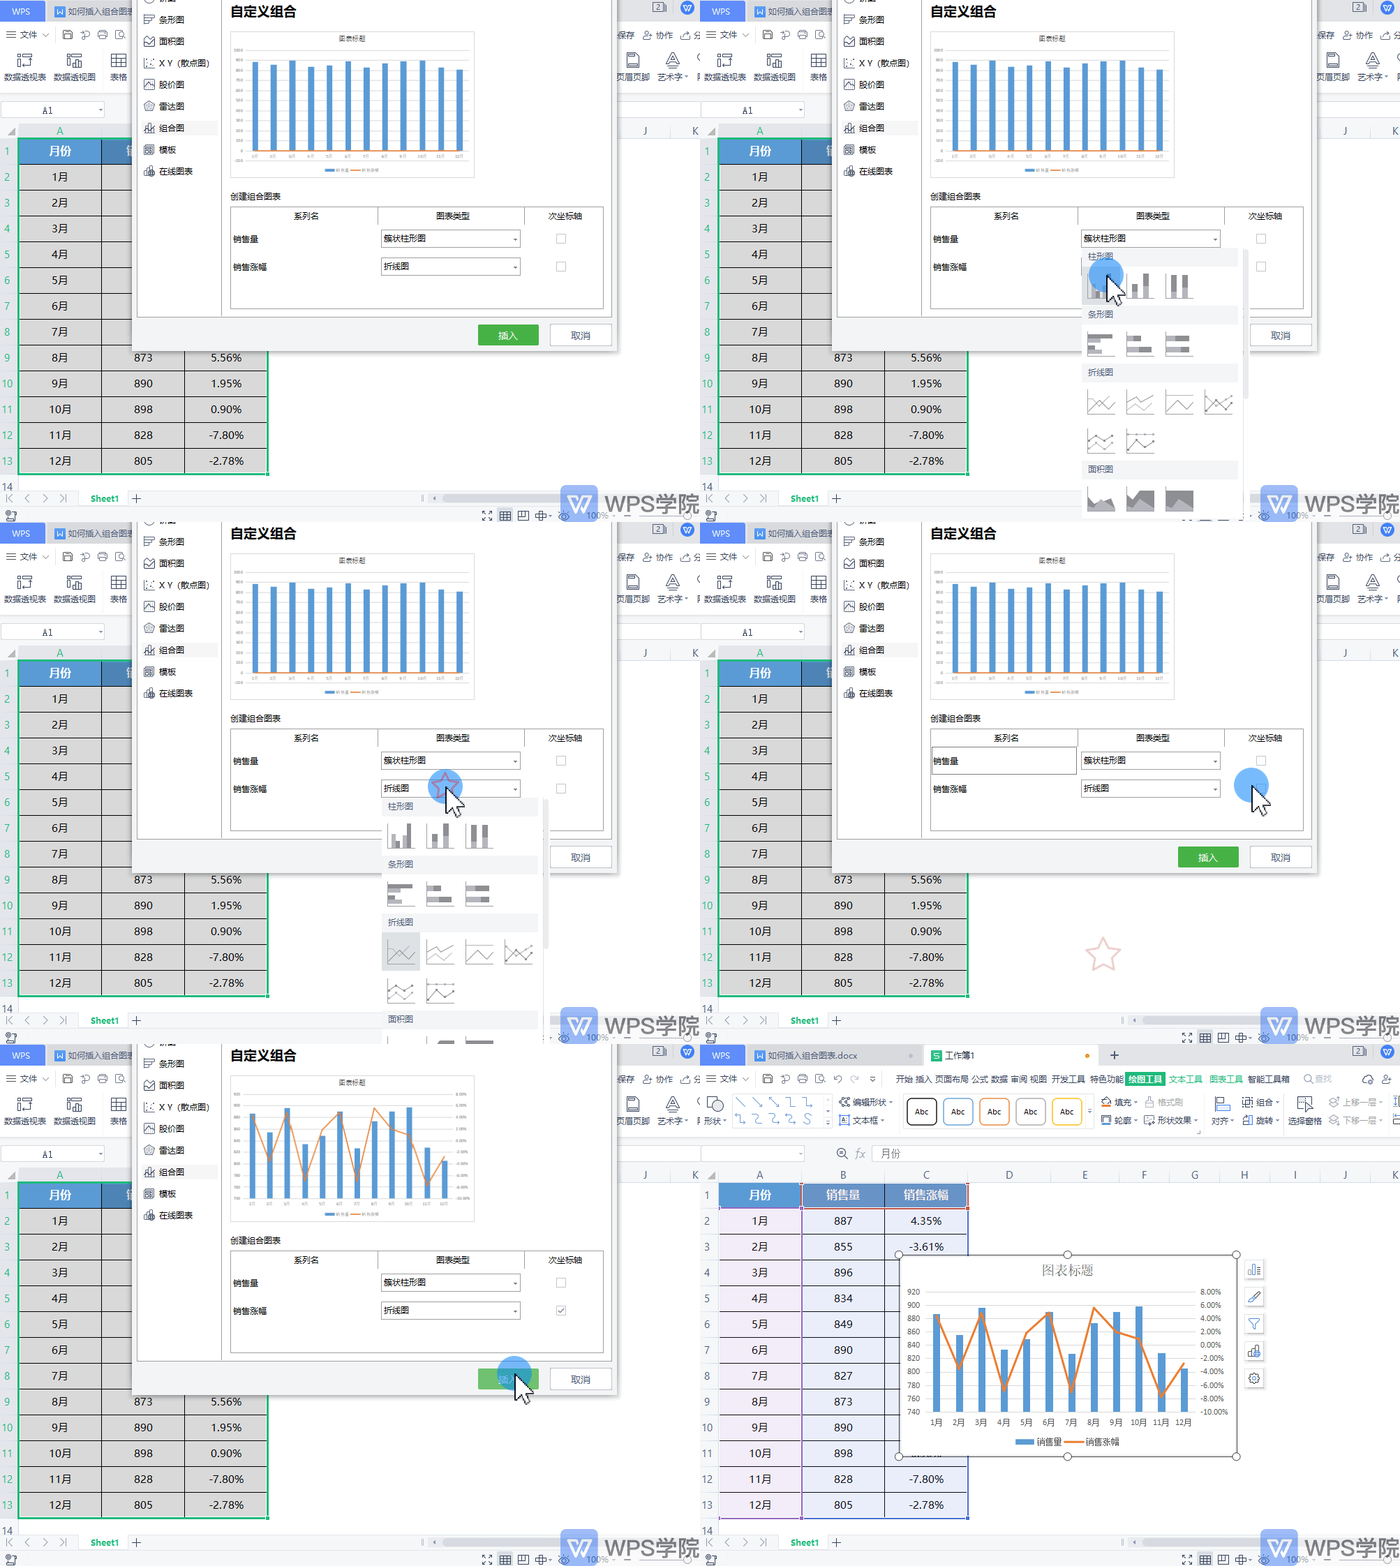
▪We set the chart type of sales volume to clustered column chart, set sales growth to line chart, and check "Secondary axis".
Click OK to insert the combination chart.

Articles are uploaded by users and are for non-commercial browsing only. Posted by: Lomu, please indicate the source: https://www.daogebangong.com/en/articles/detail/ru-he-cha-ru-zu-he-tu-biao.html

 支付宝扫一扫
评论列表(196条)
测试