- Image and text skills
WPS's new "Sparkline" function can create a small chart in a cell to more clearly discover the changing trends of the data.
If you encounter that the "Mini Chart" is grayed out, it may be because the version is too low or the current table is in XLS format. You can save the table as XLSX format and re- Open the table and use the "Mini Chart" related functions.

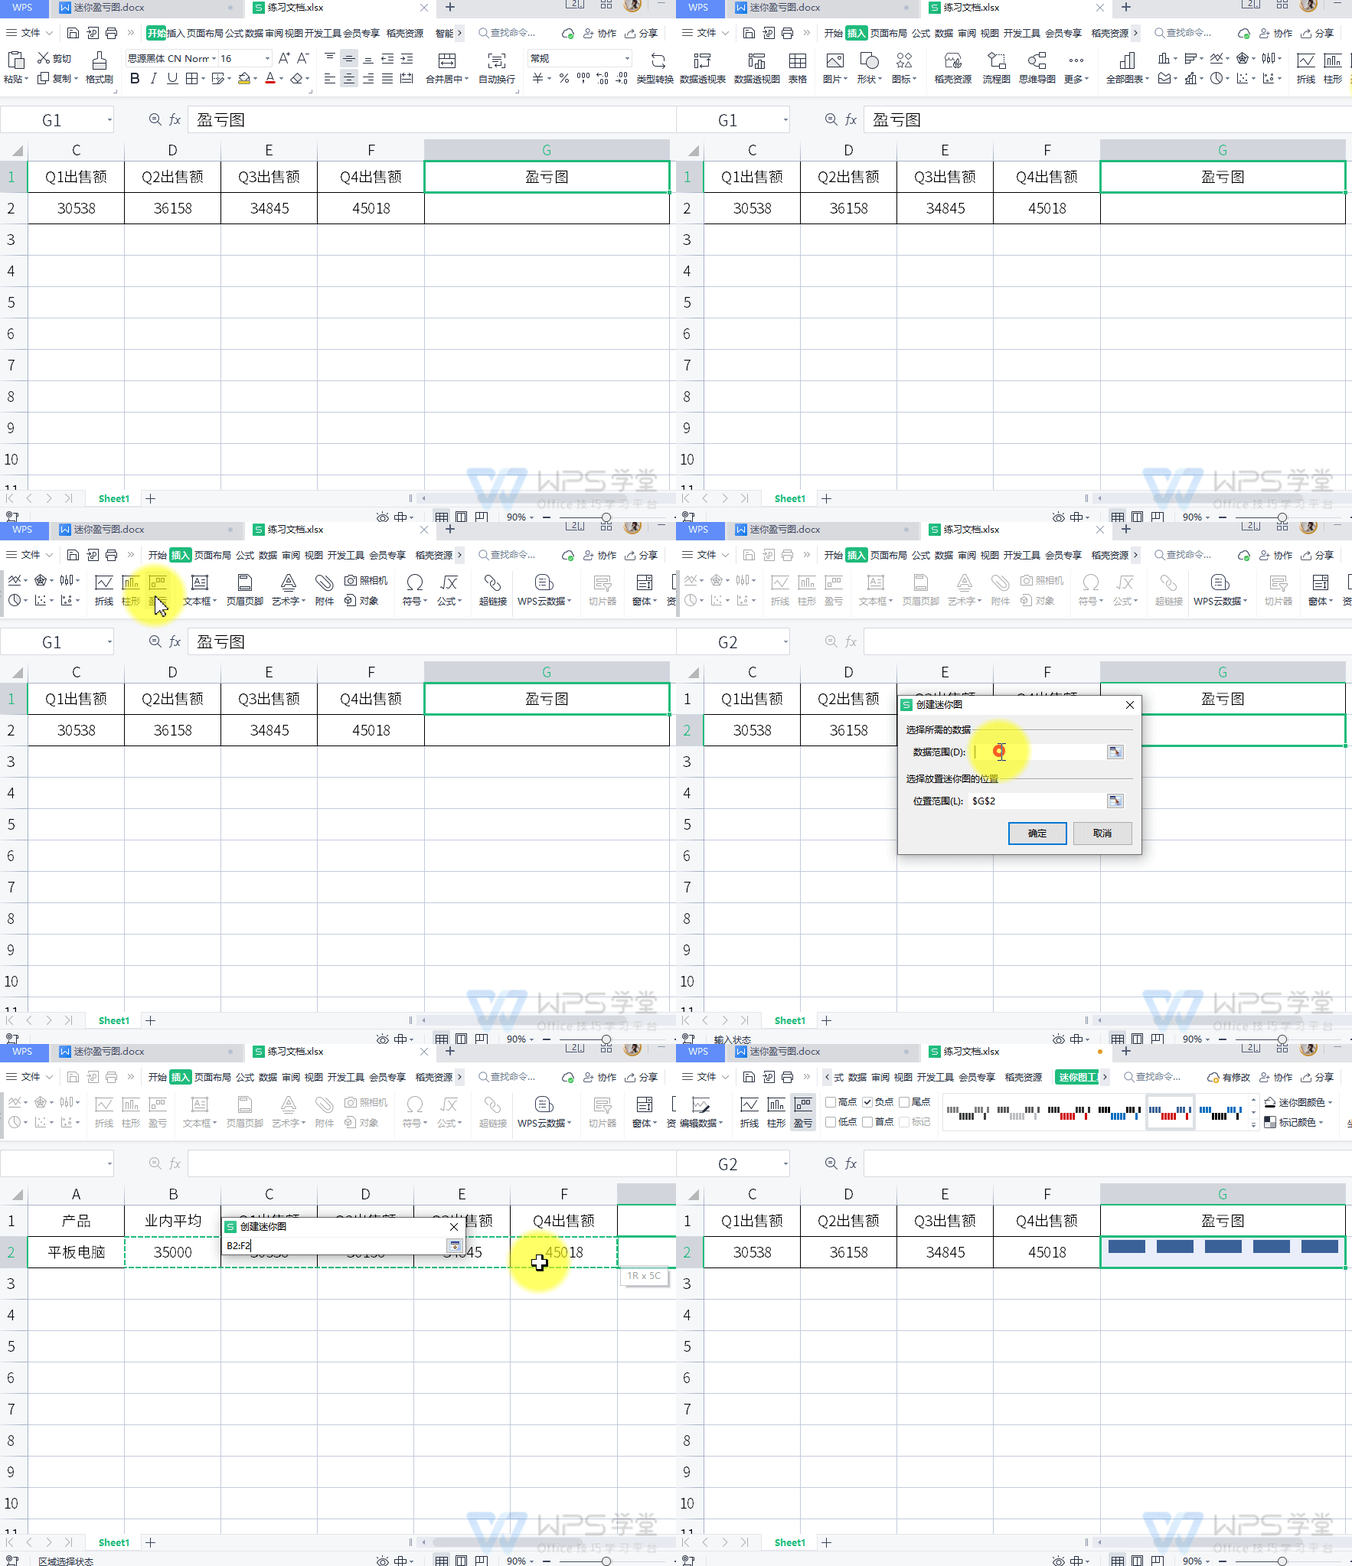
▪Taking this table as an example, click the "Insert" tab - "Mini Profit and Loss Chart".
Select the B2:F2 area in the "Data Range" and click OK, so that the "Mini Profit and Loss Chart" is inserted into the cell.

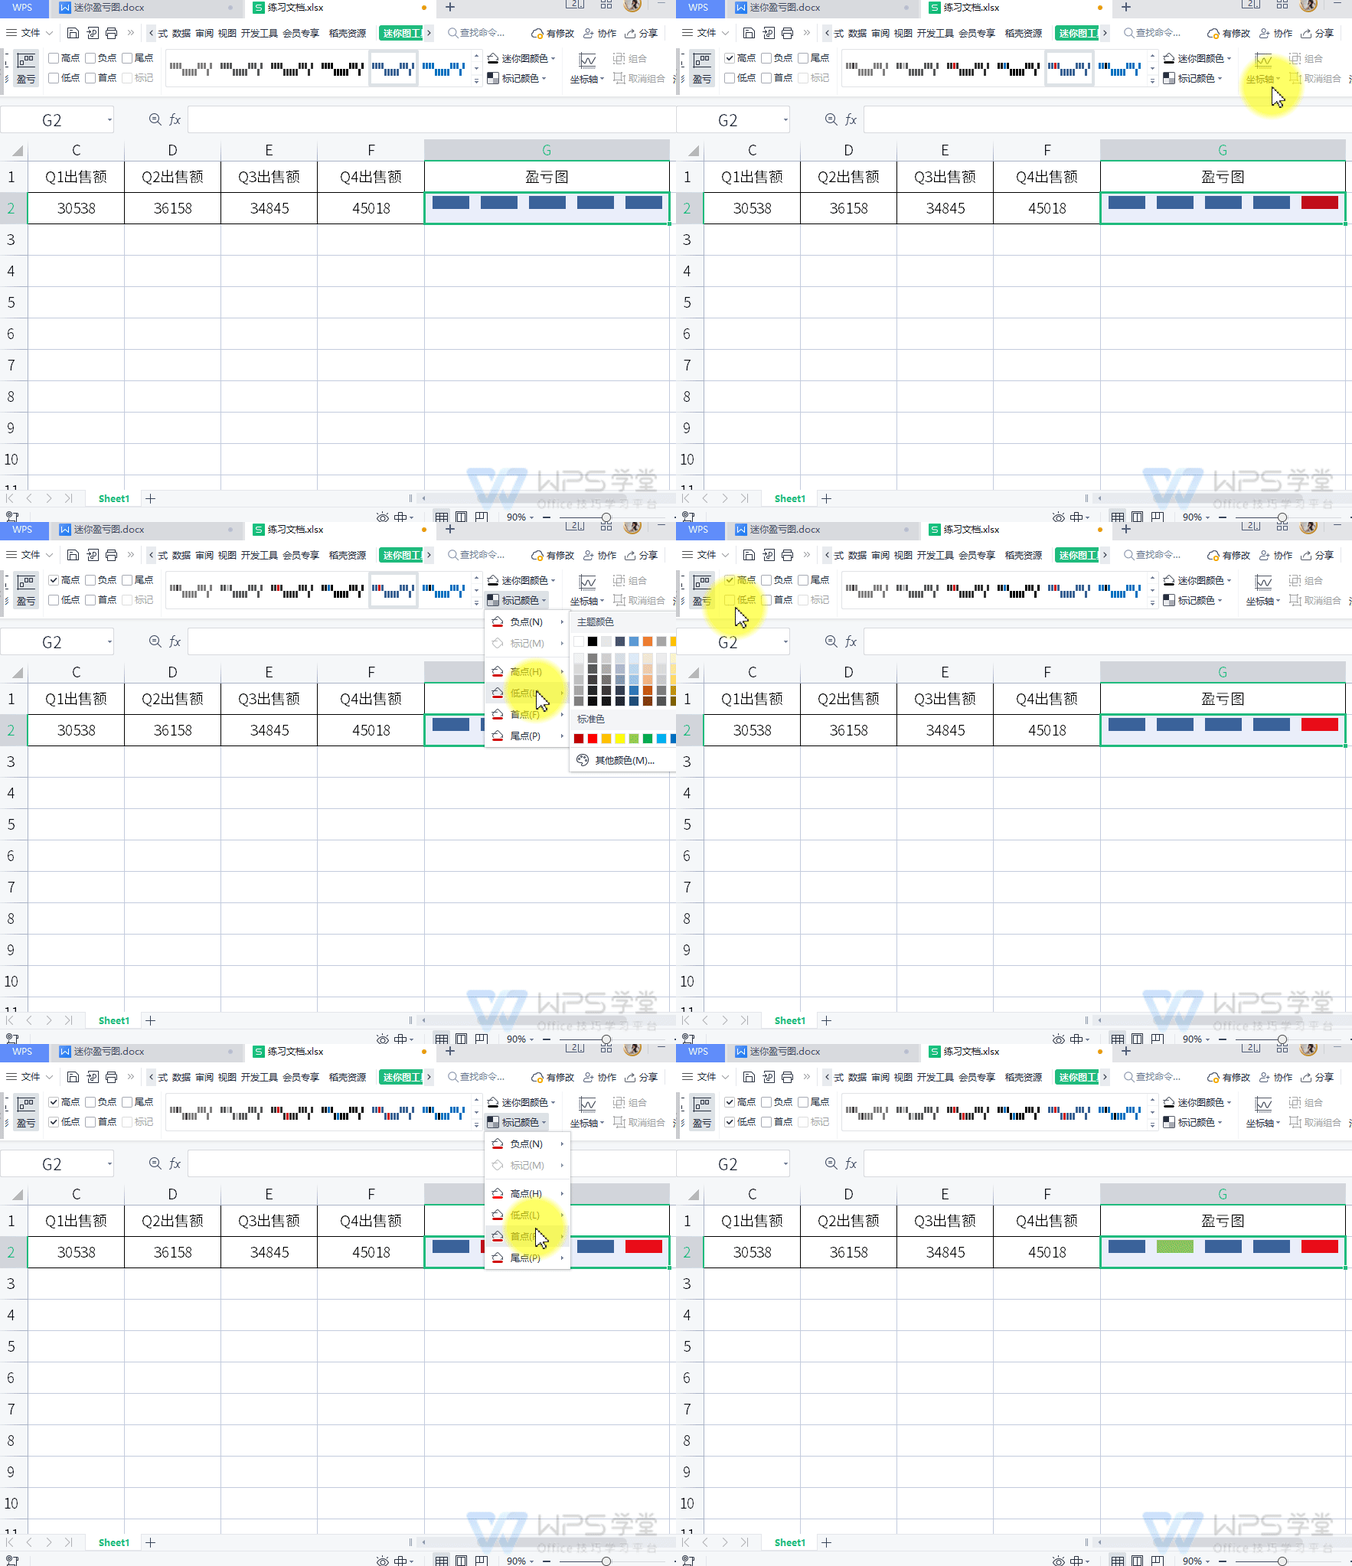
▪If we want to set the highest sales point, click "High Point" and set the mark color to red, click "Low Point" and set the mark color to green, so that we can The highest and lowest points of this product can be seen on the profit and loss chart.

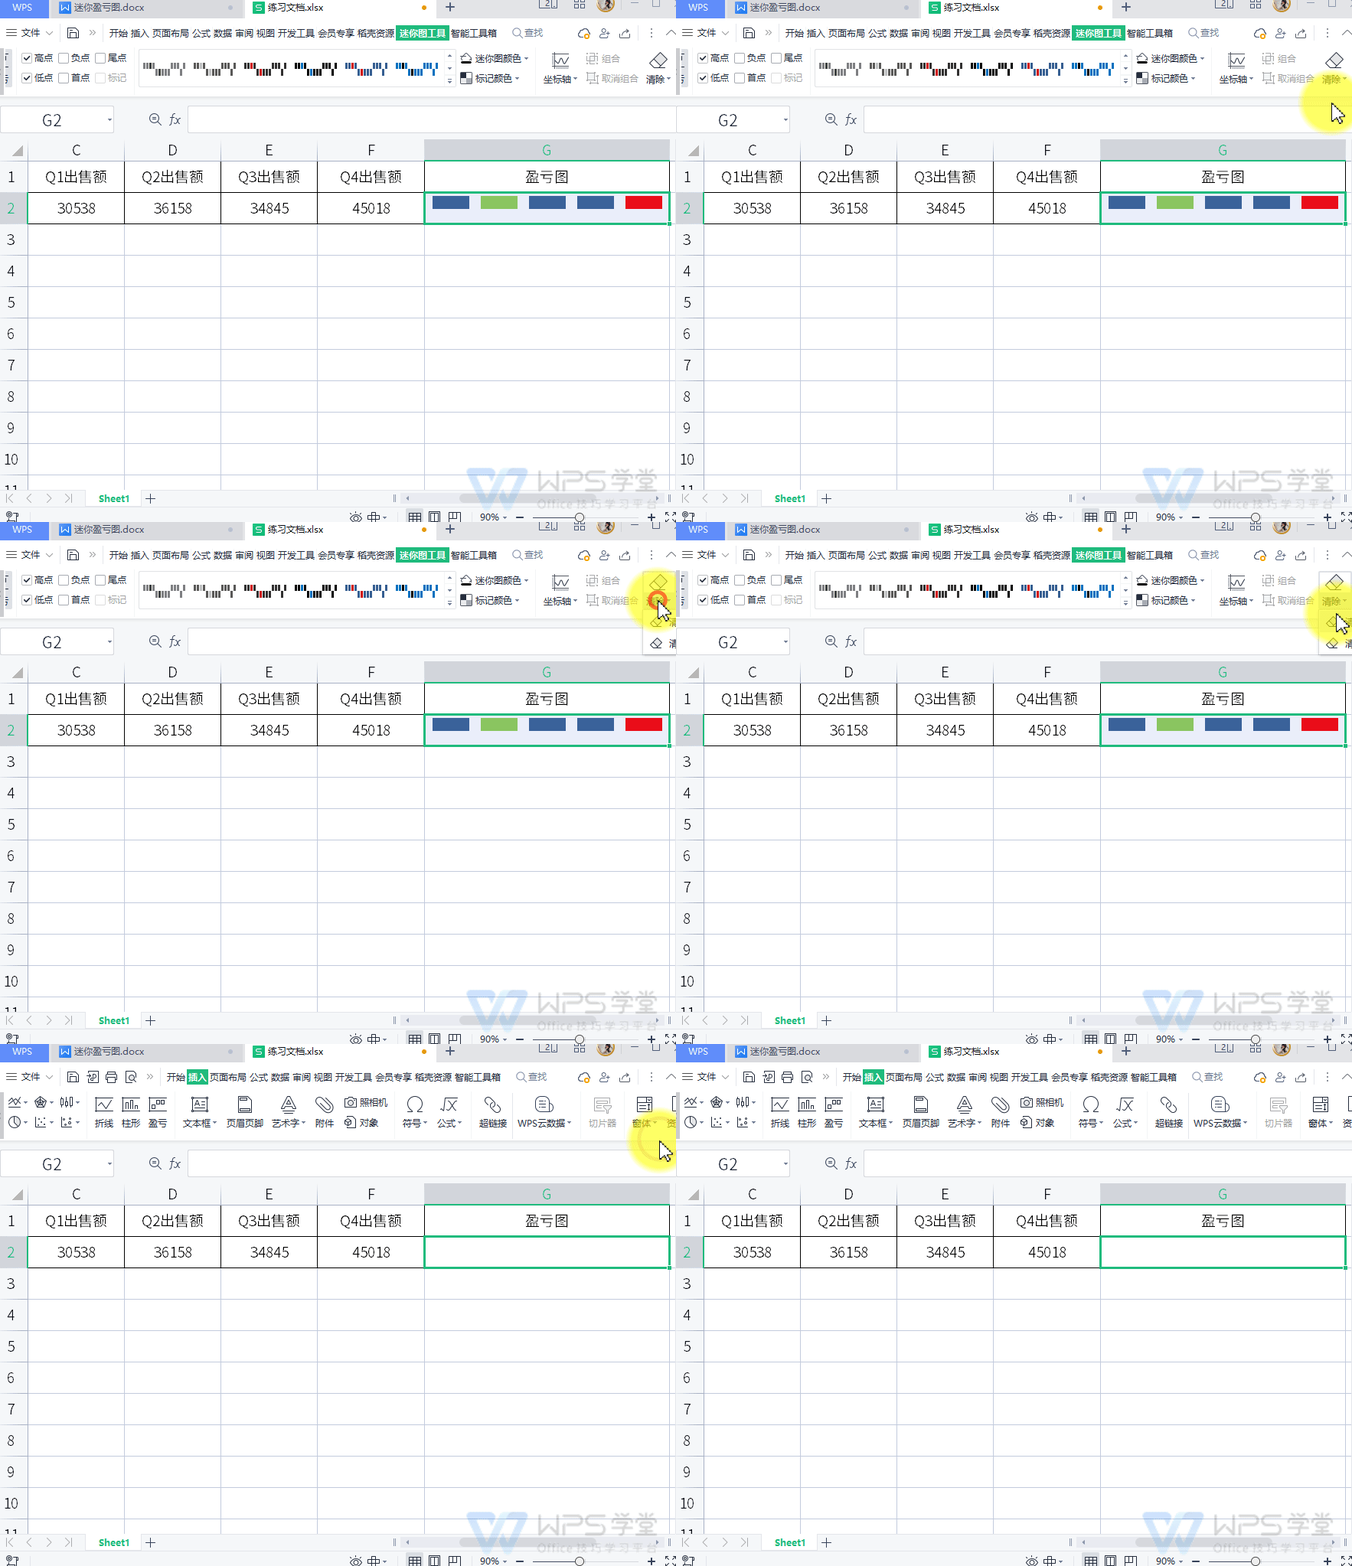
▪If we want to delete the mini-image in this cell, just click the "Clear" button.

Articles are uploaded by users and are for non-commercial browsing only. Posted by: Lomu, please indicate the source: https://www.daogebangong.com/en/articles/detail/ru-he-cha-ru-mi-ni-ying-kui-tu.html

 支付宝扫一扫
评论列表(196条)
测试