- Graphic skills
In this course, we will lead you to use simple 4-step operations to easily master the use skills of laminated area charts (smoothing).
Step one:
First, click the "Insert" menu and find the "Chart" option (you can also choose "Online Chart").
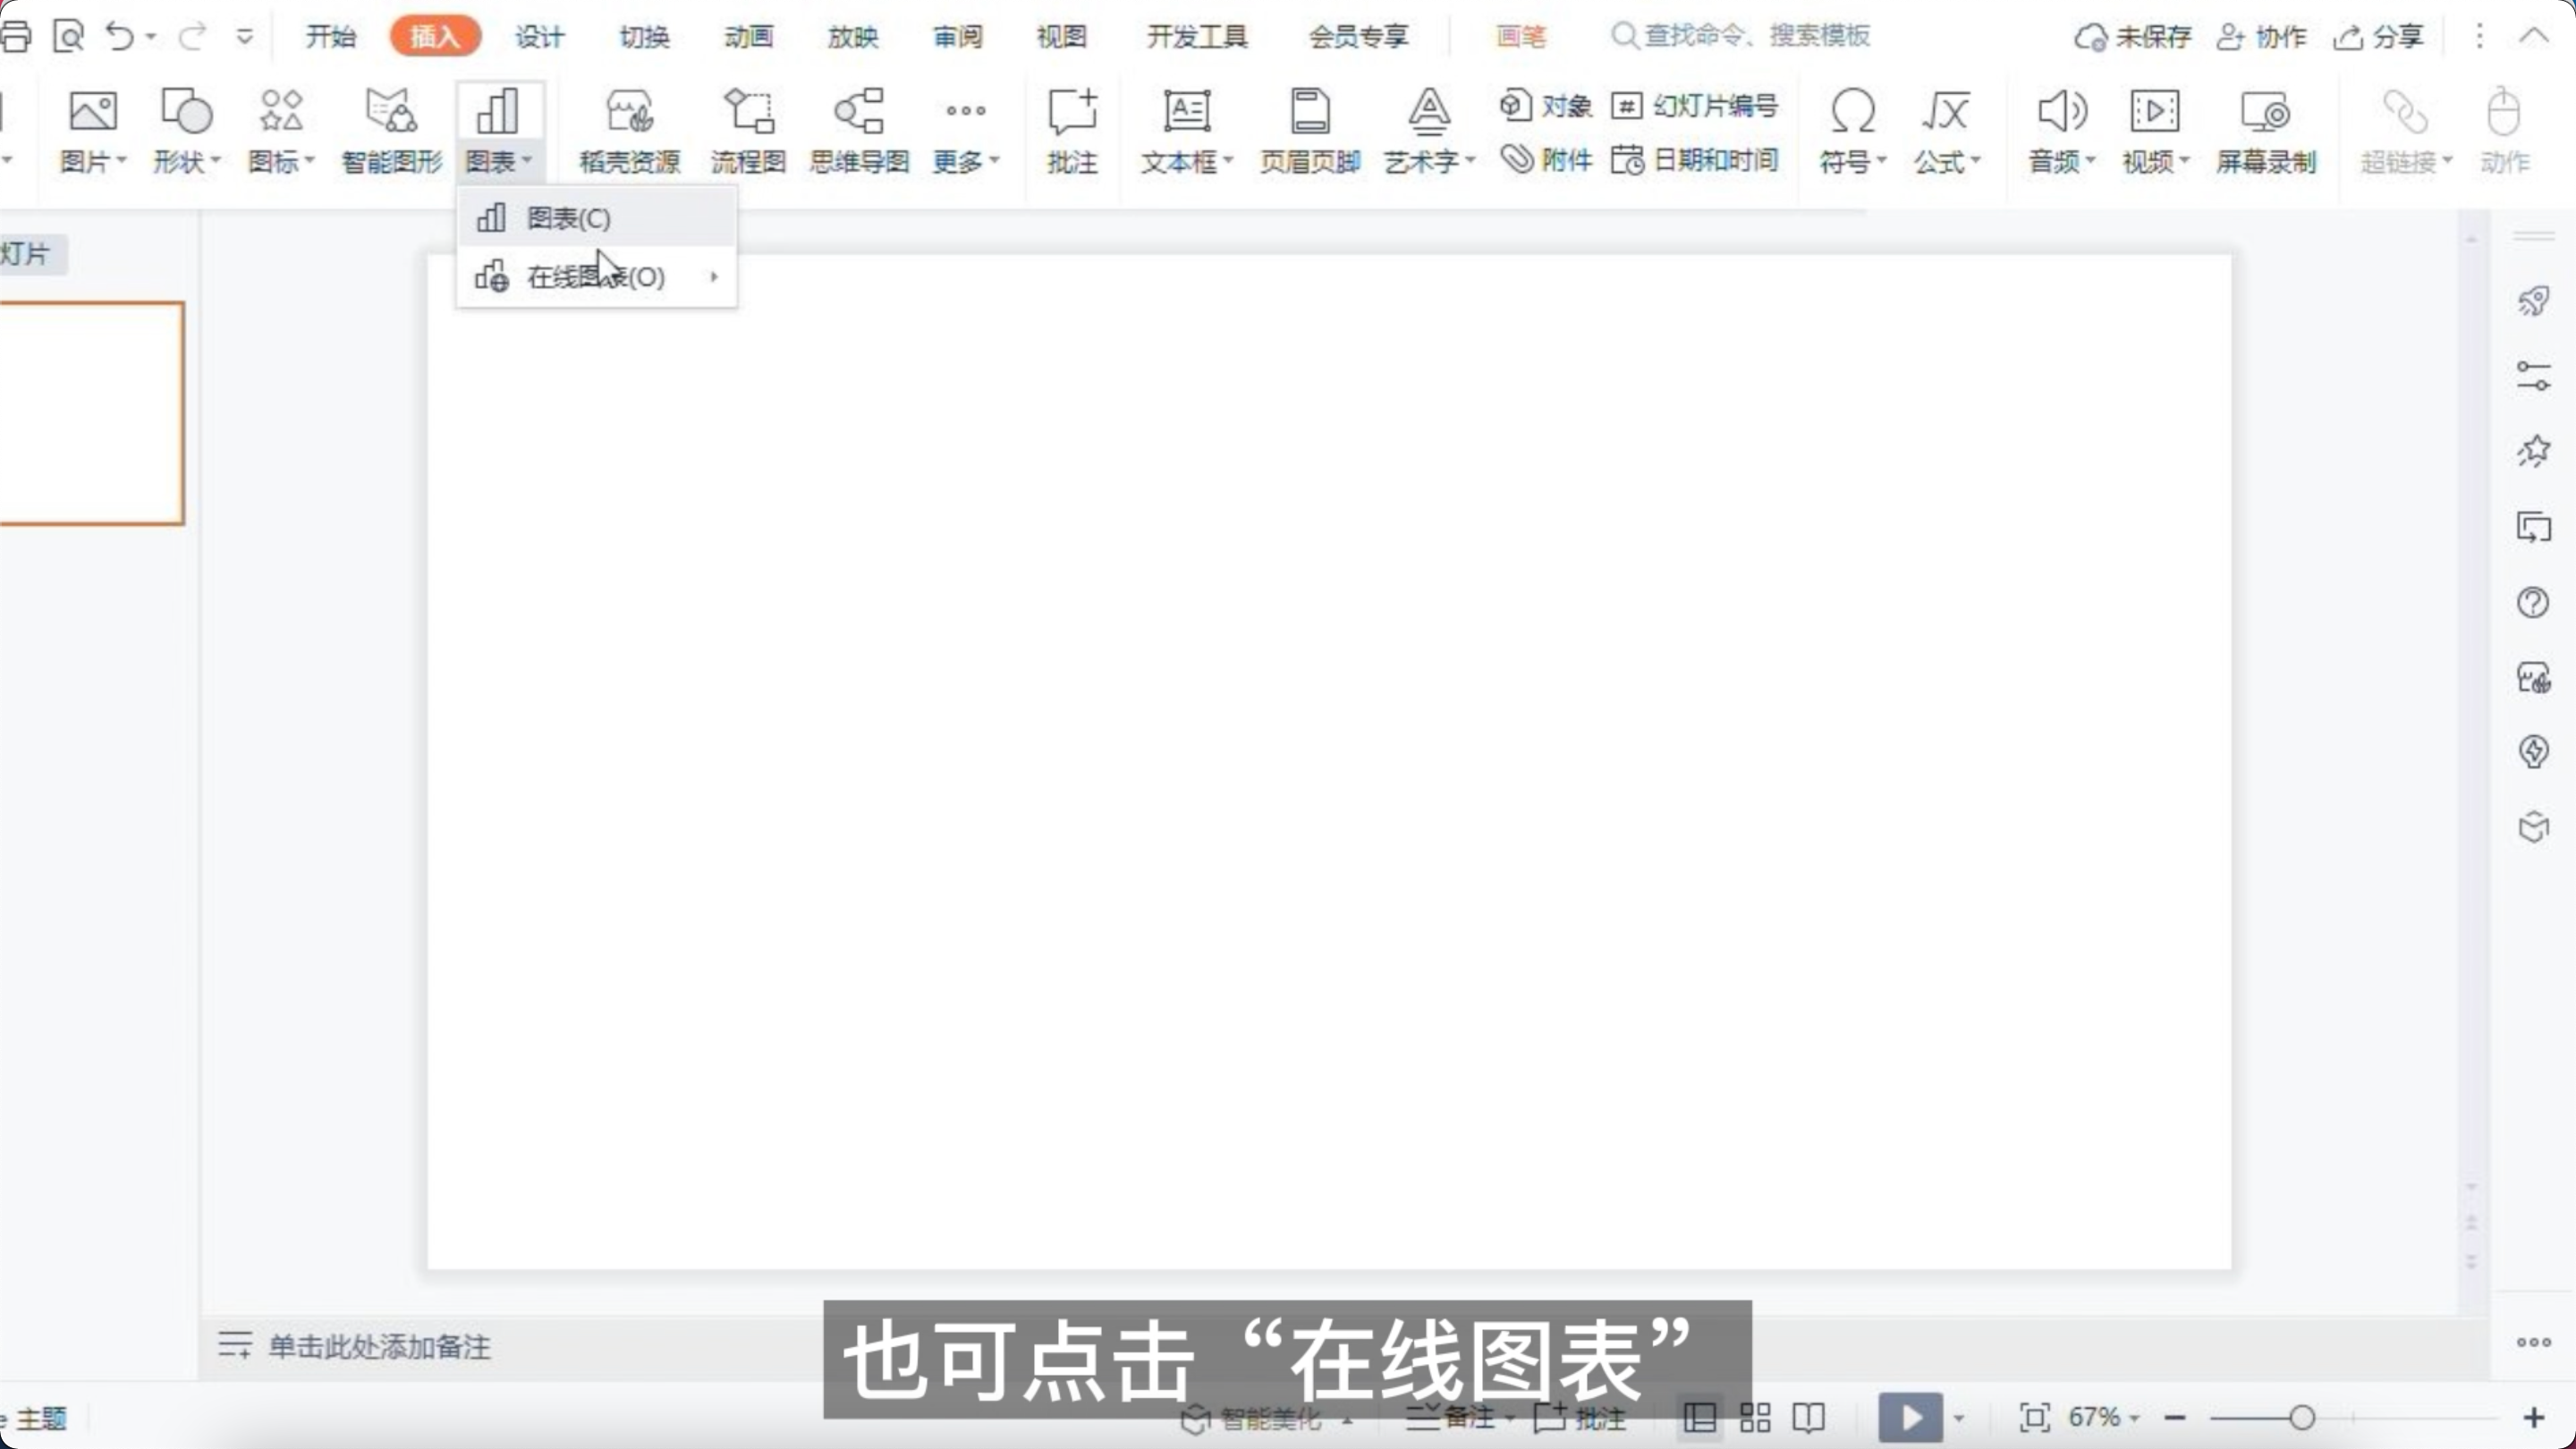
In the "Dynamic Charts" category, select "Area Chart", then click "Stacked Area Chart (Smooth)" to insert it into your presentation.
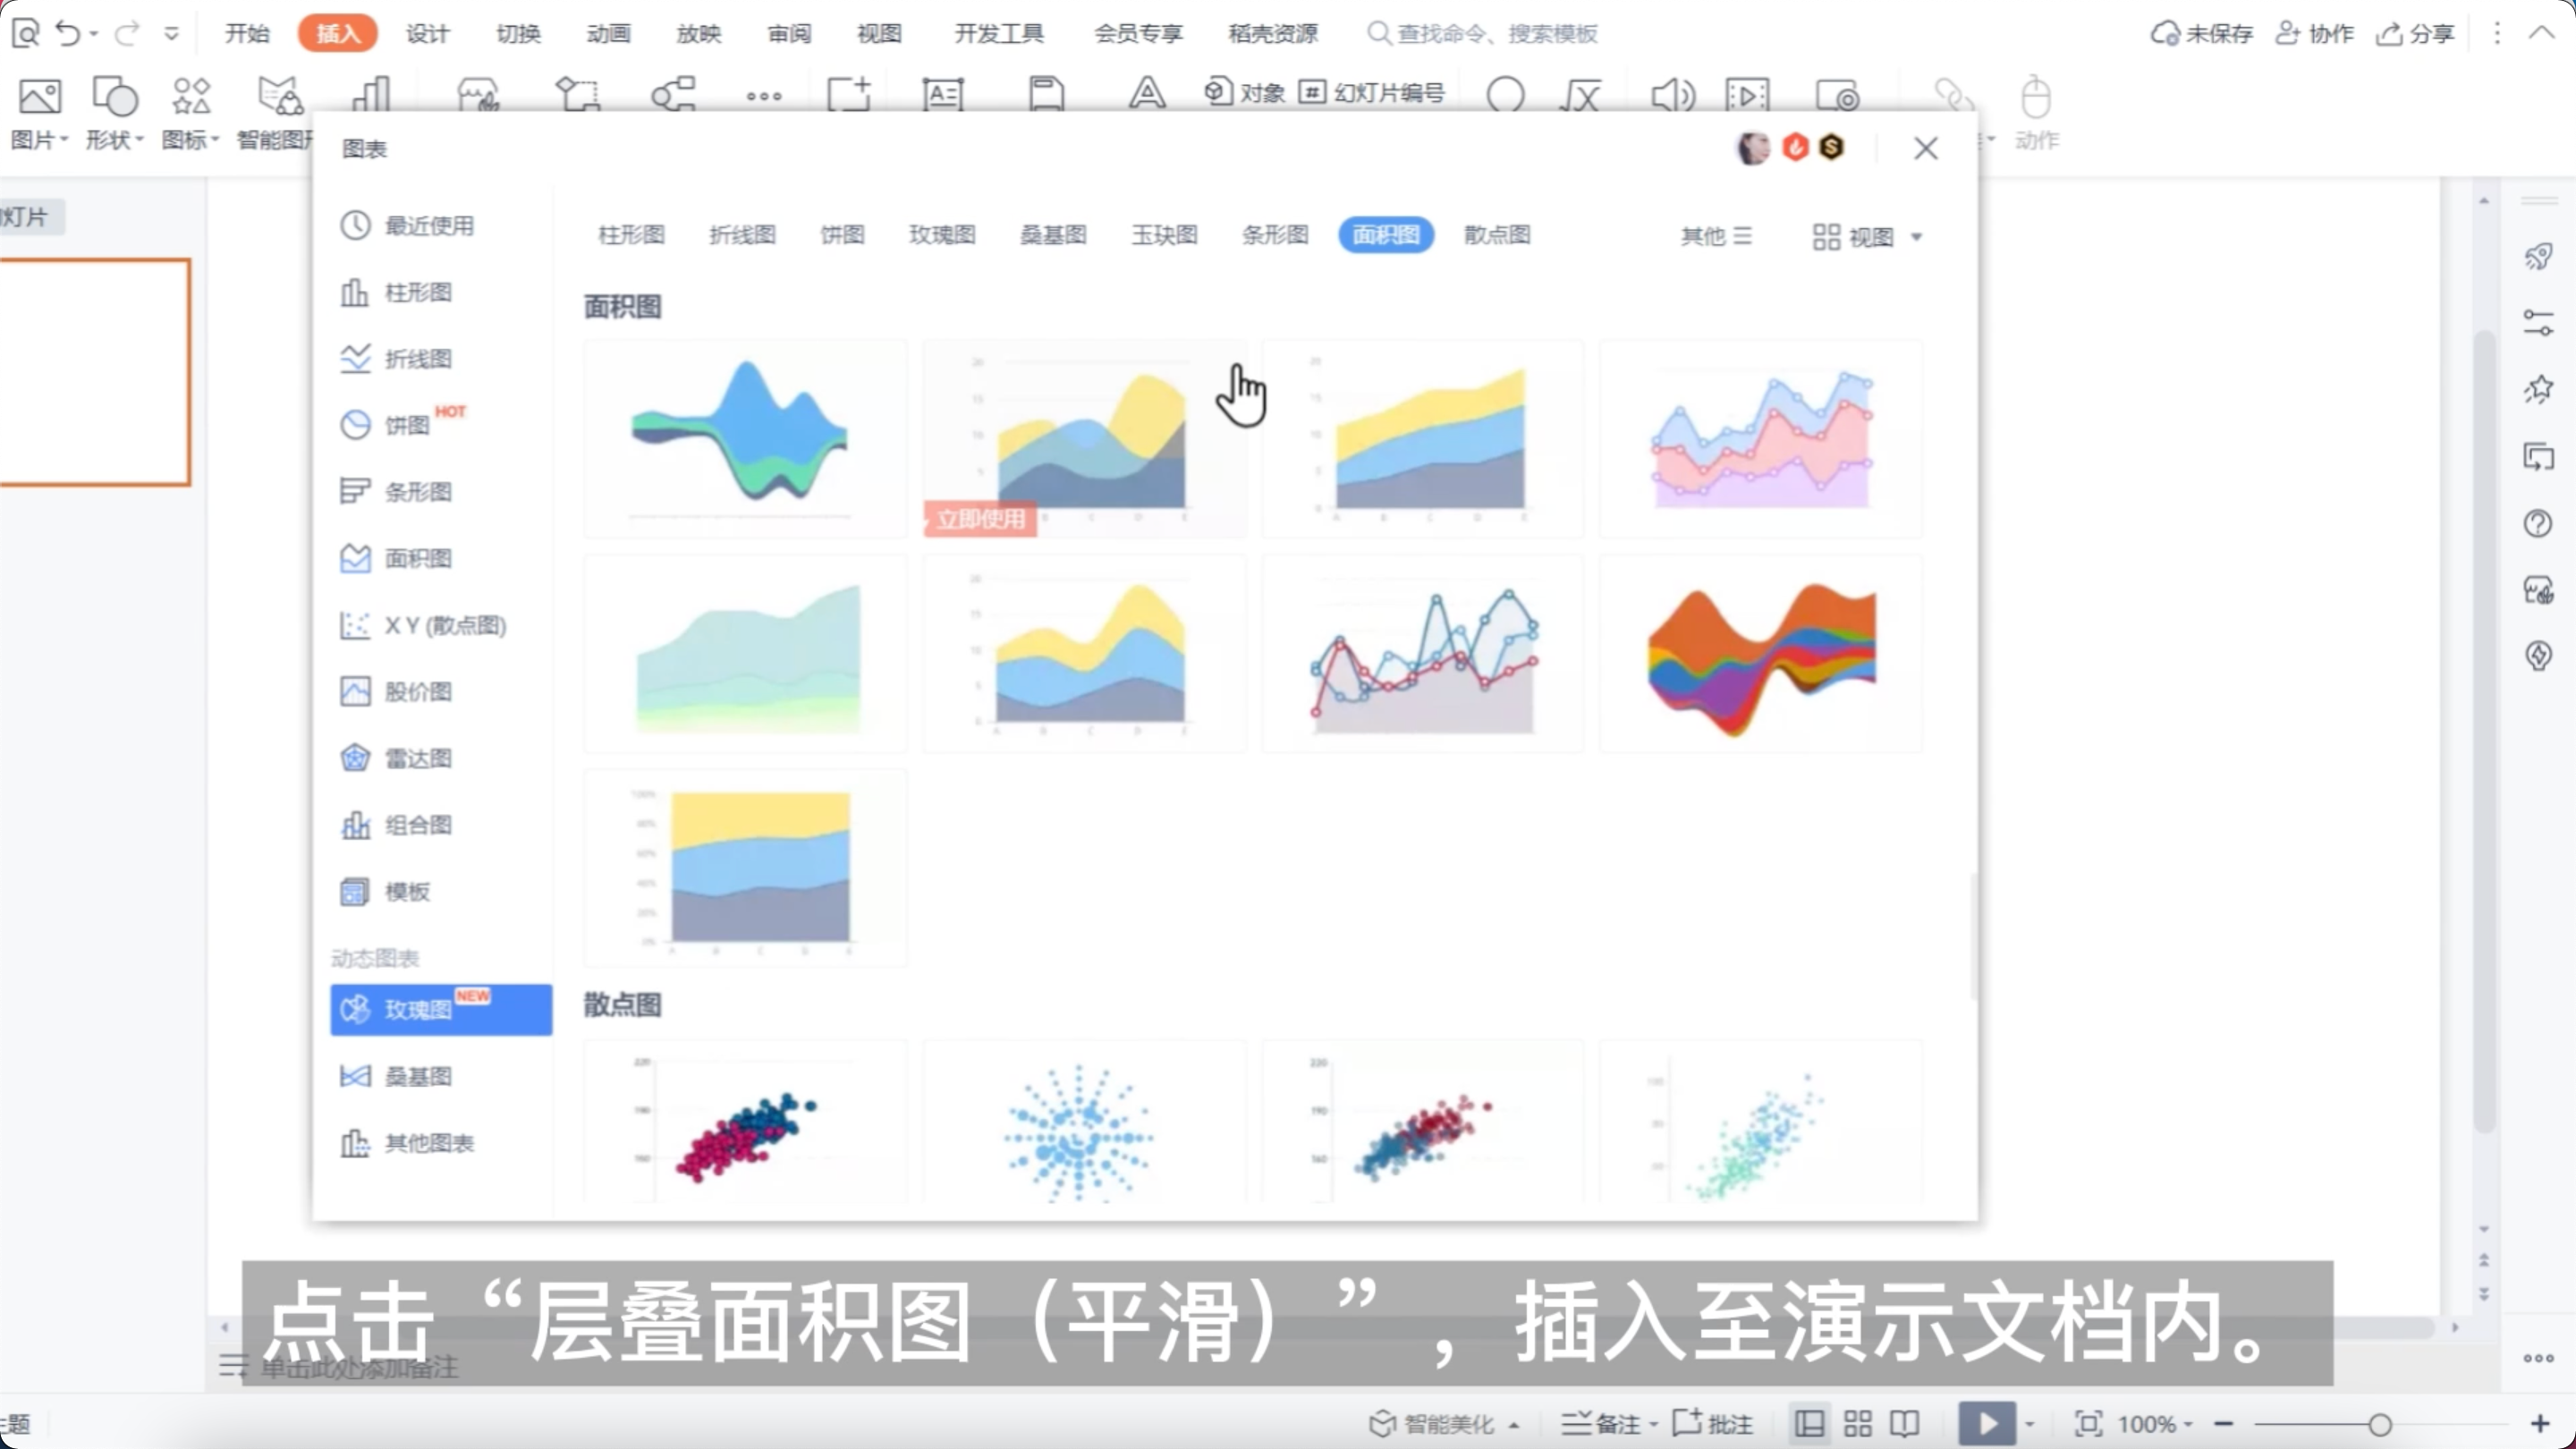
Step 2:
Click the Edit button above the chart.
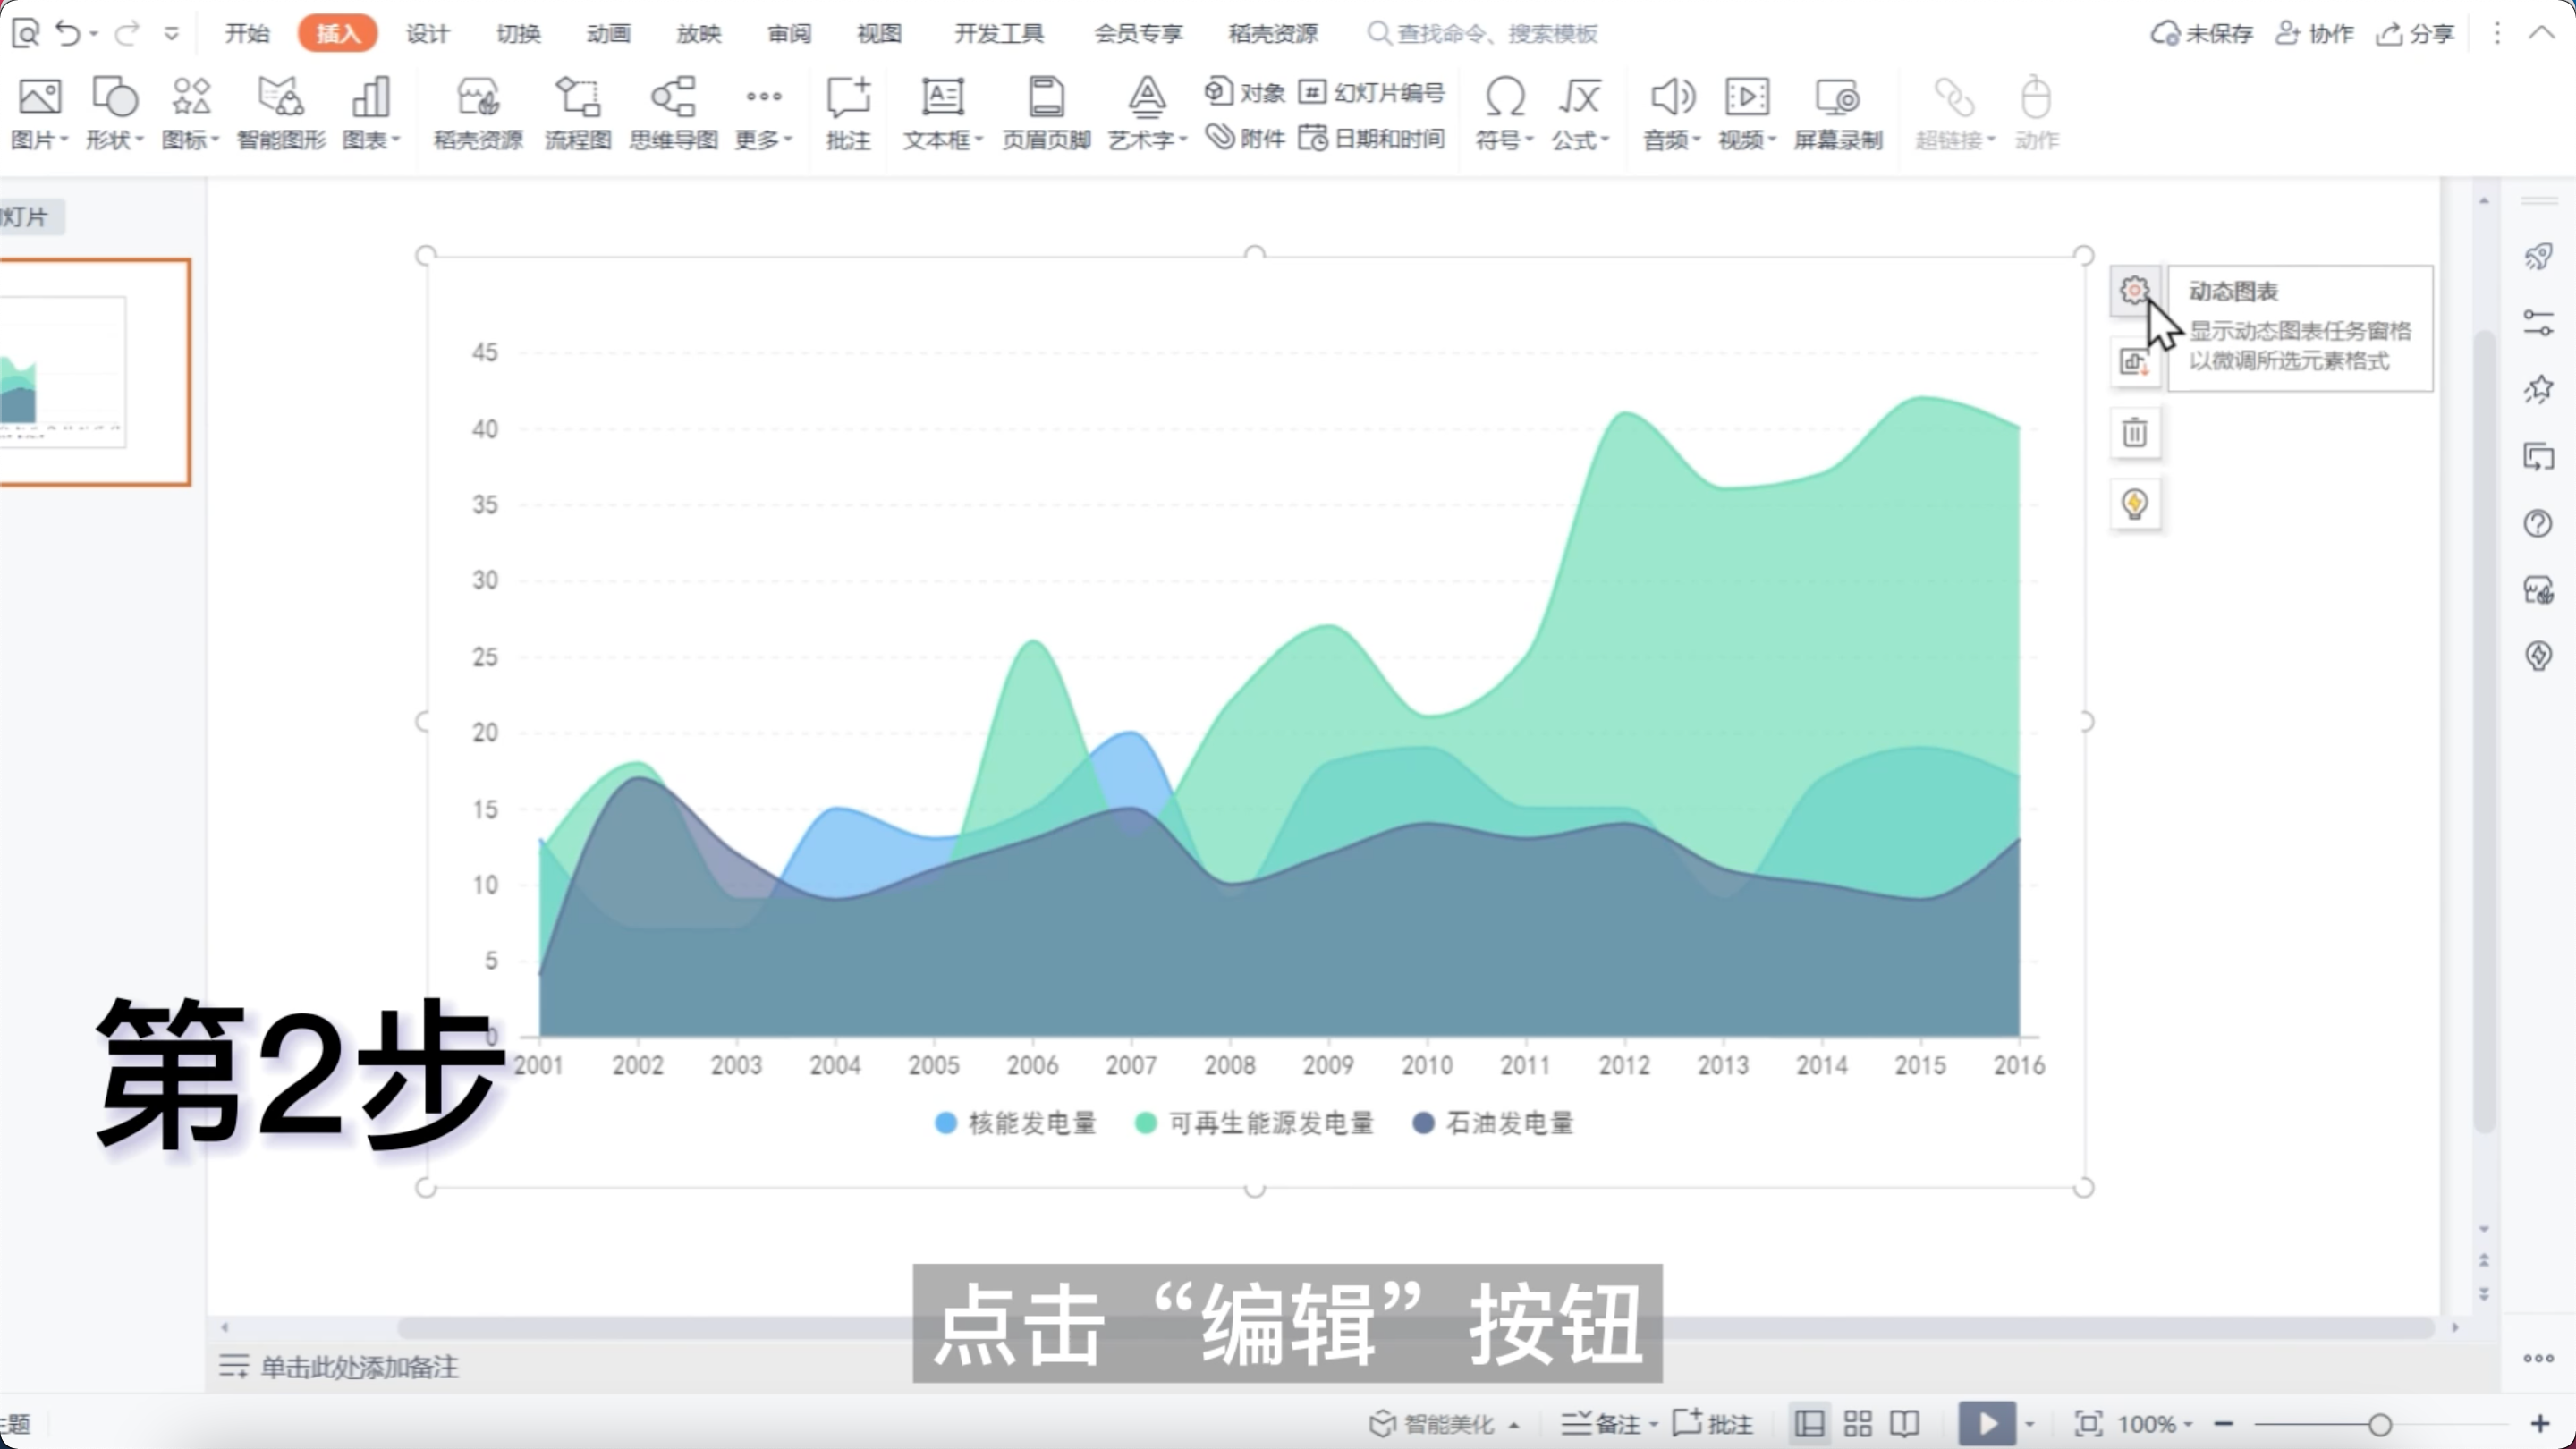
Step 3:
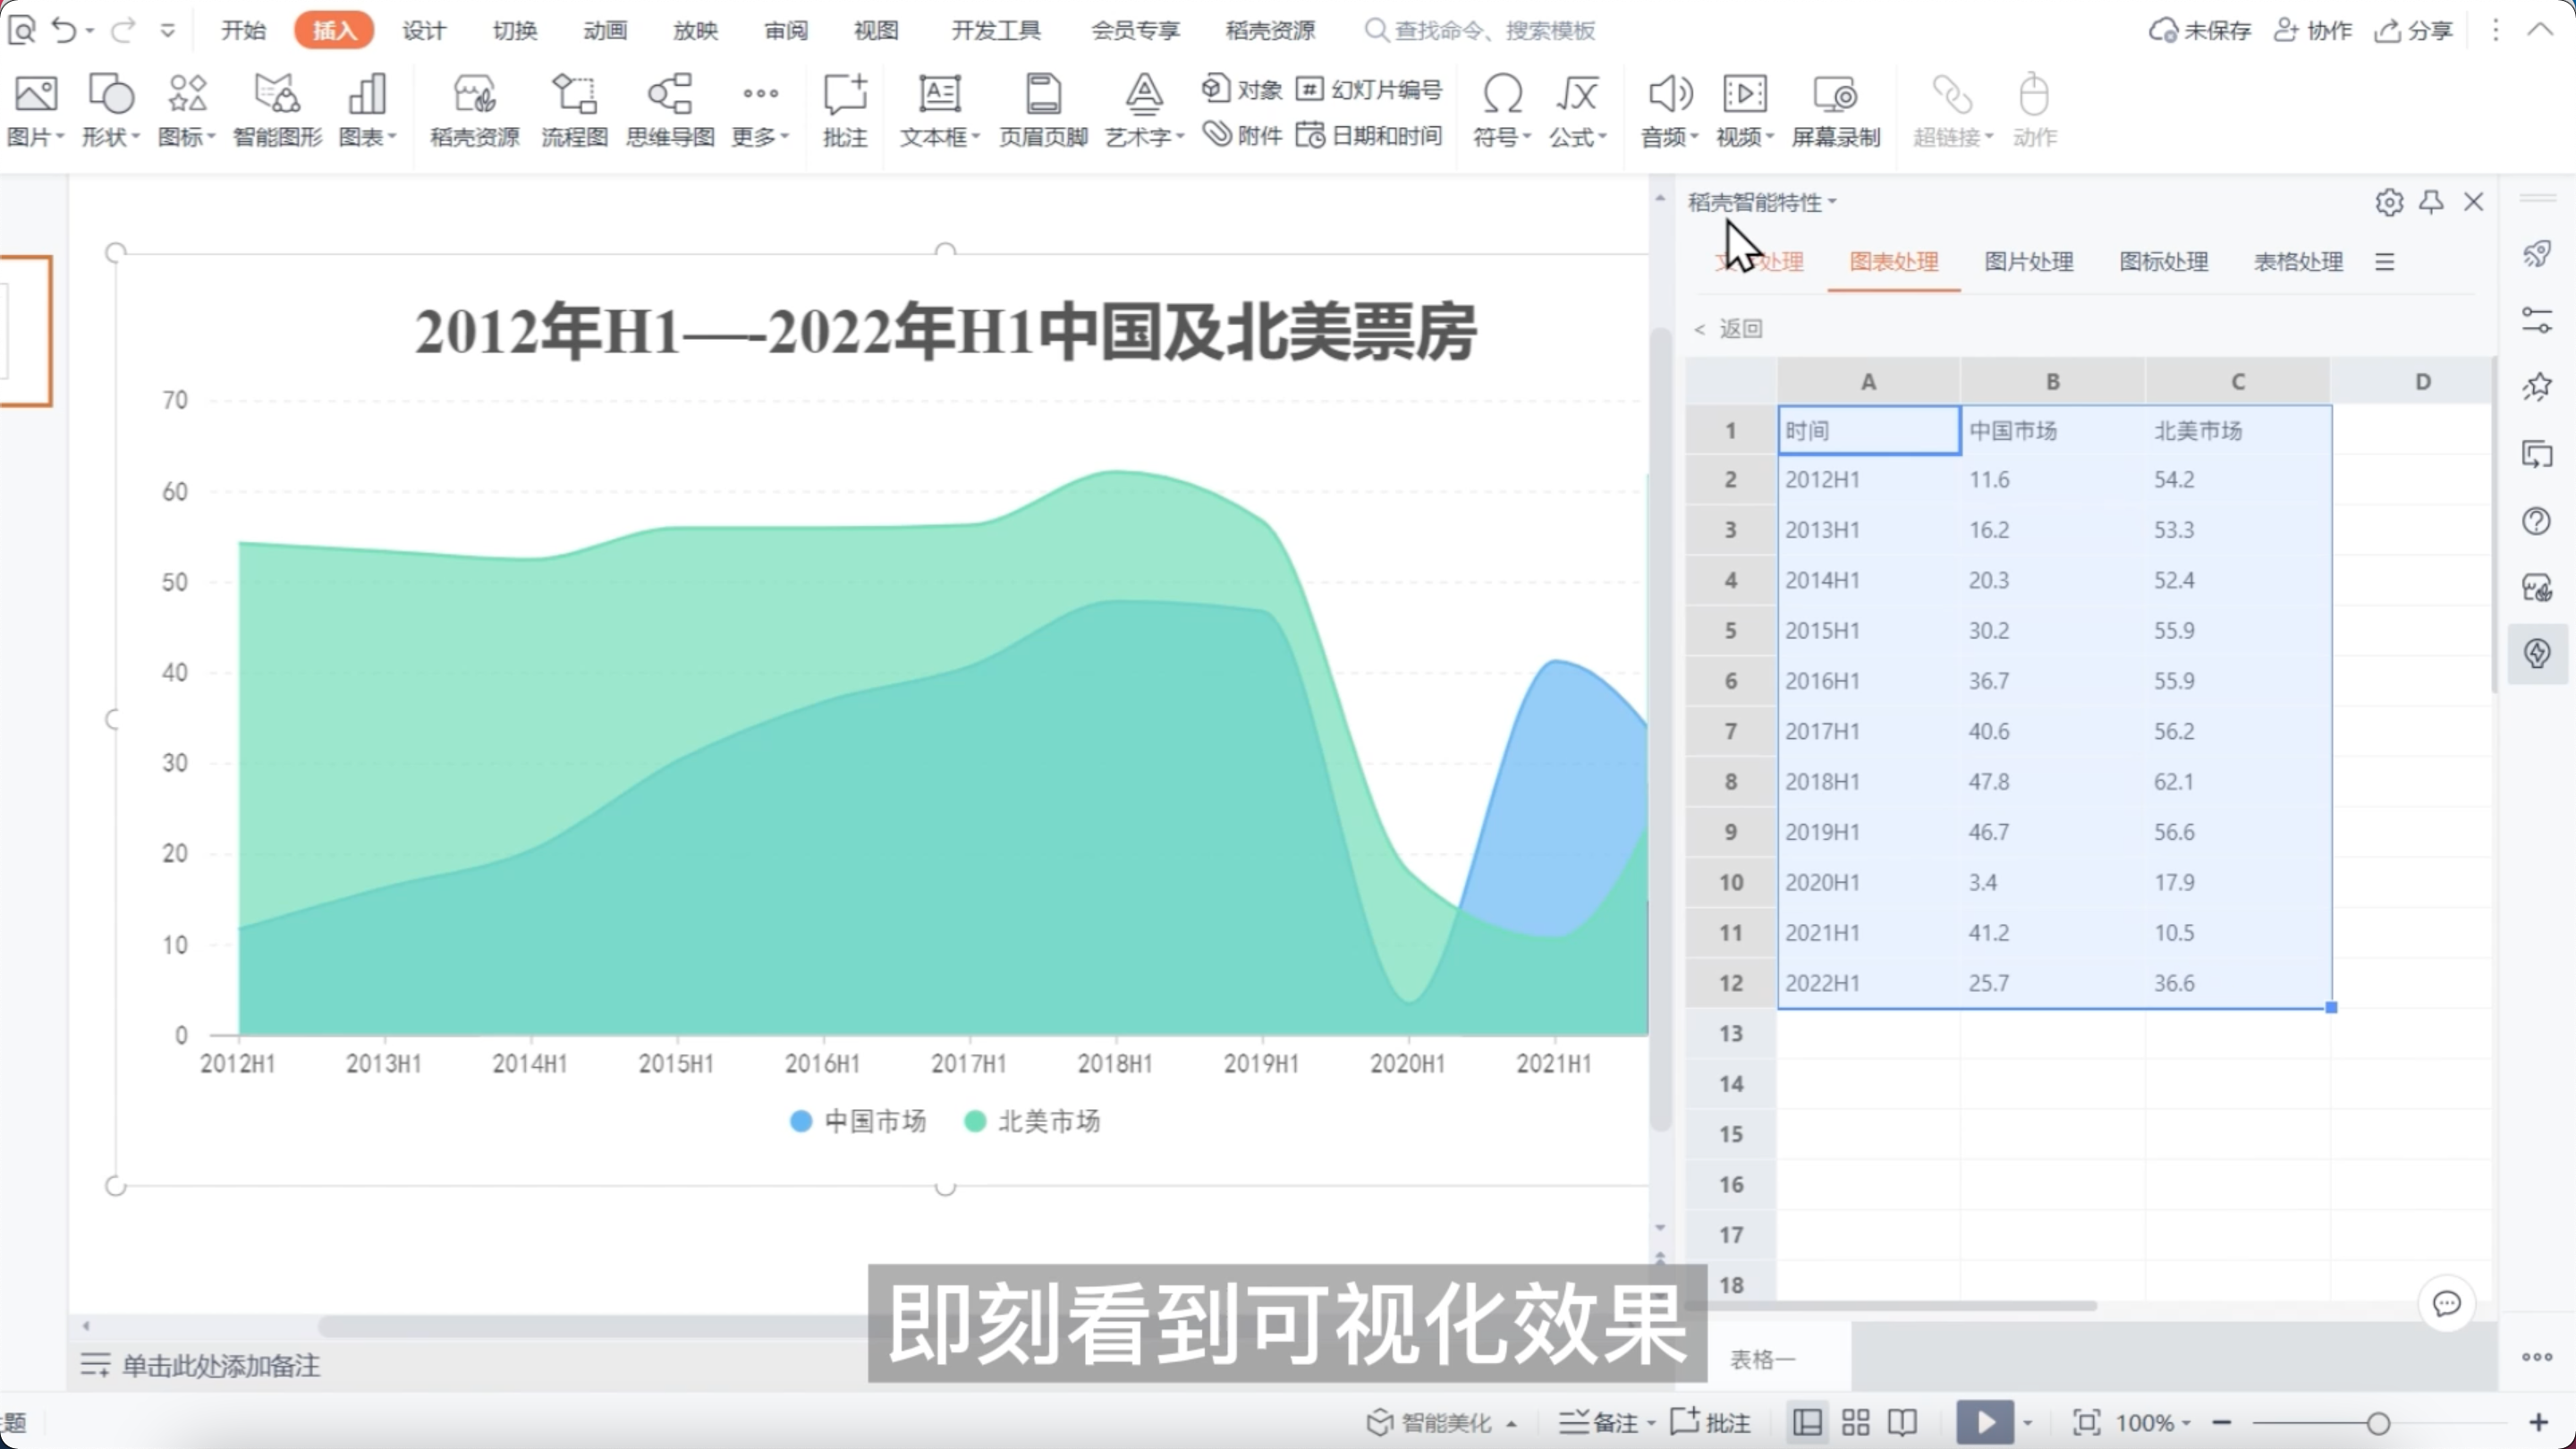
Now you can start editing the data in the chart.
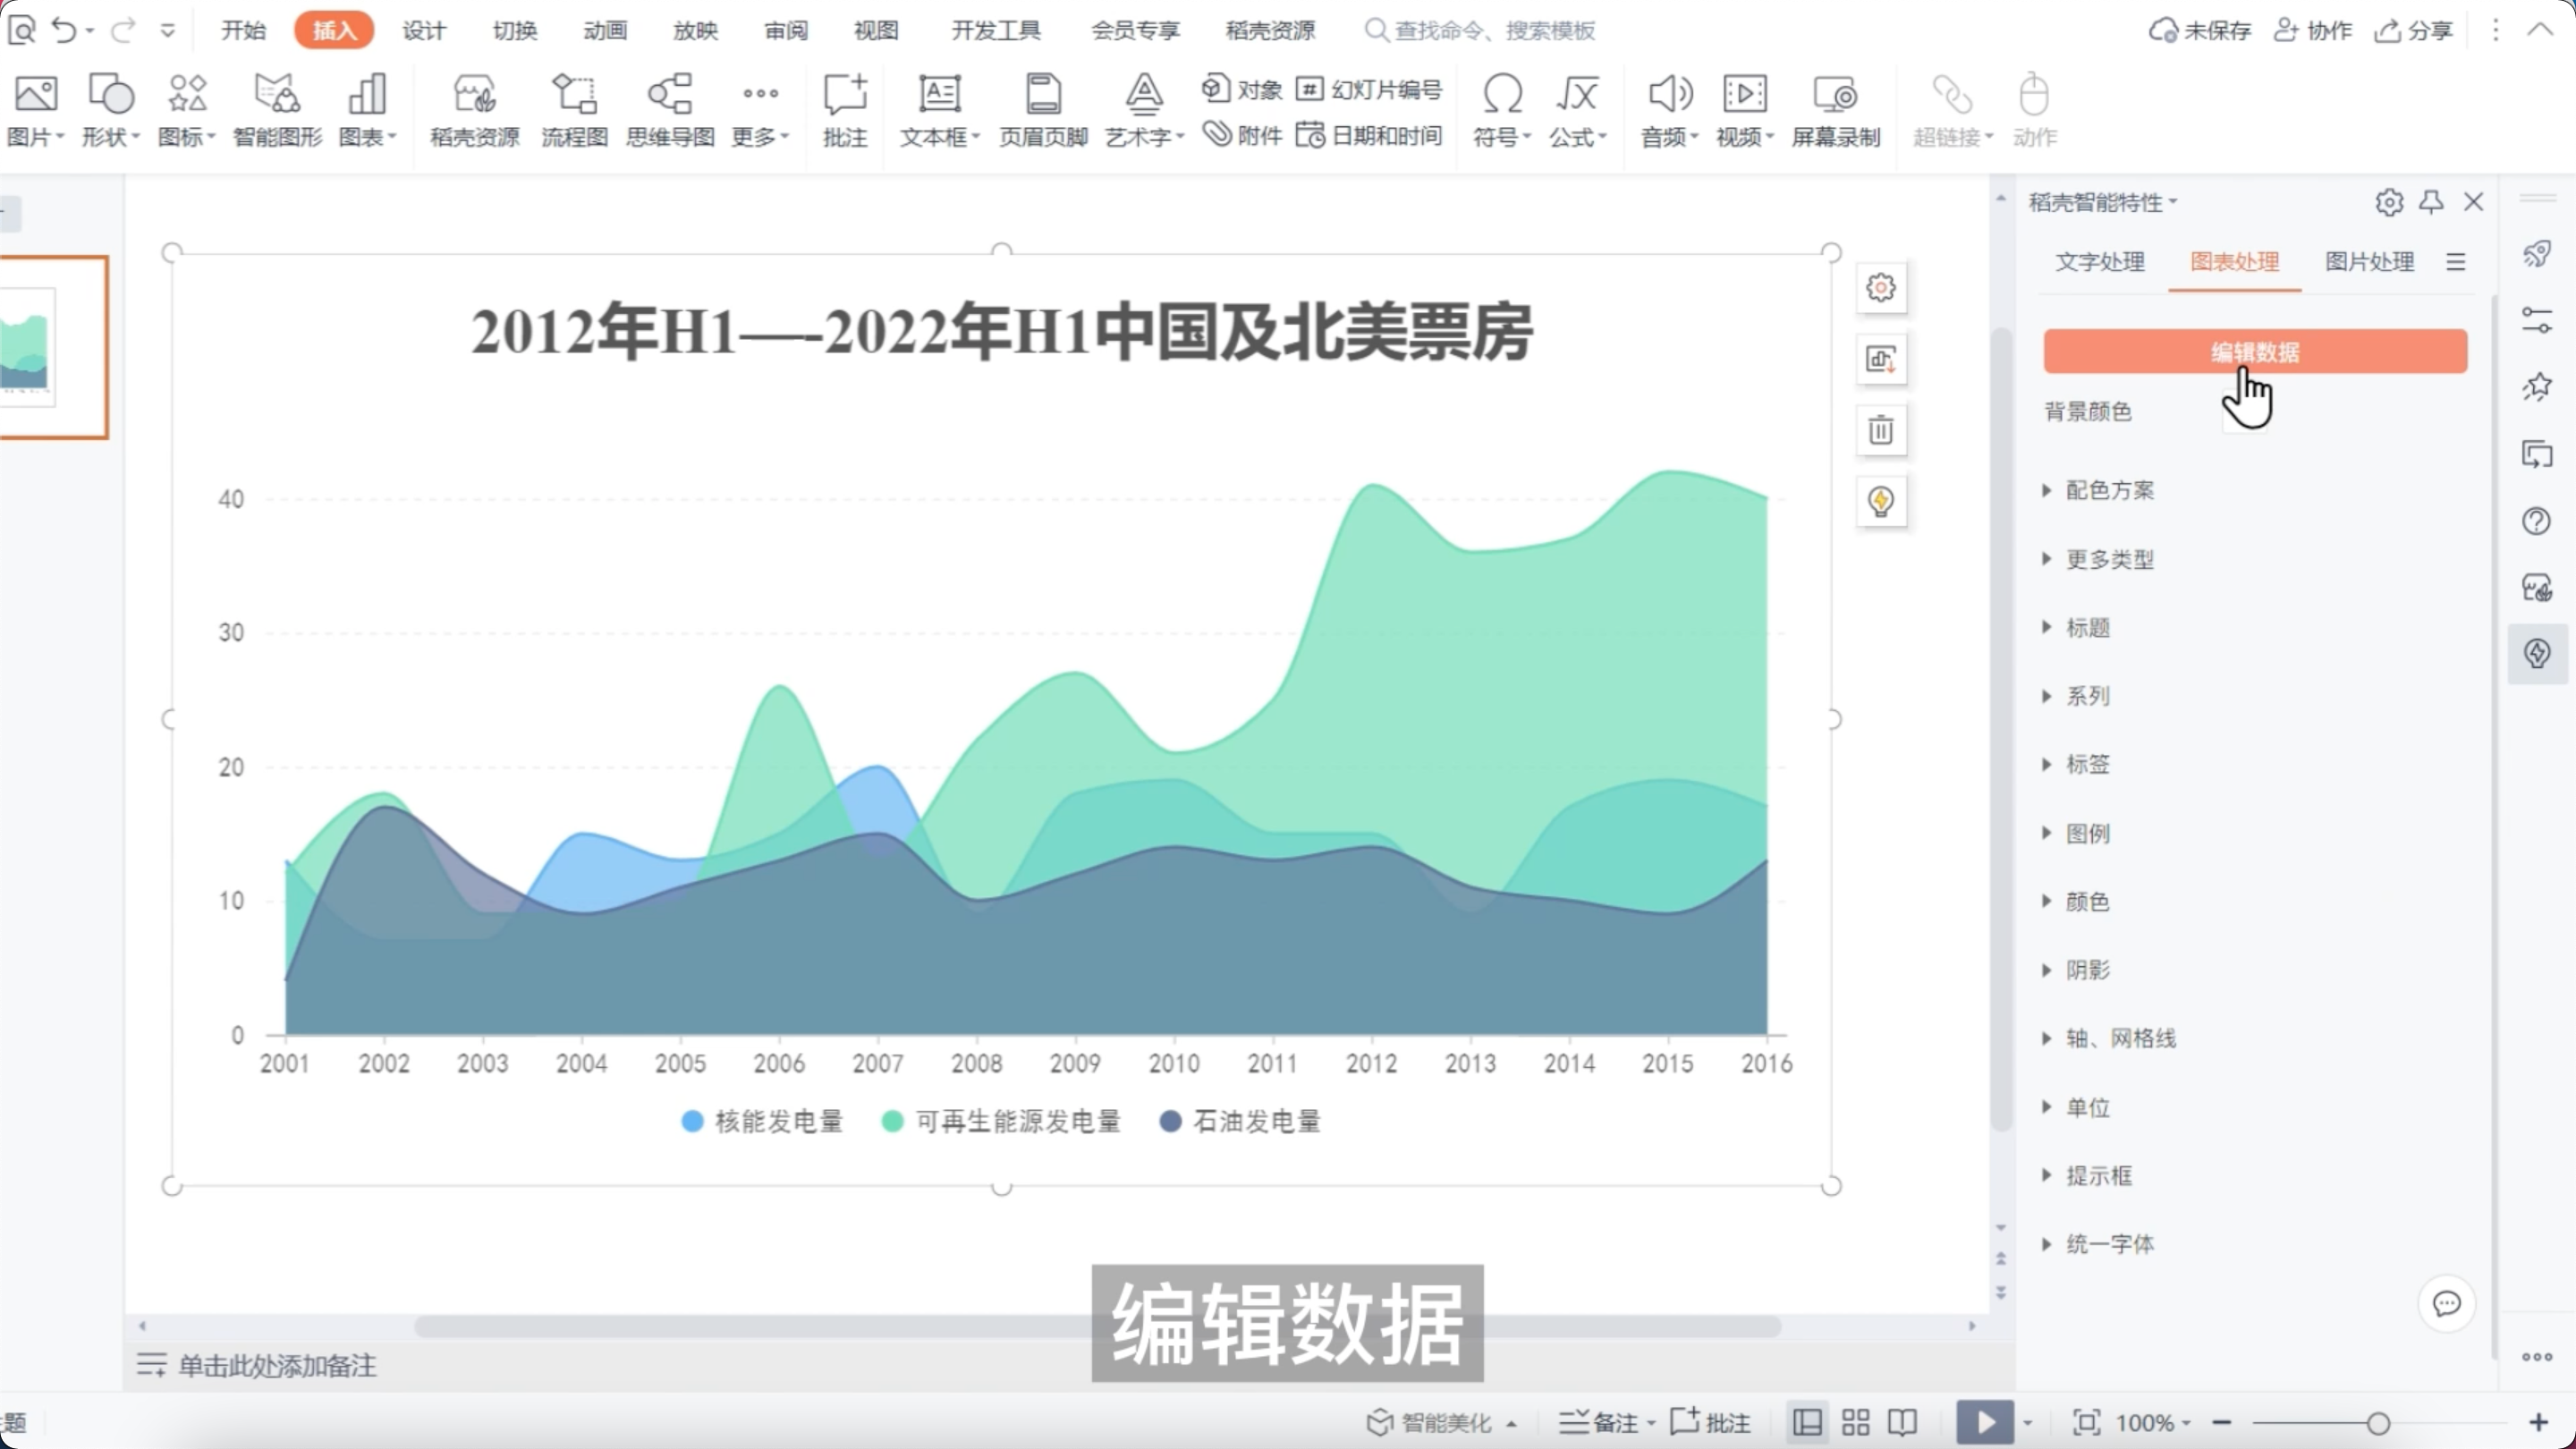
Follow the format of the sample data, copy and paste your data into the chart, and you'll instantly see the effect of your data visualization.
Step 4:
Finally, adjust the color, font, unit, etc. of the chart according to your needs to achieve a more personalized and professional display effect.
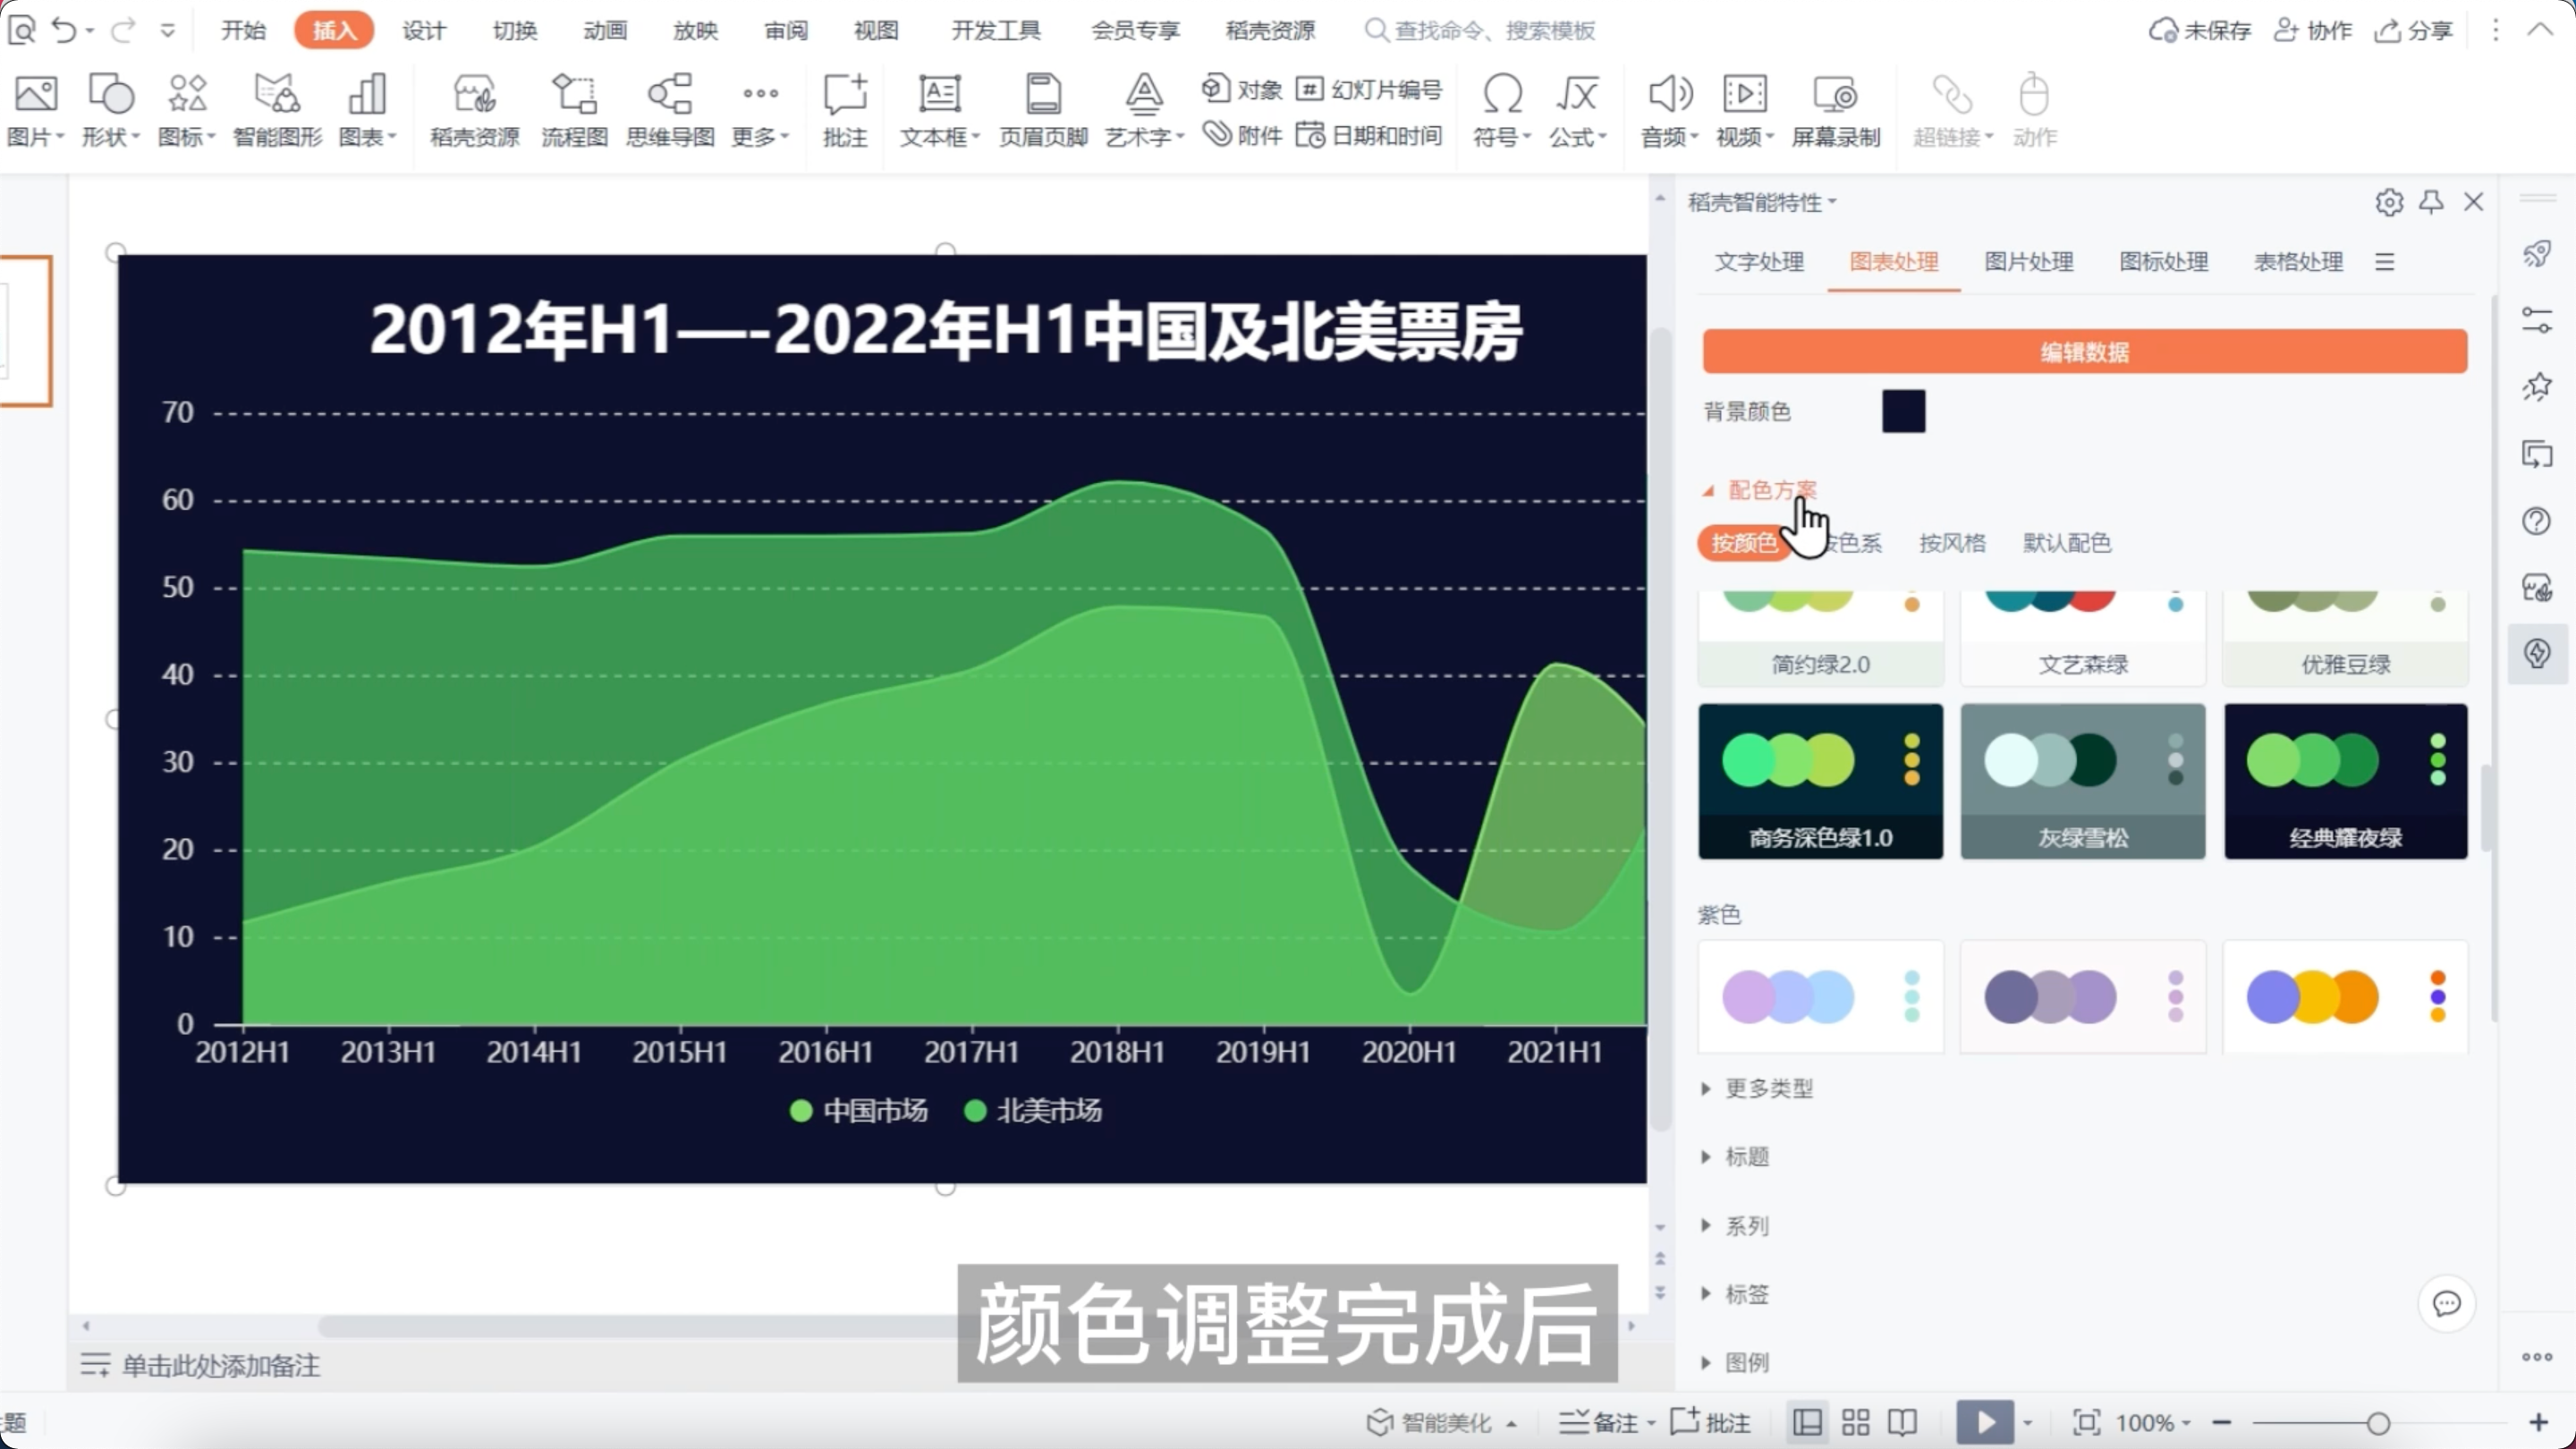
In this way, you have successfully created a stacked area chart (smooth). During the presentation, dynamic charts can also provide interactive effects to make your presentation more vivid.
Articles are uploaded by users and are for non-commercial browsing only. Posted by: Lomu, please indicate the source: https://www.daogebangong.com/en/articles/detail/ping-hua-ceng-die-mian-ji-tu-jing-xuan-ji-qiao.html

 支付宝扫一扫
评论列表(196条)
测试