Articles are uploaded by users and are for non-commercial browsing only. Posted by: Lomu, please indicate the source: https://www.daogebangong.com/en/articles/detail/dao-ke-tu-biao-zhi-zuo-jing-cui-dong-tai-tu-biao-yu-biao-ge-zu-jian-ru-men-zhi-nan.html
"The Essence of Rice Husk Chart Making: A Beginner's Guide to Dynamic Charts and Table Components"
Welcome to use the "dynamic chart" function of Rice Husk! Here, you will experience a new way of expressing data and enjoy the convenience and intuition brought by data visualization. Next, I will guide you through four simple steps. Even if you have no foundation, you can easily learn to use "dynamic charts" and start your journey of data visualization. ### Step 1: Select the chart data First, you need to select the data you want to display in the chart. 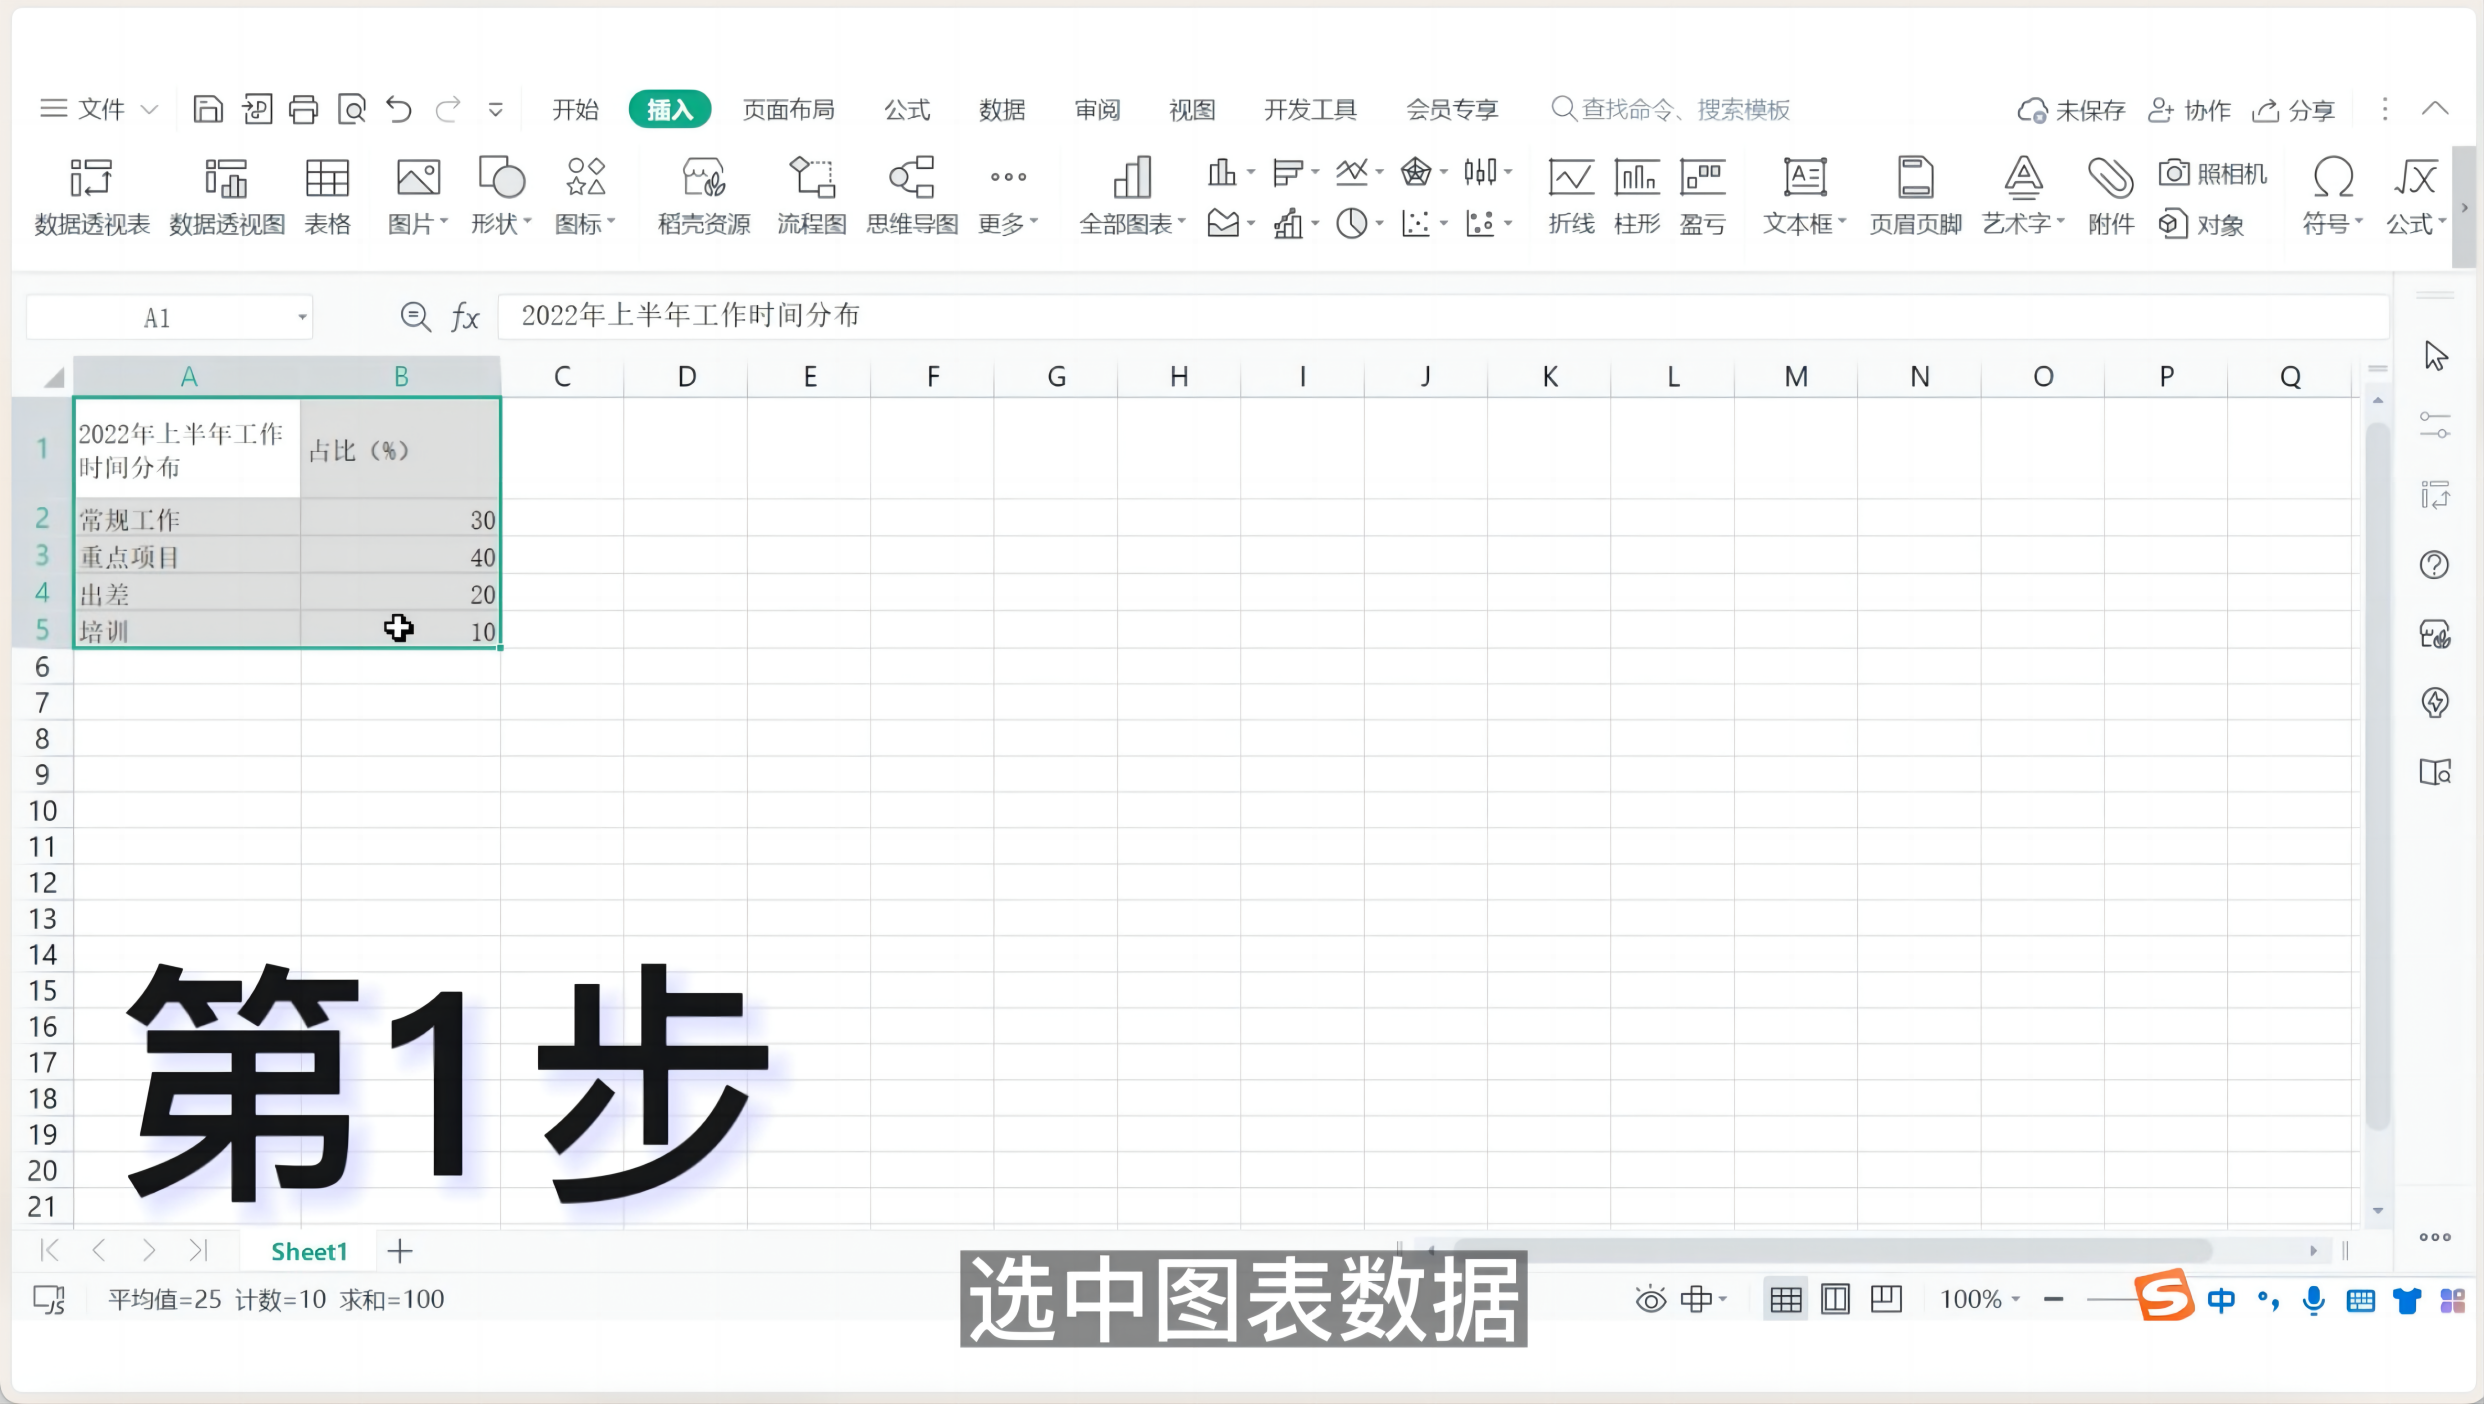### Step 2: Insert dynamic chart Next, you need to find in WPS "Insert" function, click "All Charts" and then select "Dynamic Charts". 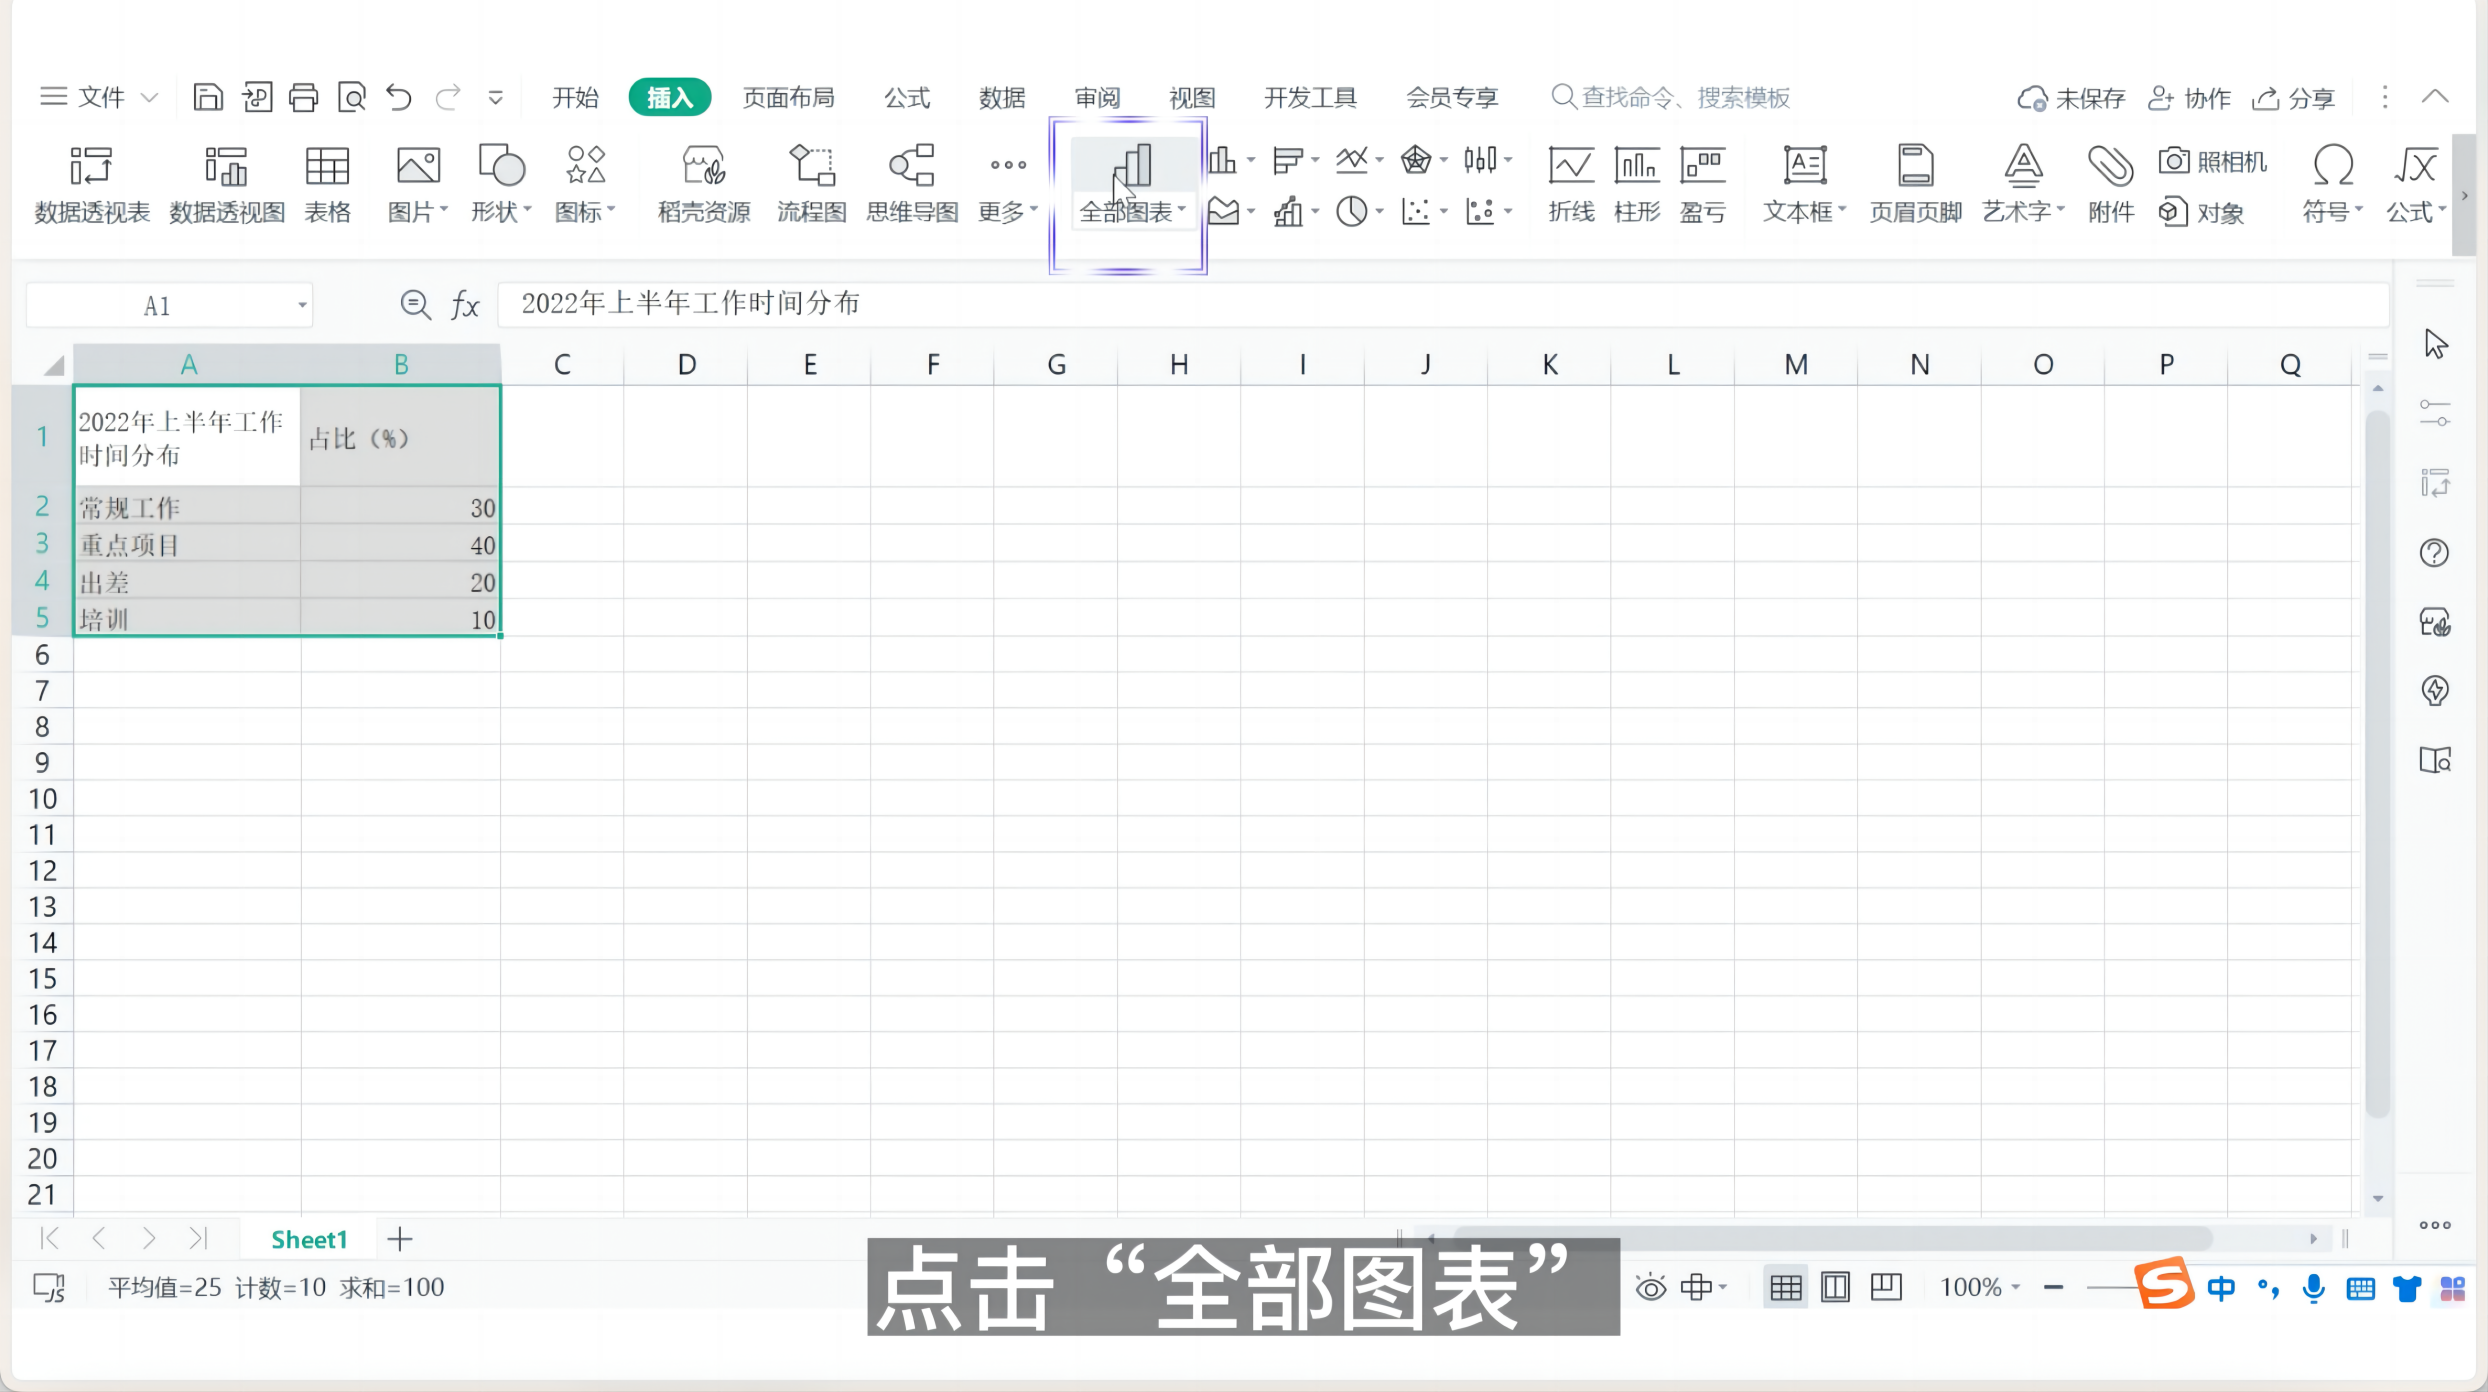Here, we have prepared a wealth of dynamic chart templates for you, you can choose according to your needs Suitable chart type. 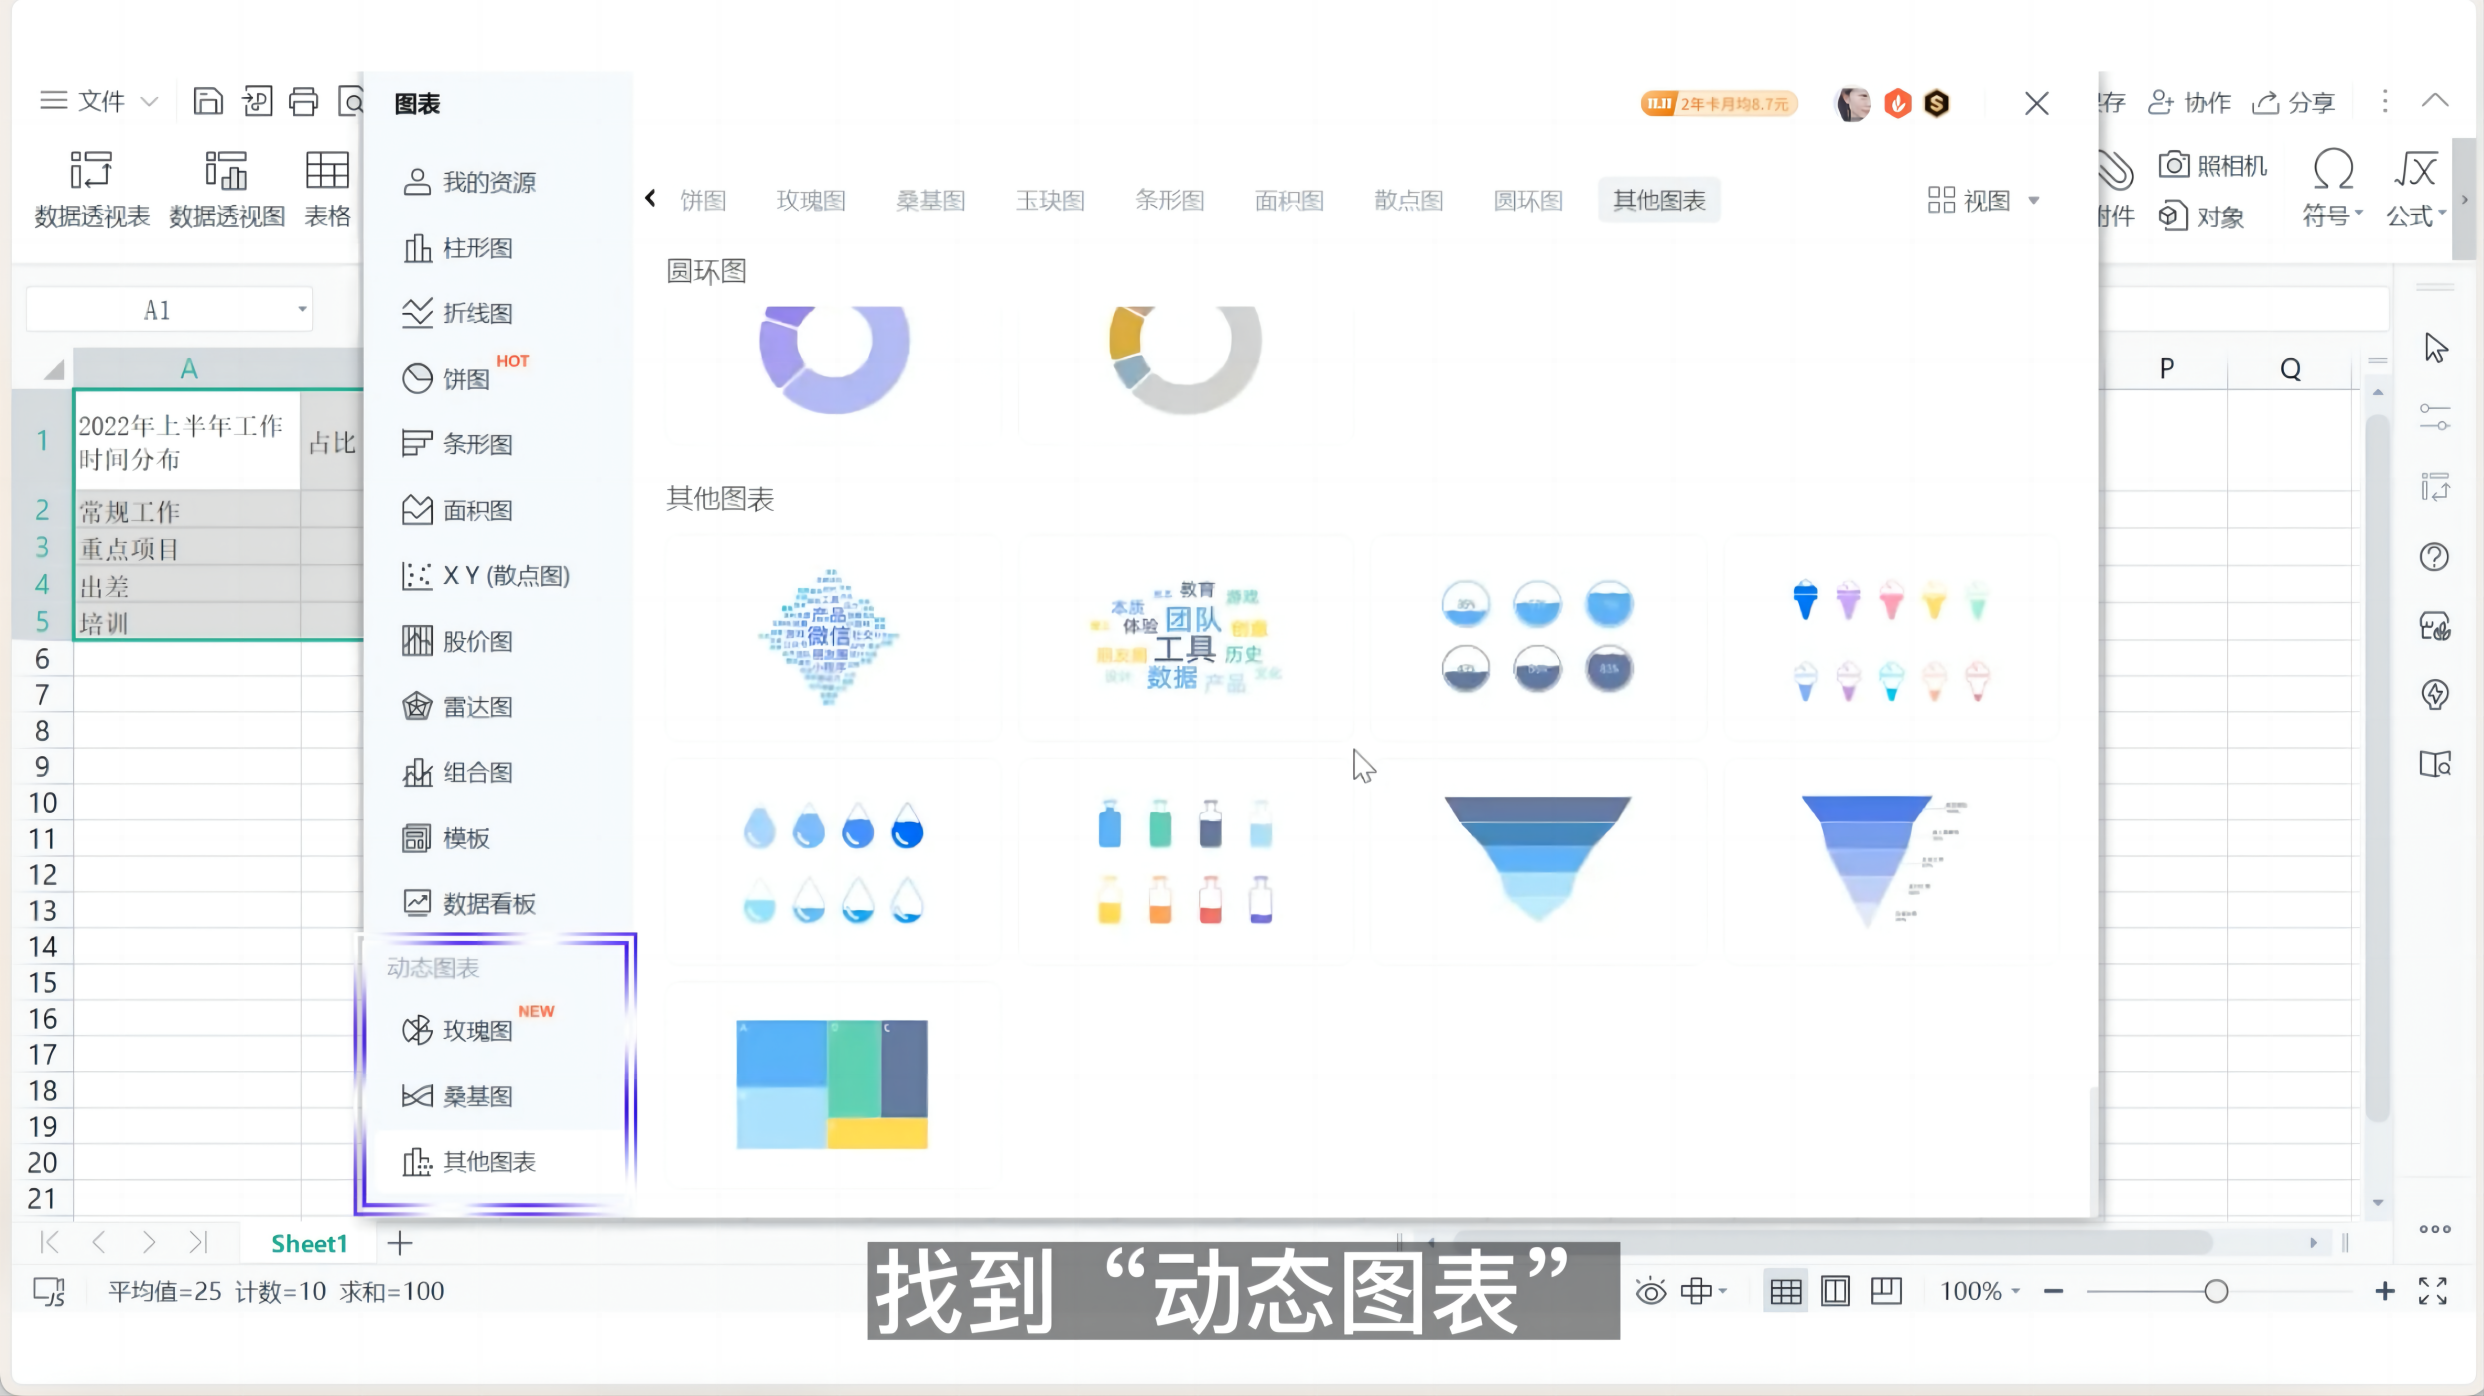### Step 3: Edit the chart After selecting the chart you want, click " Edit" button to enter the chart editing area. Here you can edit the chart title and adjust the title's font size, color, and position. 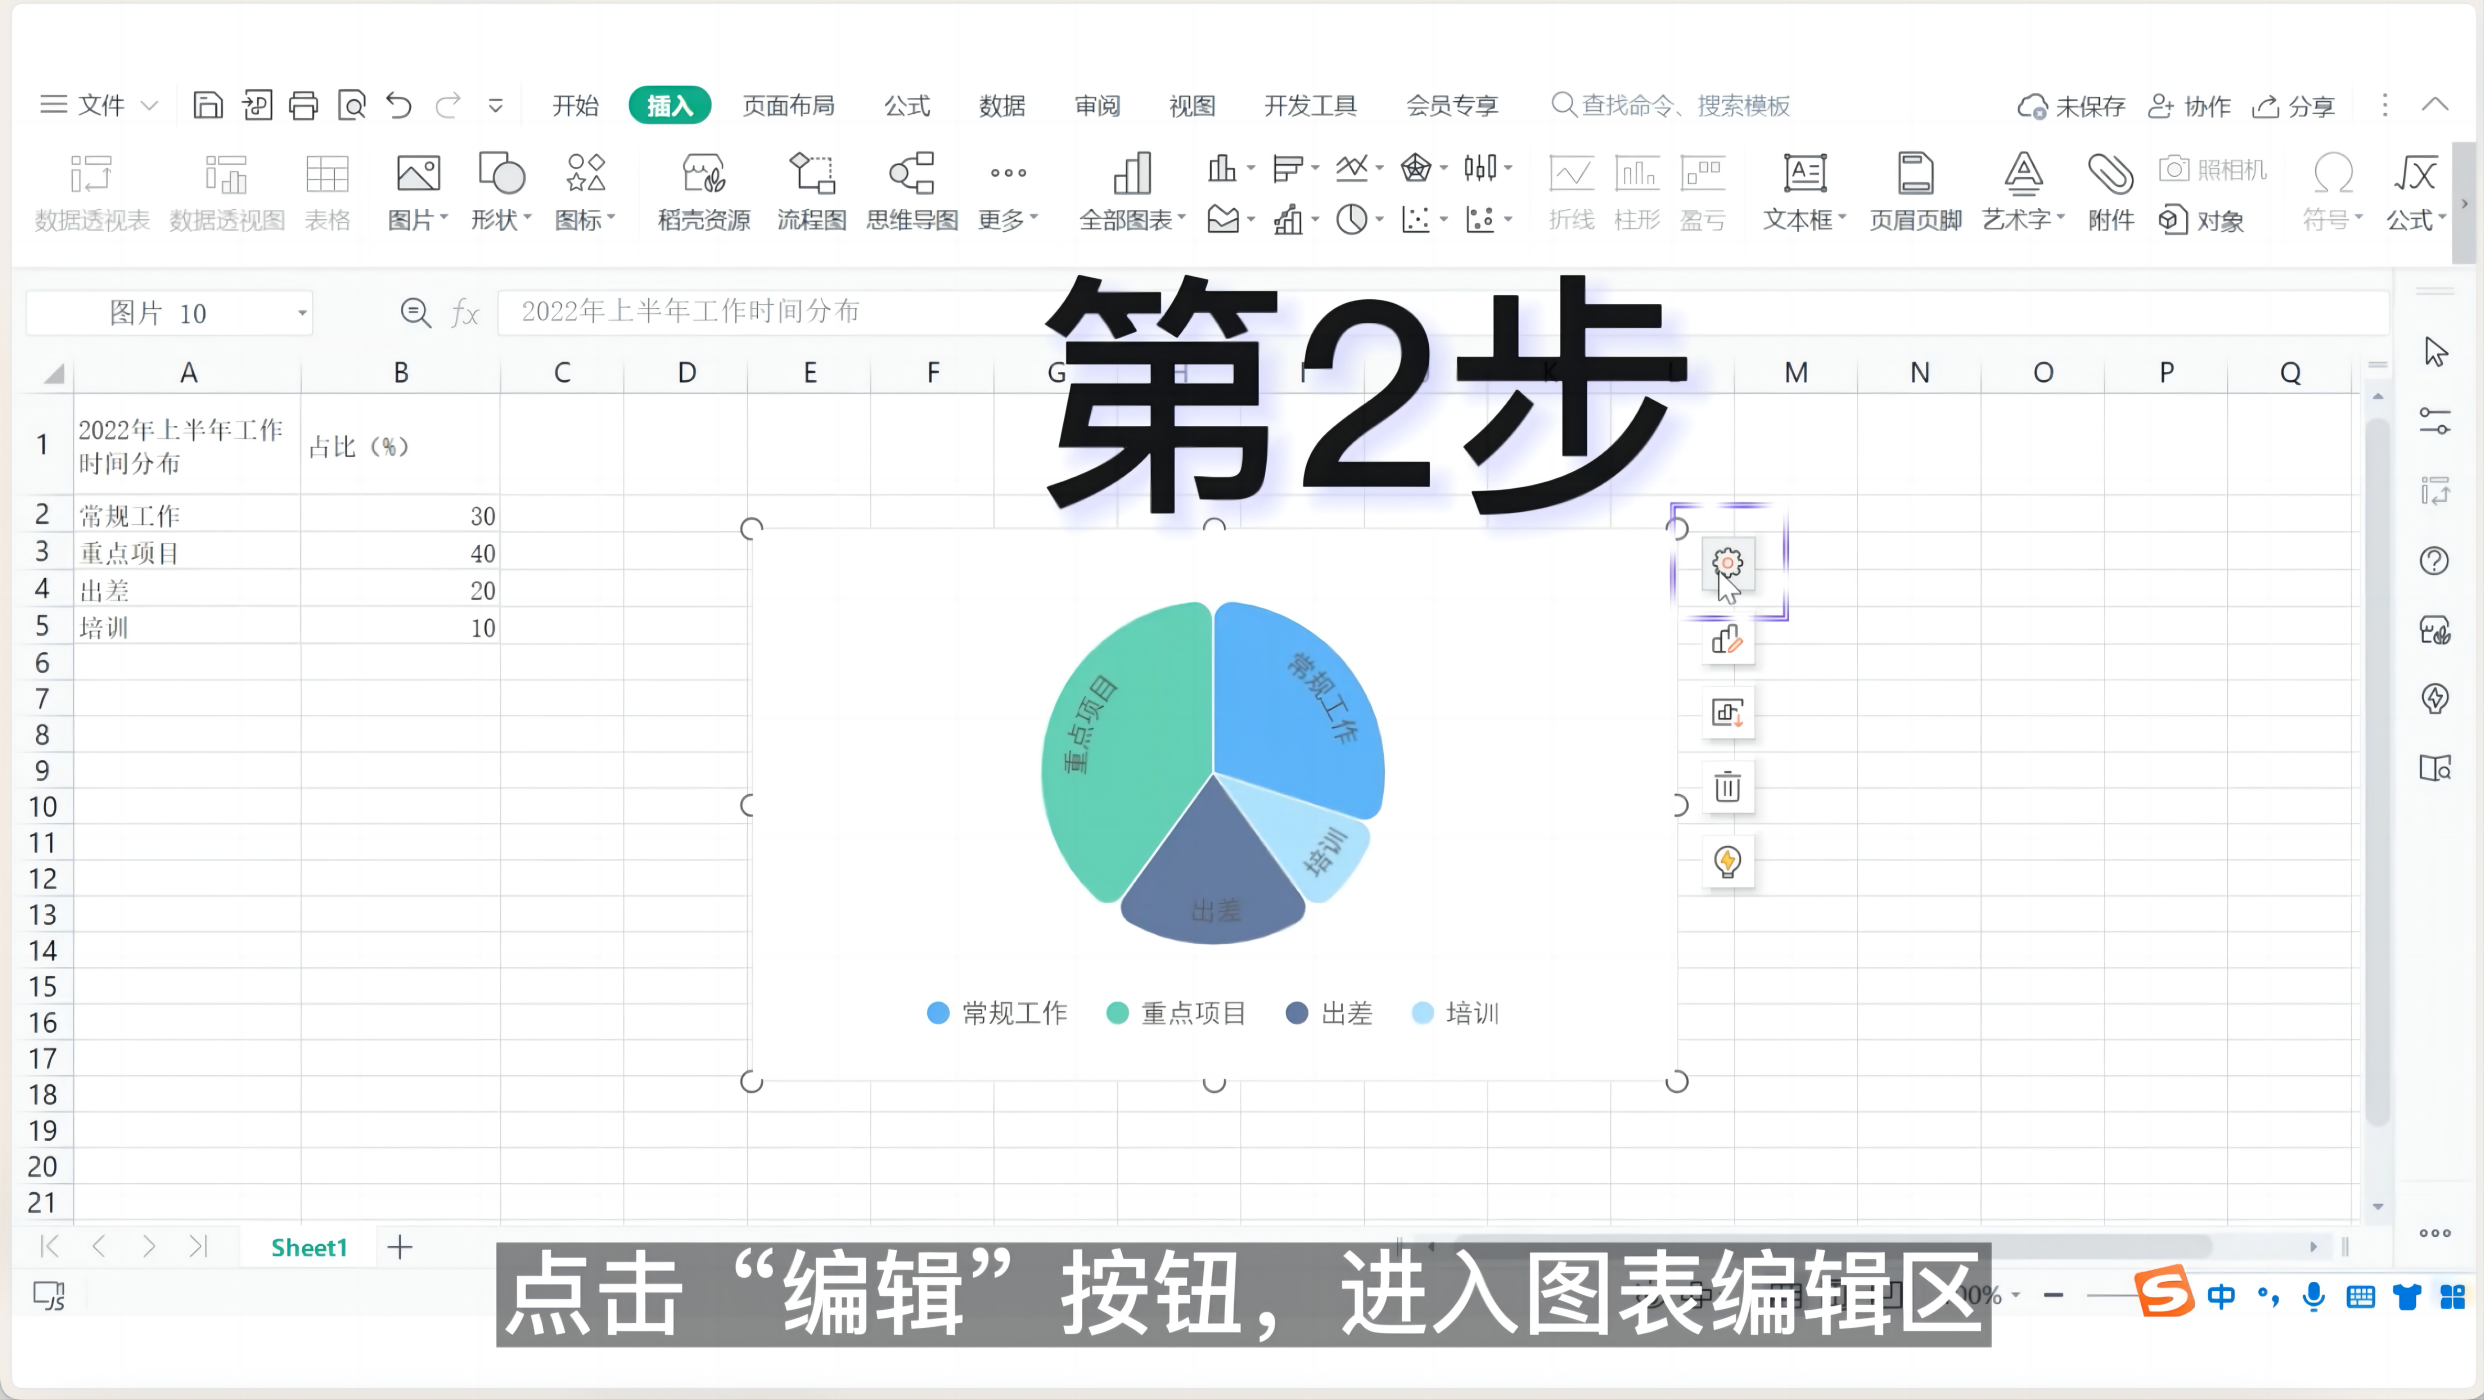### Step 4: Adjust the chart style You can also adjust the color, font and unit of the chart to meet your personalized visual needs. In "Color Scheme", we provide a large number of exquisite color cards, you can beautify your charts with one click. 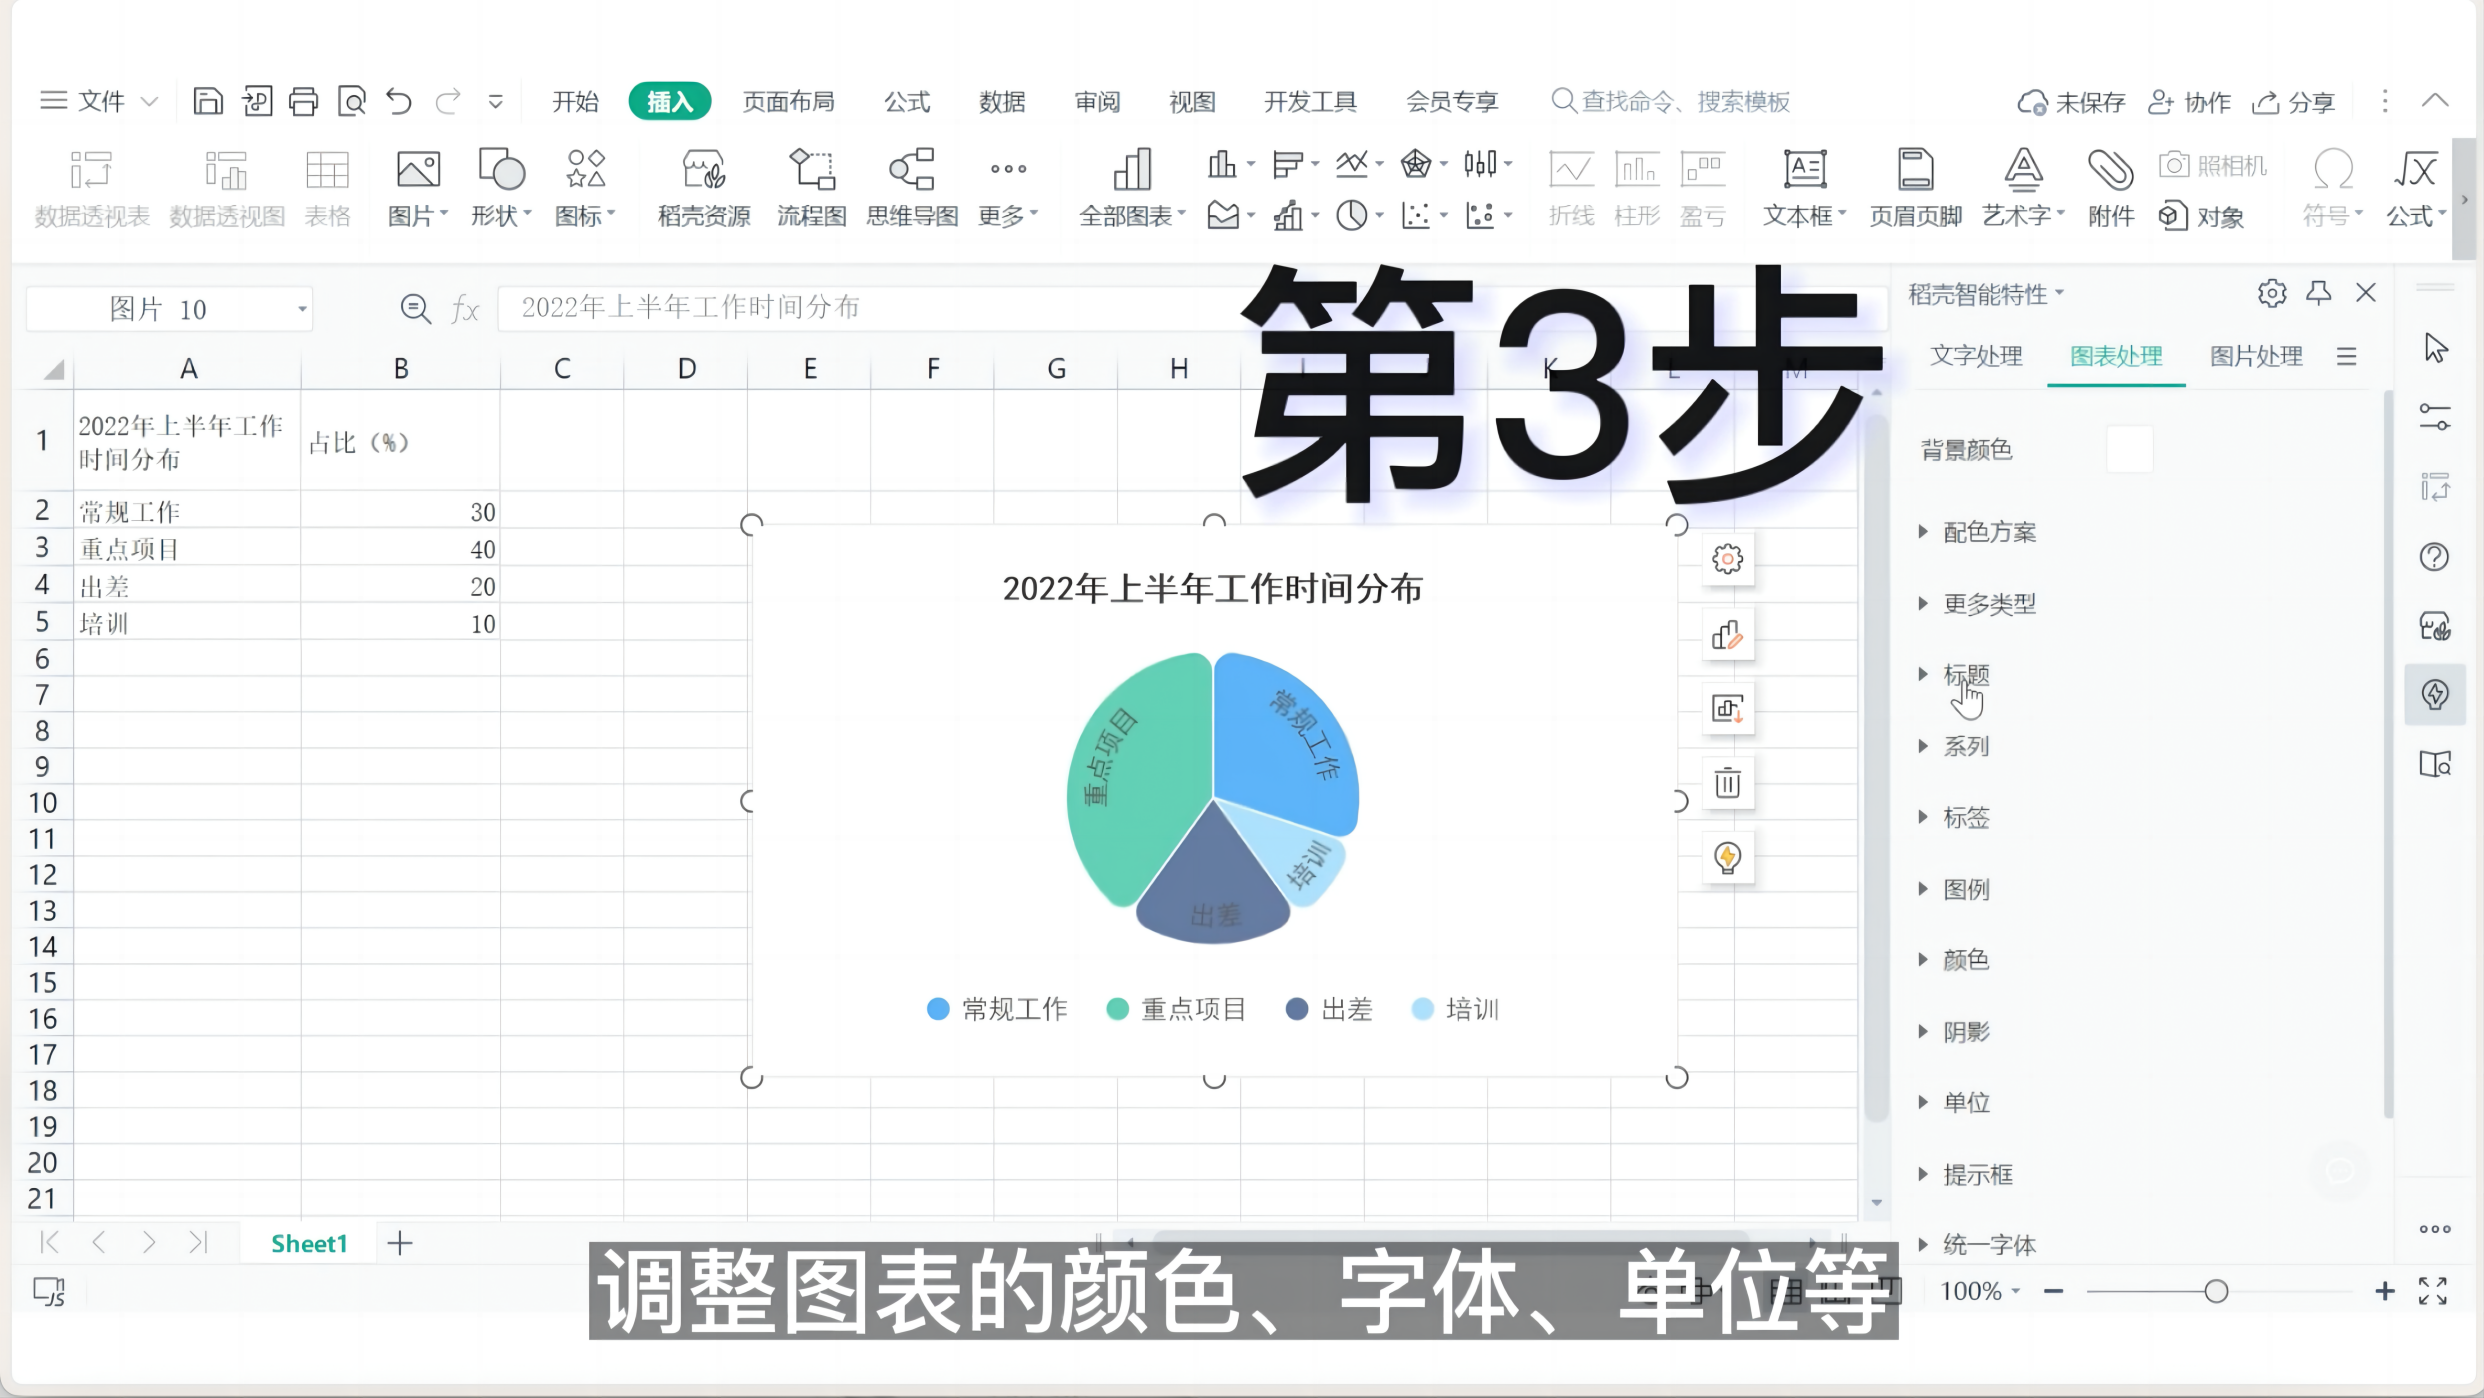 You can also choose a chart color that matches the document according to your own preferences. 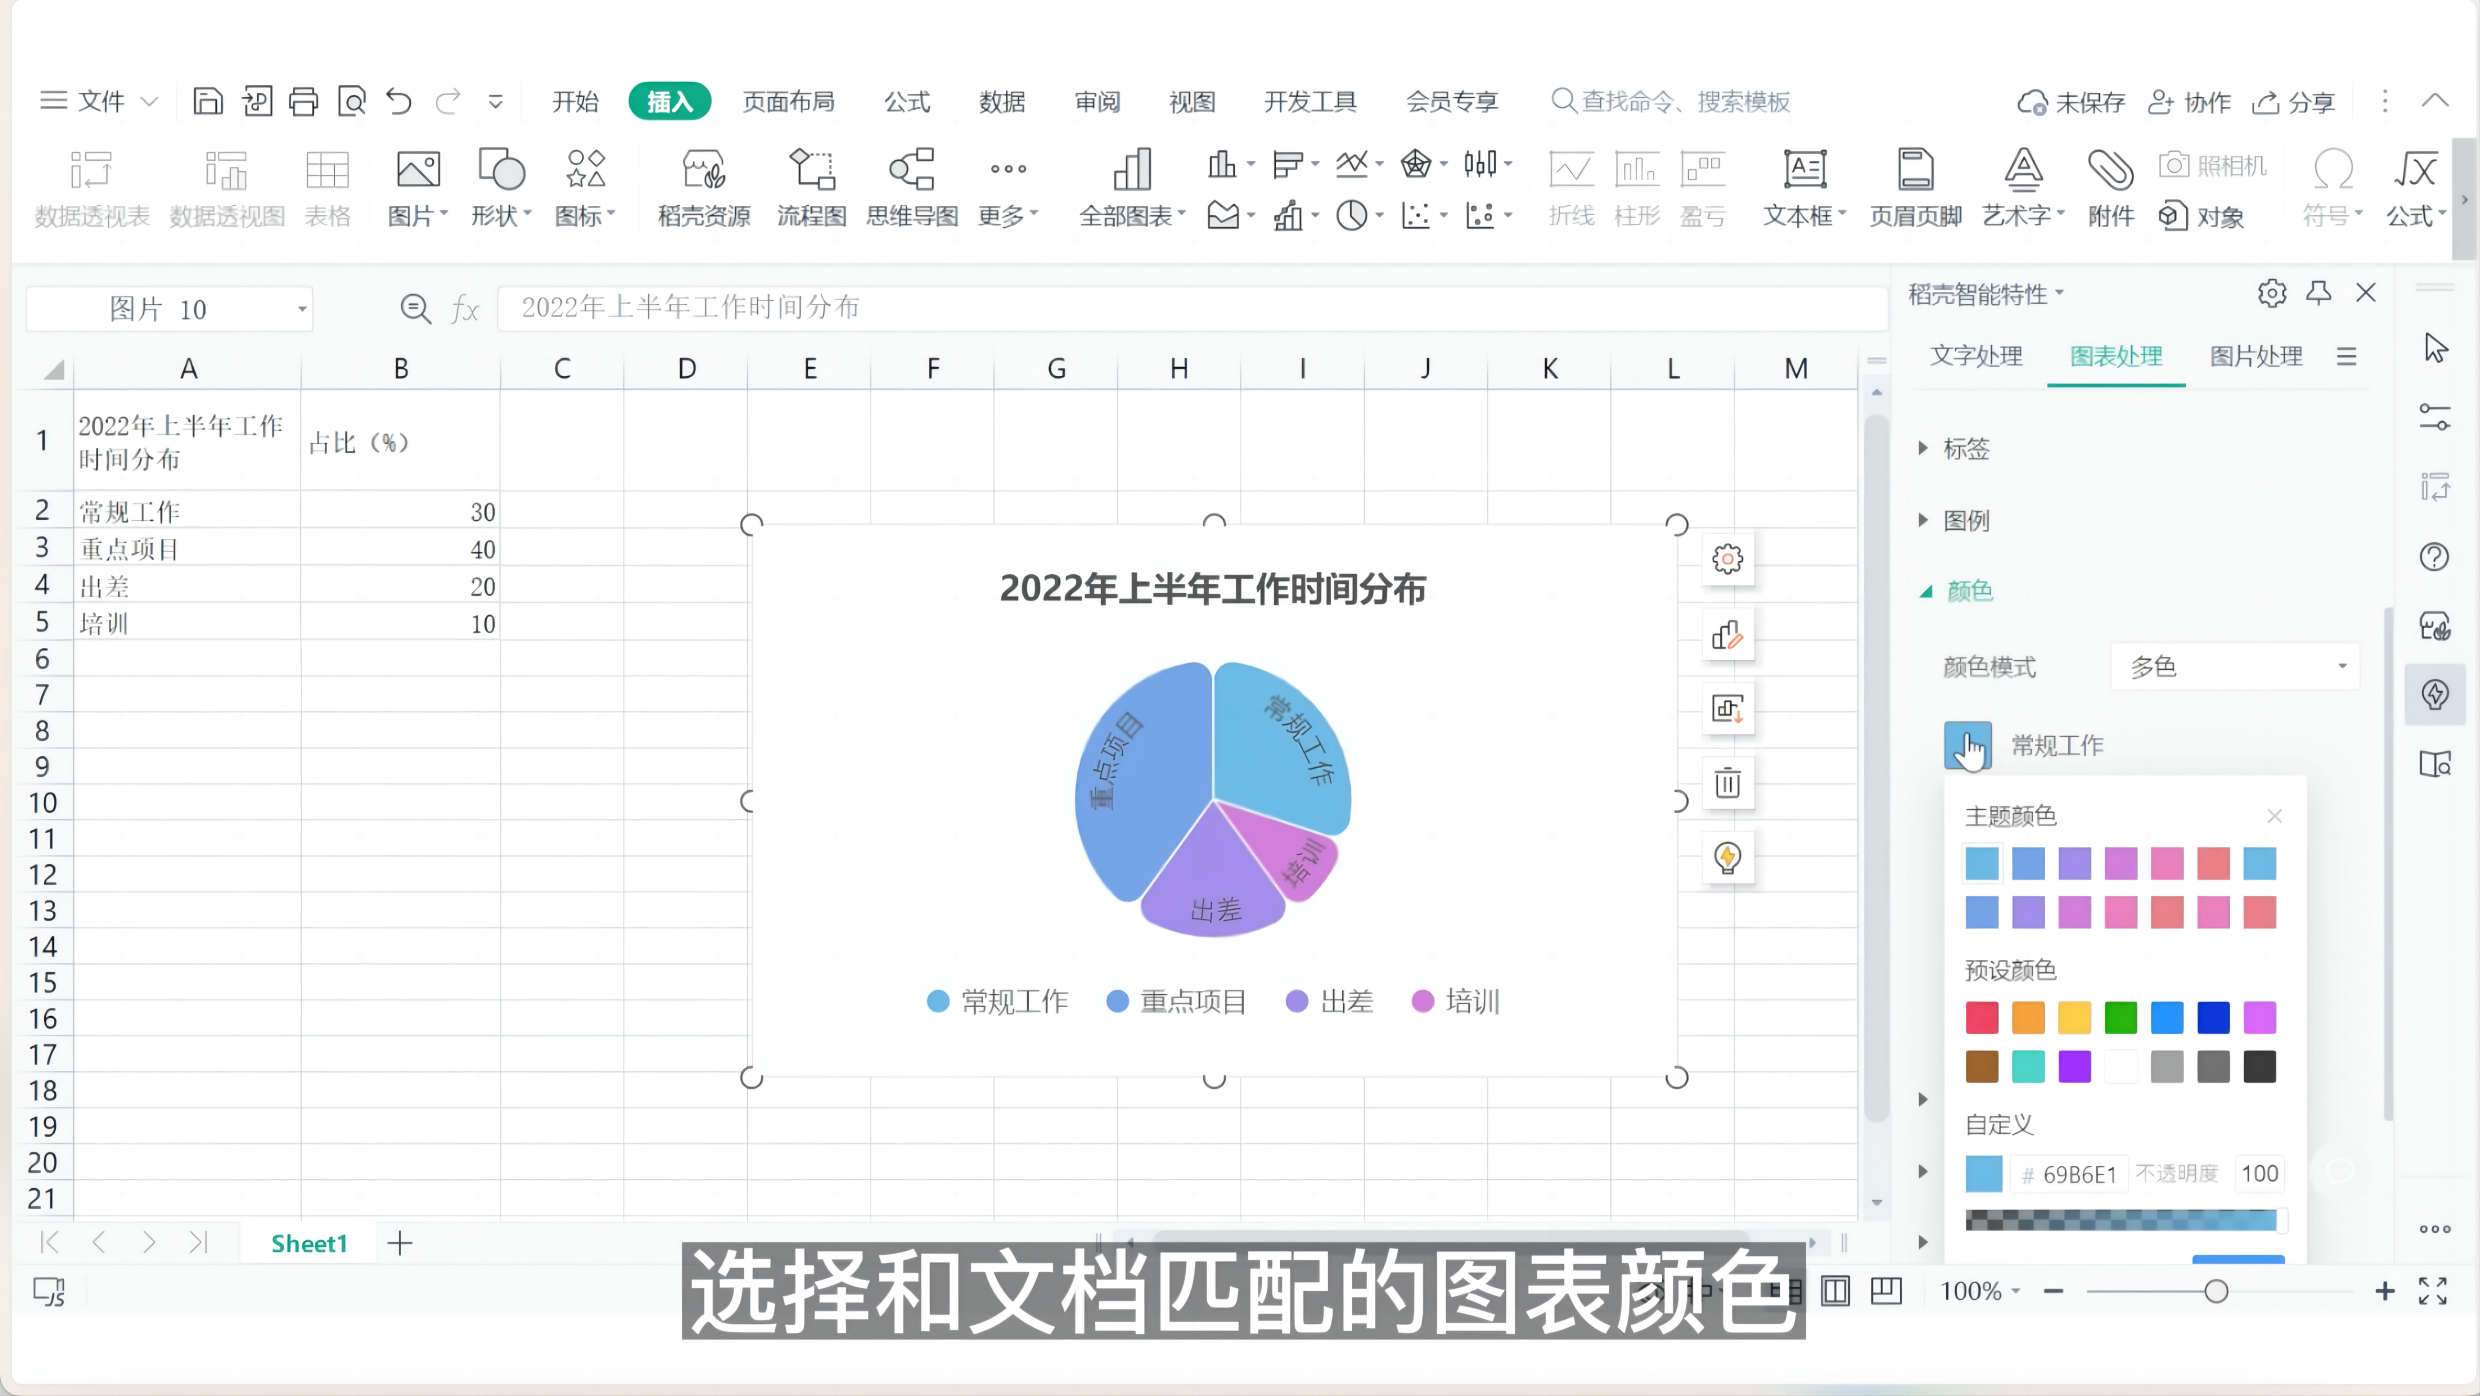 Finally, you can further adjust the labels, legends and other details. 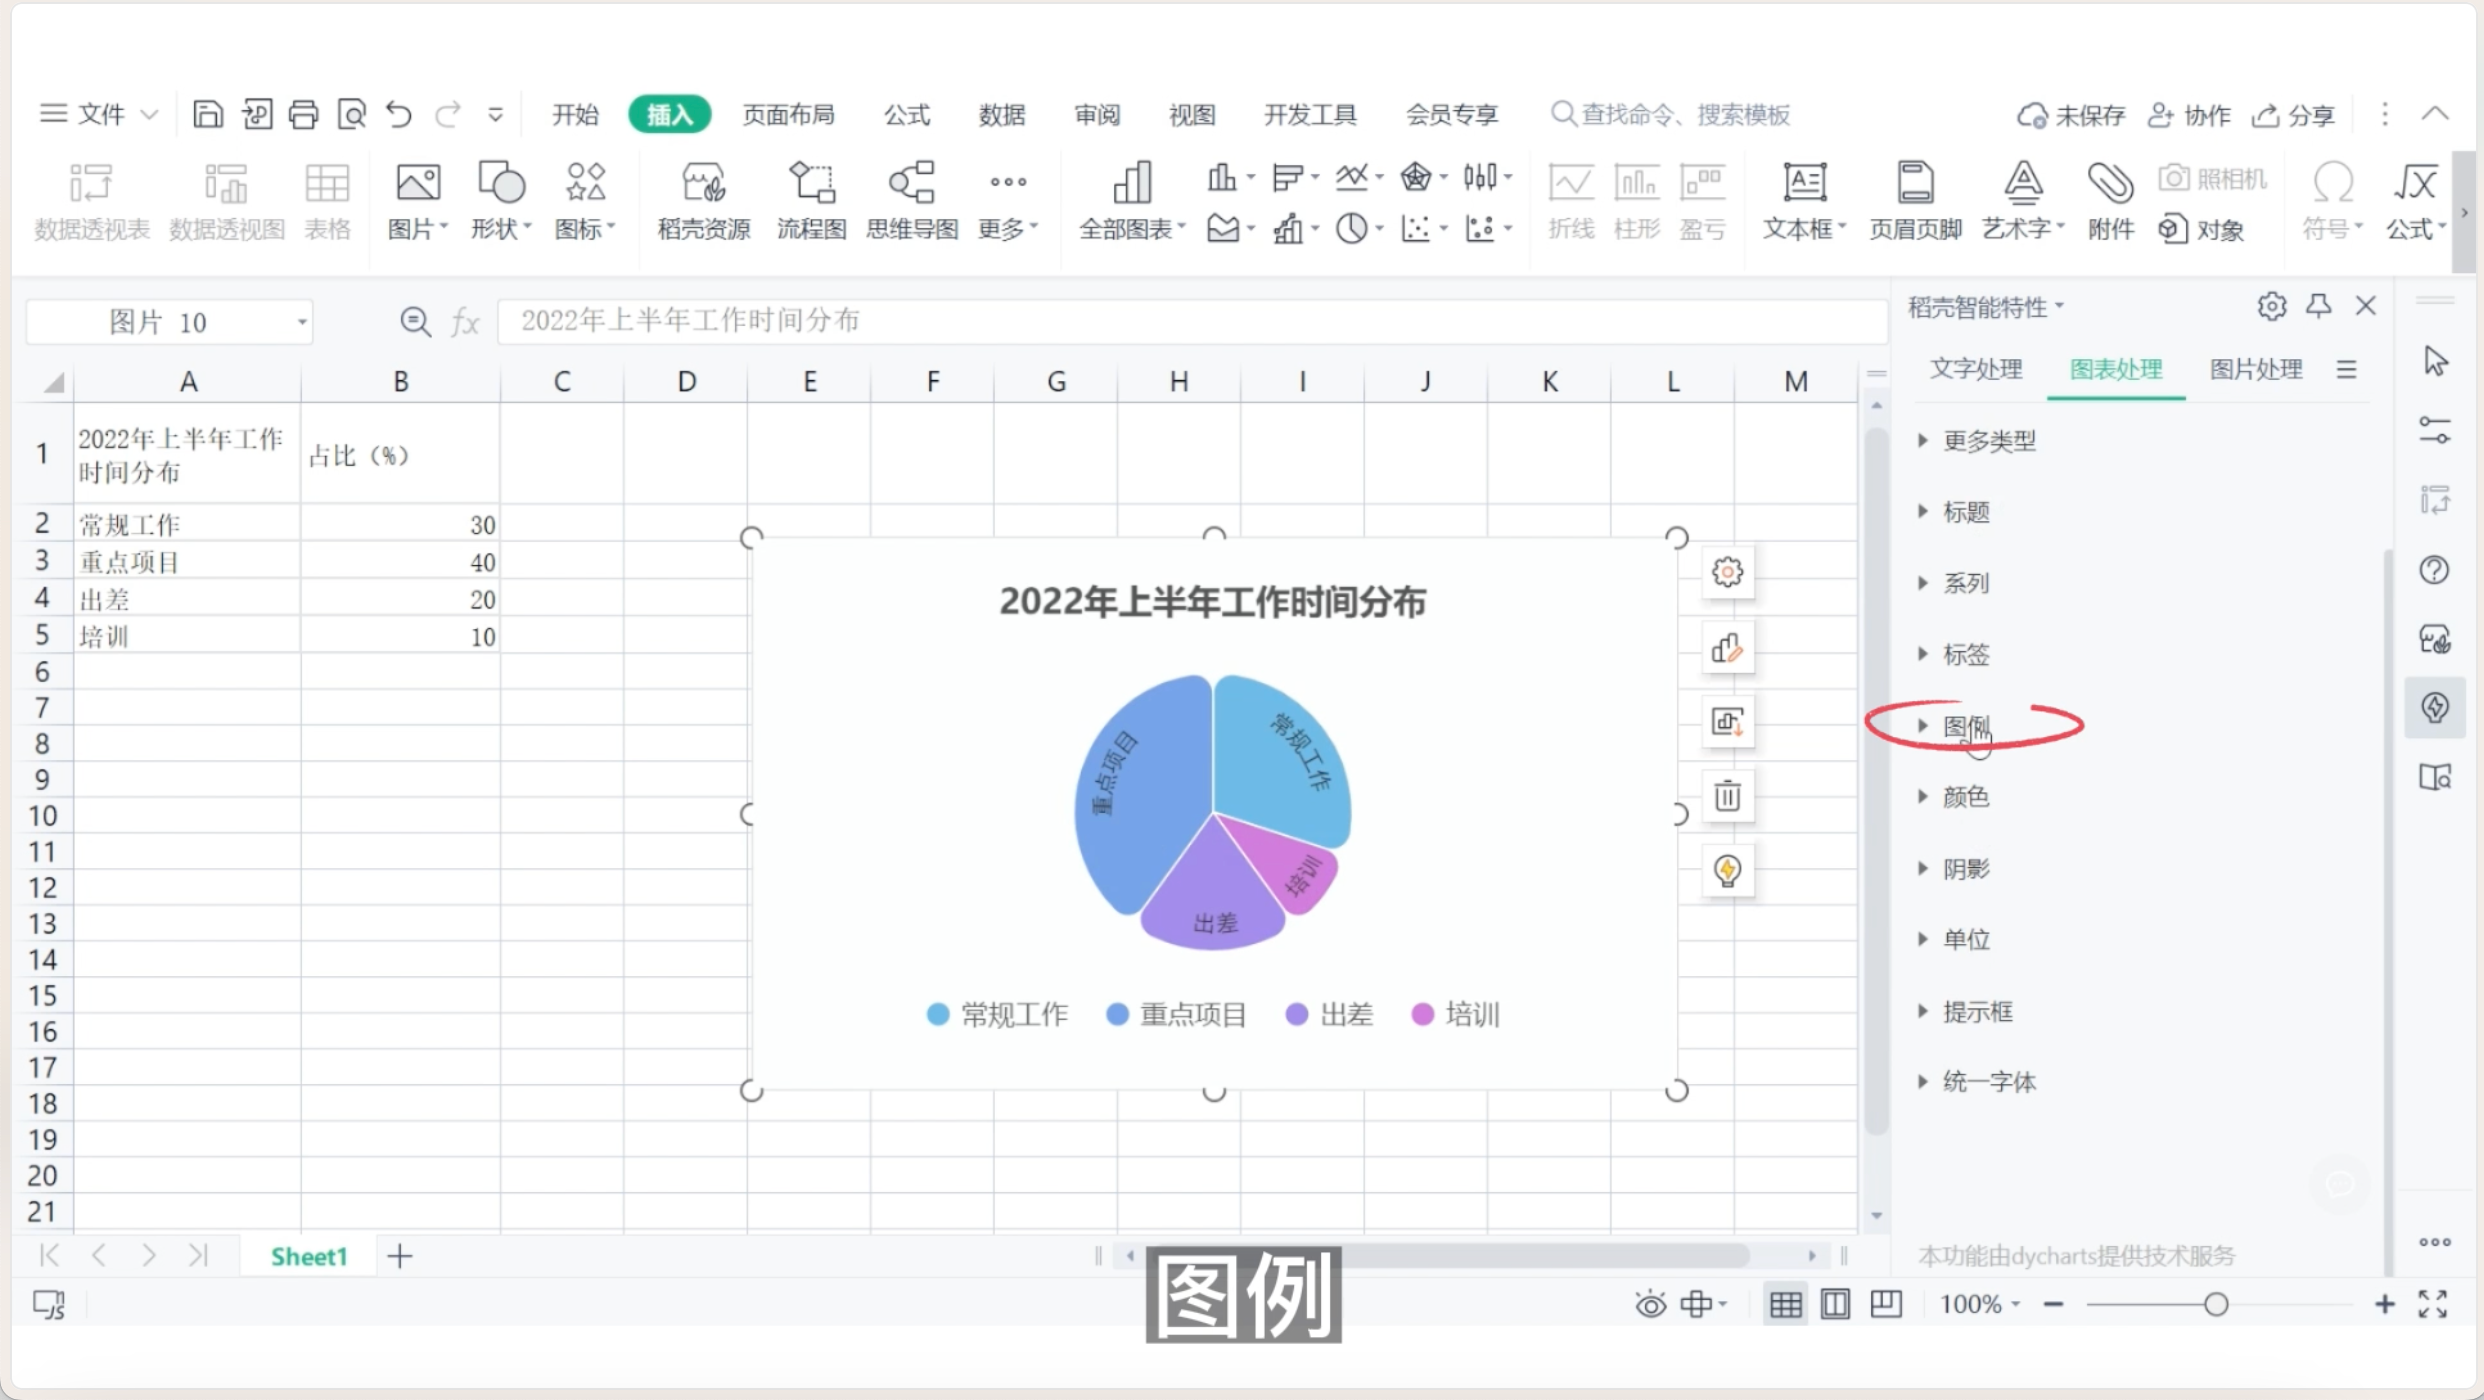 After all settings are completed, select "Uniform Font", so that a professional and attractive The force dynamic chart is now created. 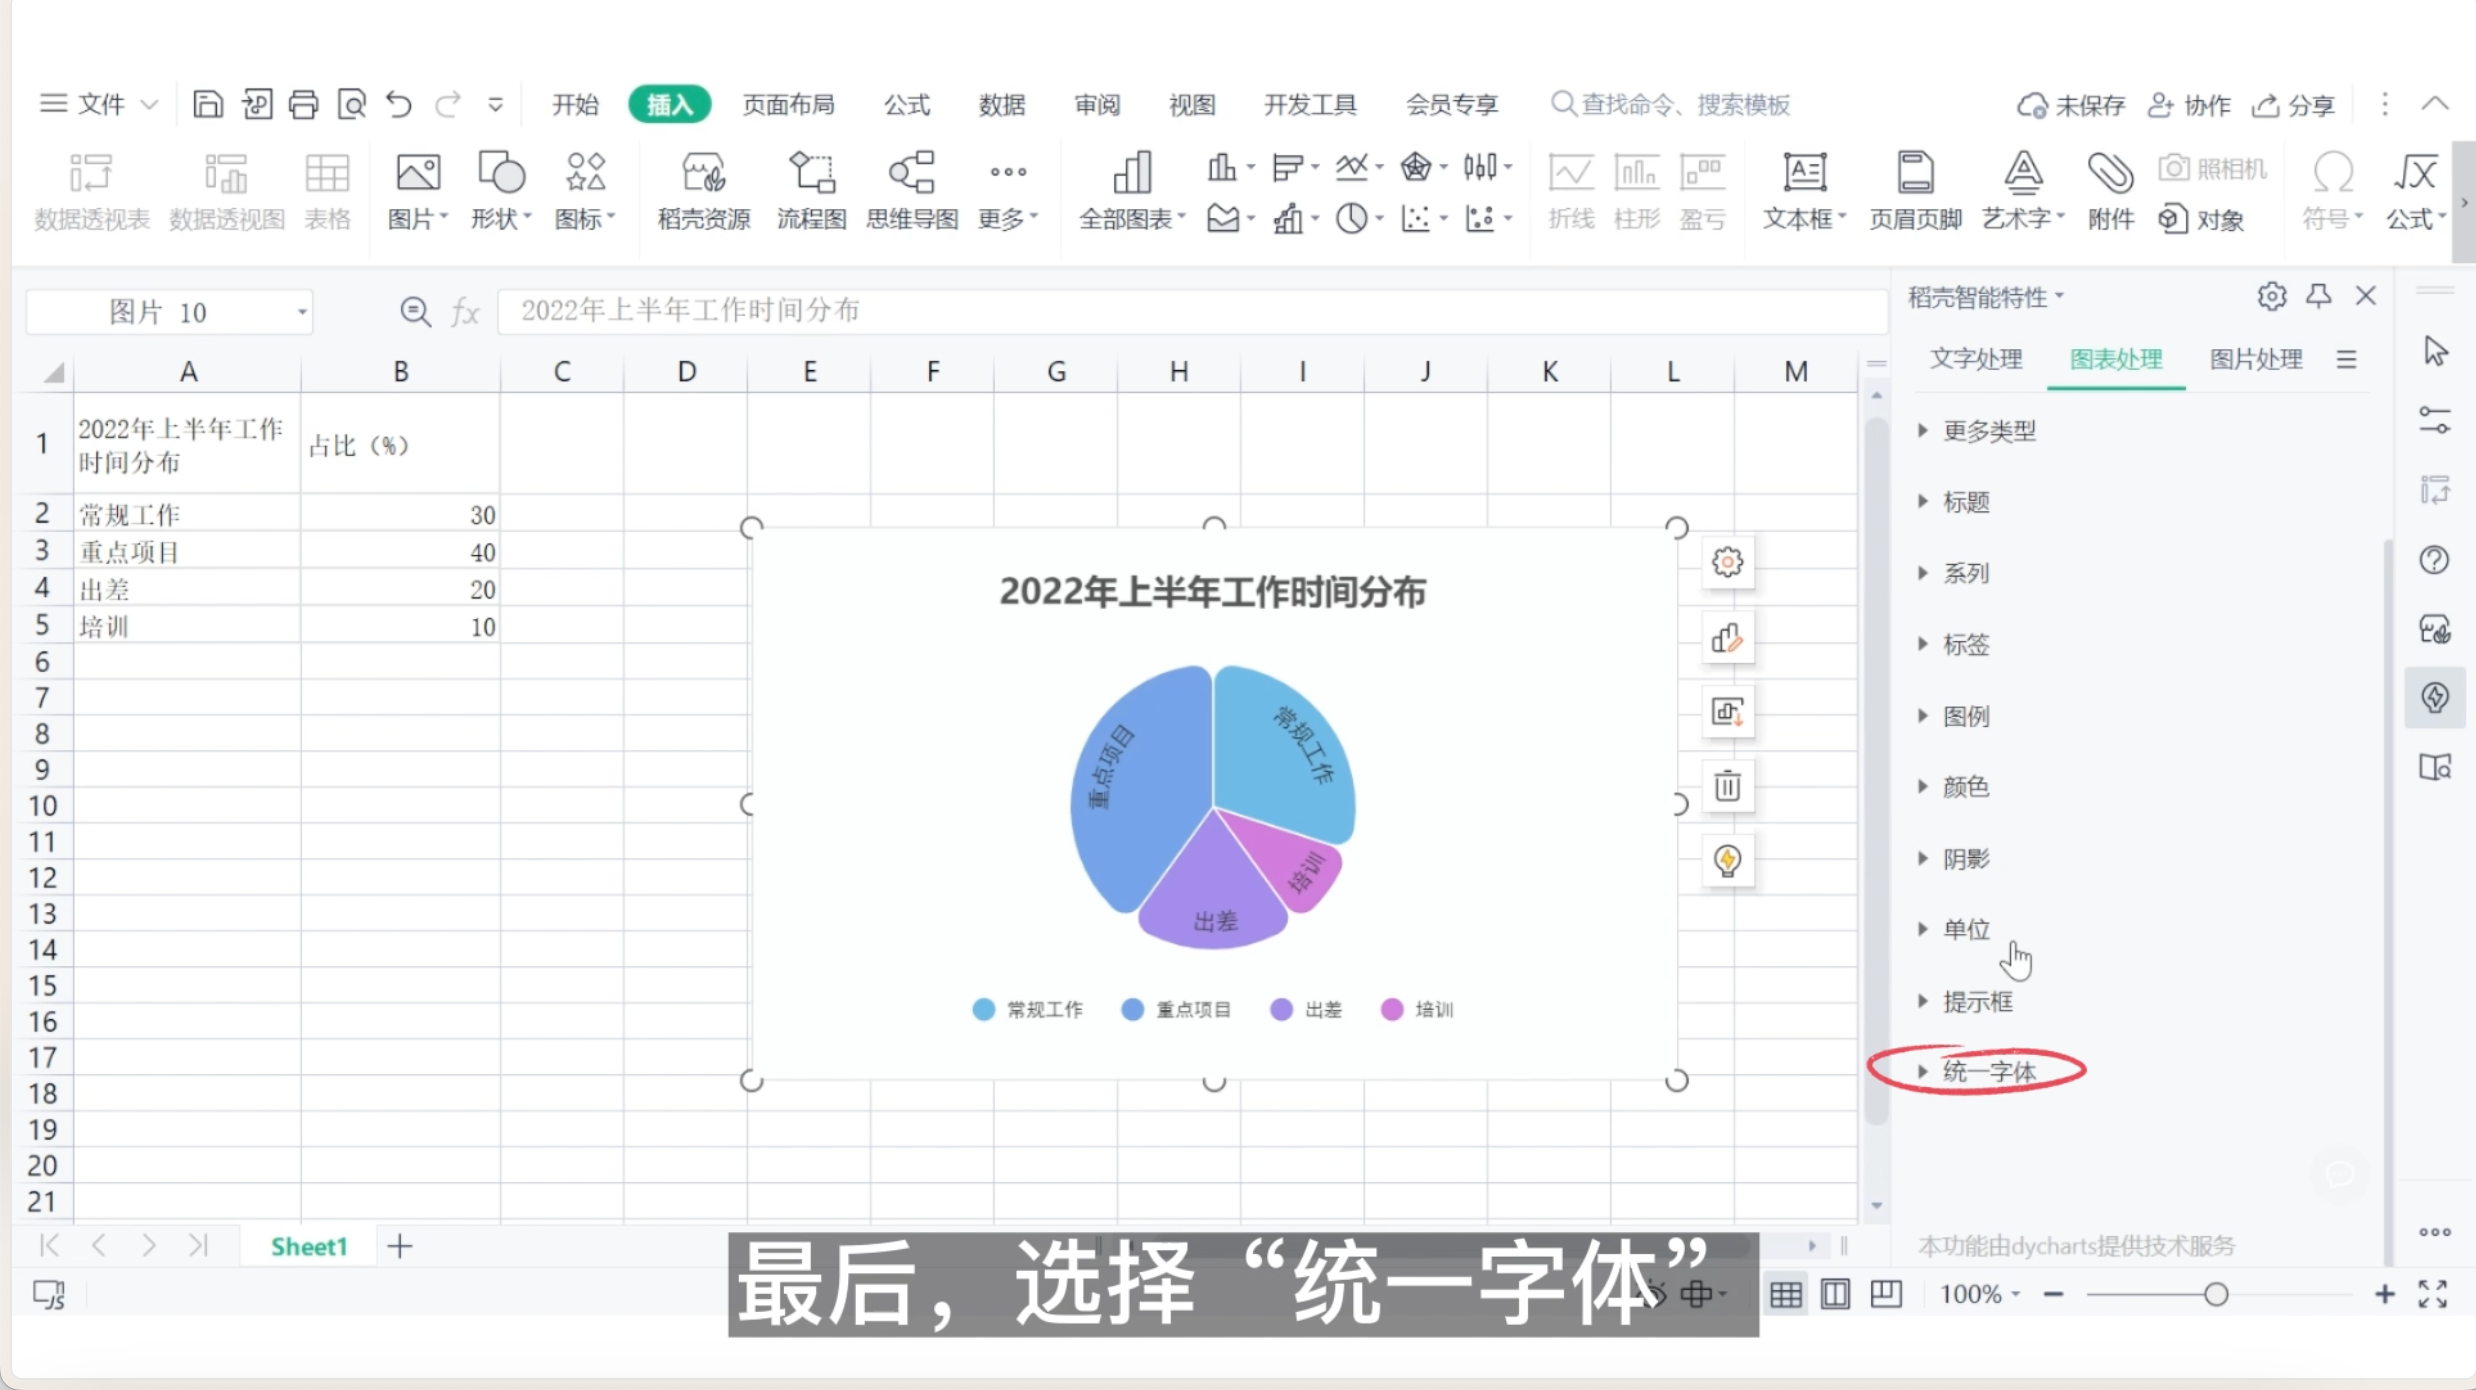 Dynamic charts come with cool interactive effects, making your data display more vivid and interesting. Come and experience it now! 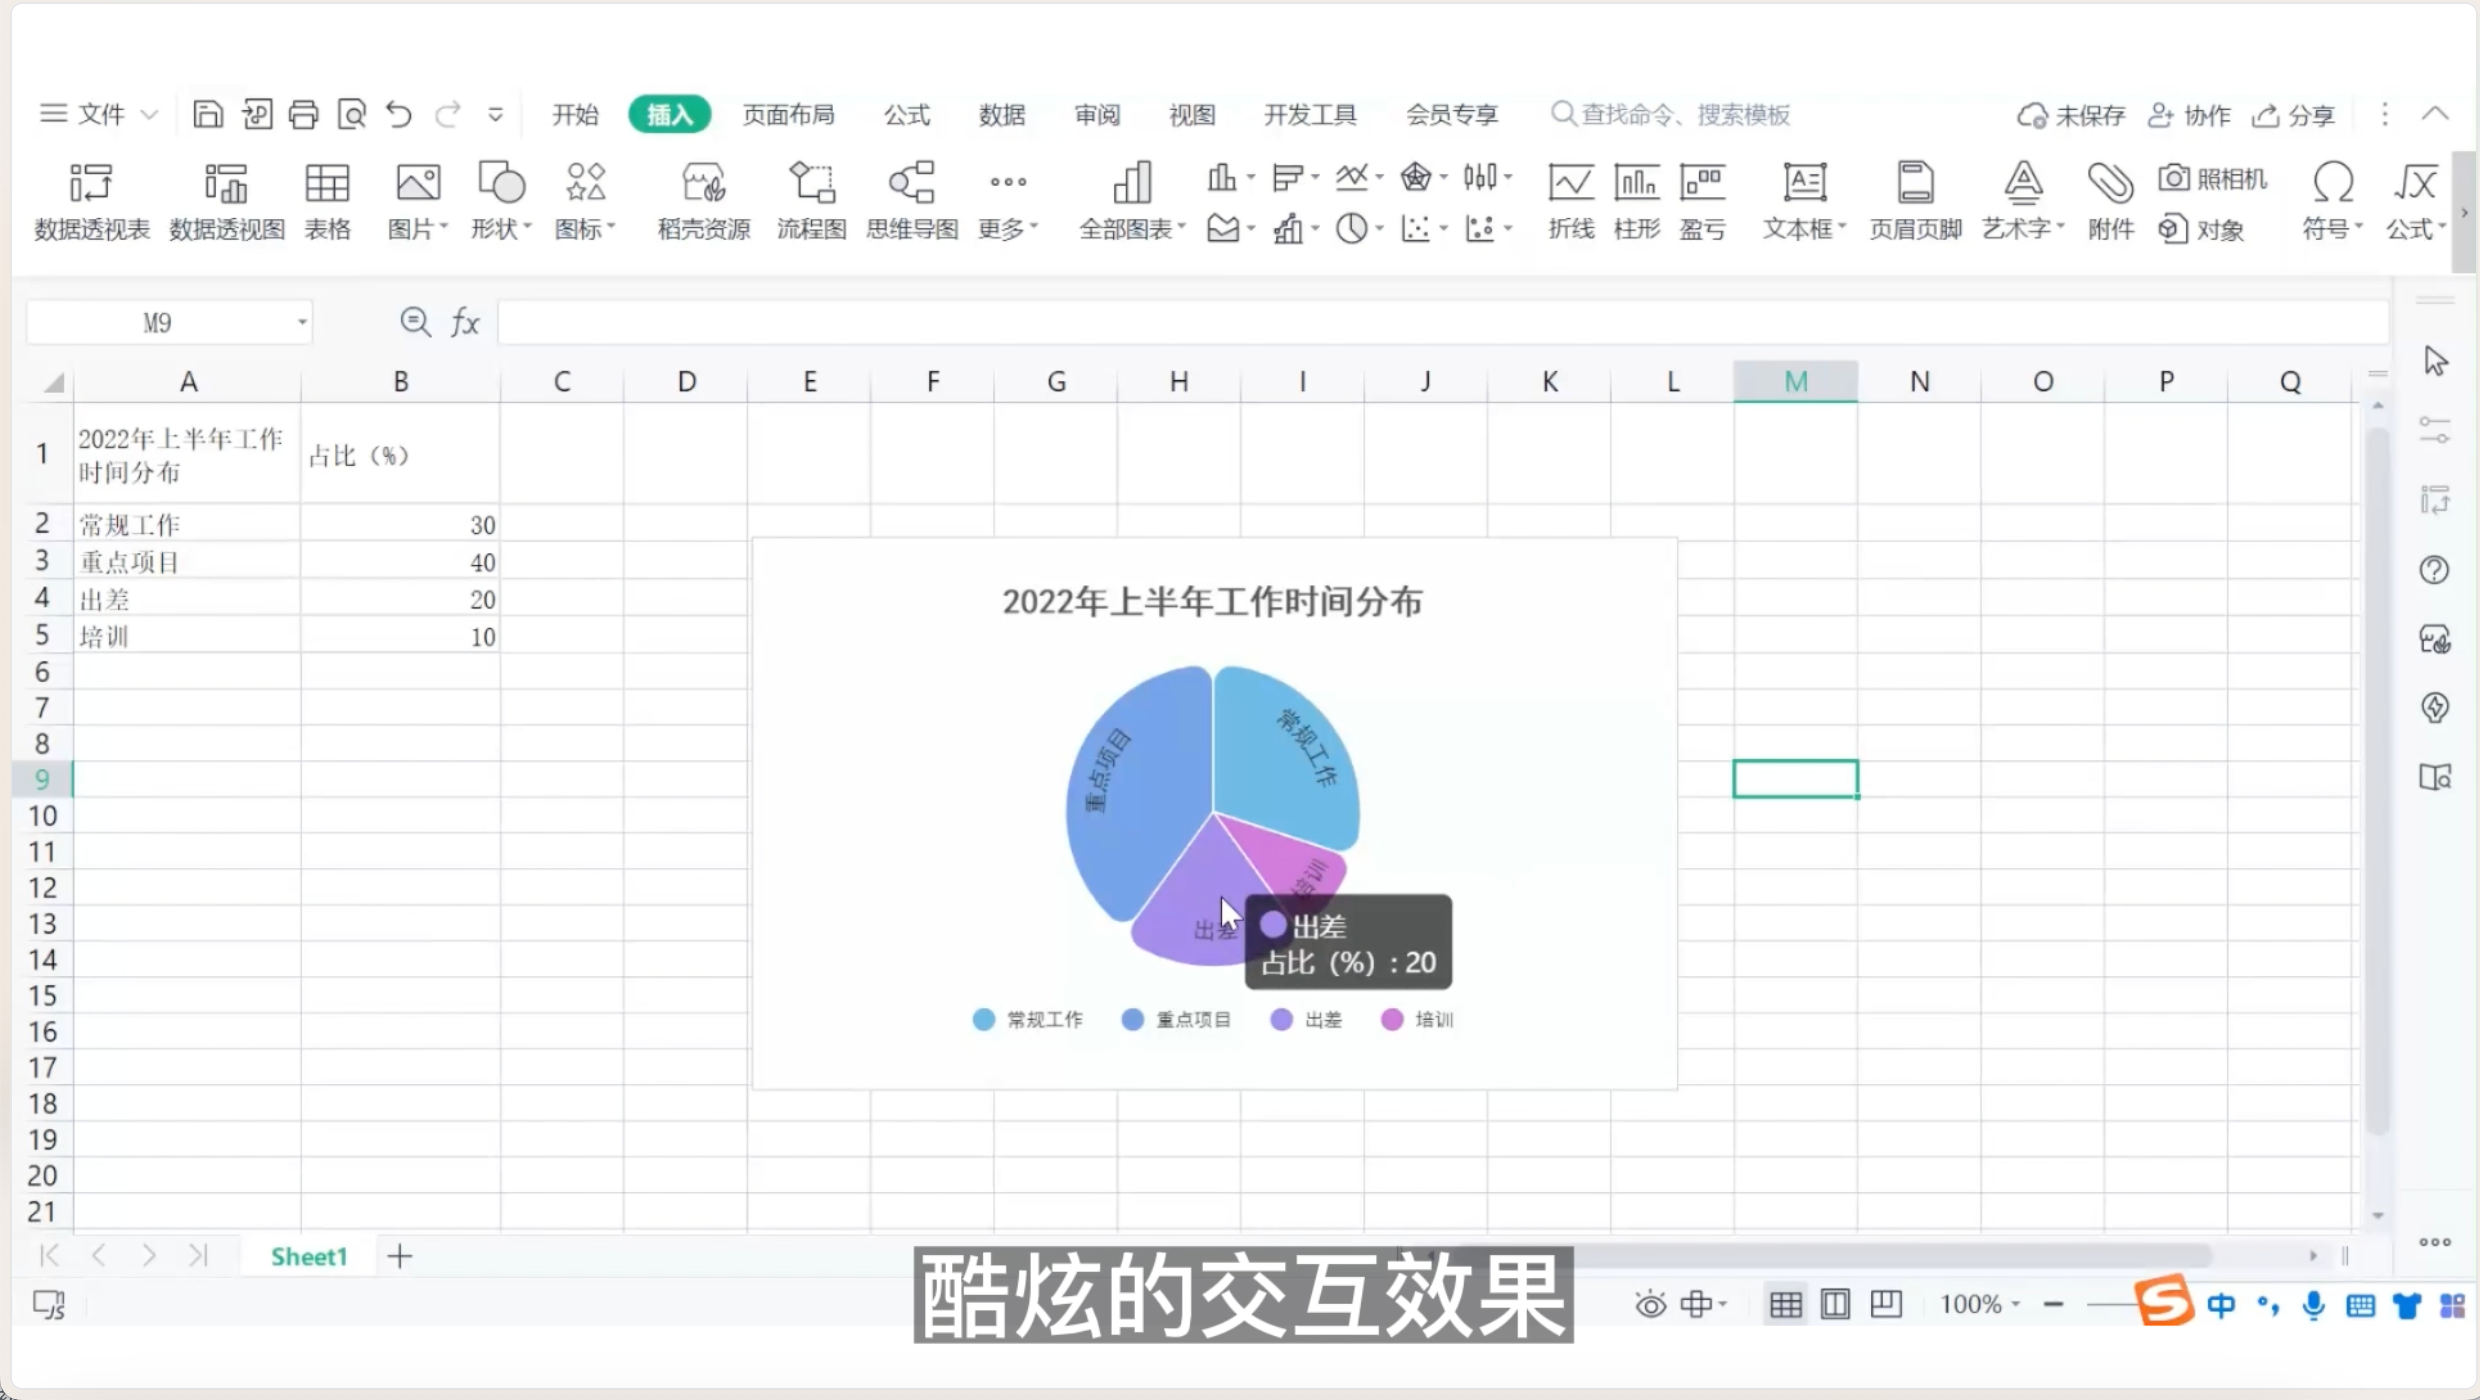 Start your data visualization journey, let us explore the infinite possibilities of data together!
Like (810)
Reward
 支付宝扫一扫
支付宝扫一扫

Related Suggestion
-
New version: PPT scientific research drawing complete guide and material collection
New version: PPT scientific research drawing complete guide and material collection
-
The most complete PPT scientific research drawing tutorial and materials in history (second edition)
The most complete PPT scientific research drawing tutorial and materials in history (second edition)
-
[Navigation] PPT scientific research illustration drawing tutorial list
[Navigation] PPT scientific research illustration drawing tutorial list
-
"Guidelines for Making Scientific Research PPT Illustrations"
"Guidelines for Making Scientific Research PPT Illustrations"
-
"Practical Guide: Scientific Research Graphics Drawing Techniques in PPT Presentations (Issue 008) - Drawing Light Path Schematics"
"Practical Guide: Scientific Research Graphics Drawing Techniques in PPT Presentations (Issue 008) - Drawing Light Path Schematics"
评论列表(196条)
测试