- Picture and text skills
In the PPT of the final report, there are too many summarized data, which are messy and unorganized. Data visualization can be used to display data more intuitively and quickly. So how to visualize data and integrate it into charts and insert them into reporting PPT?

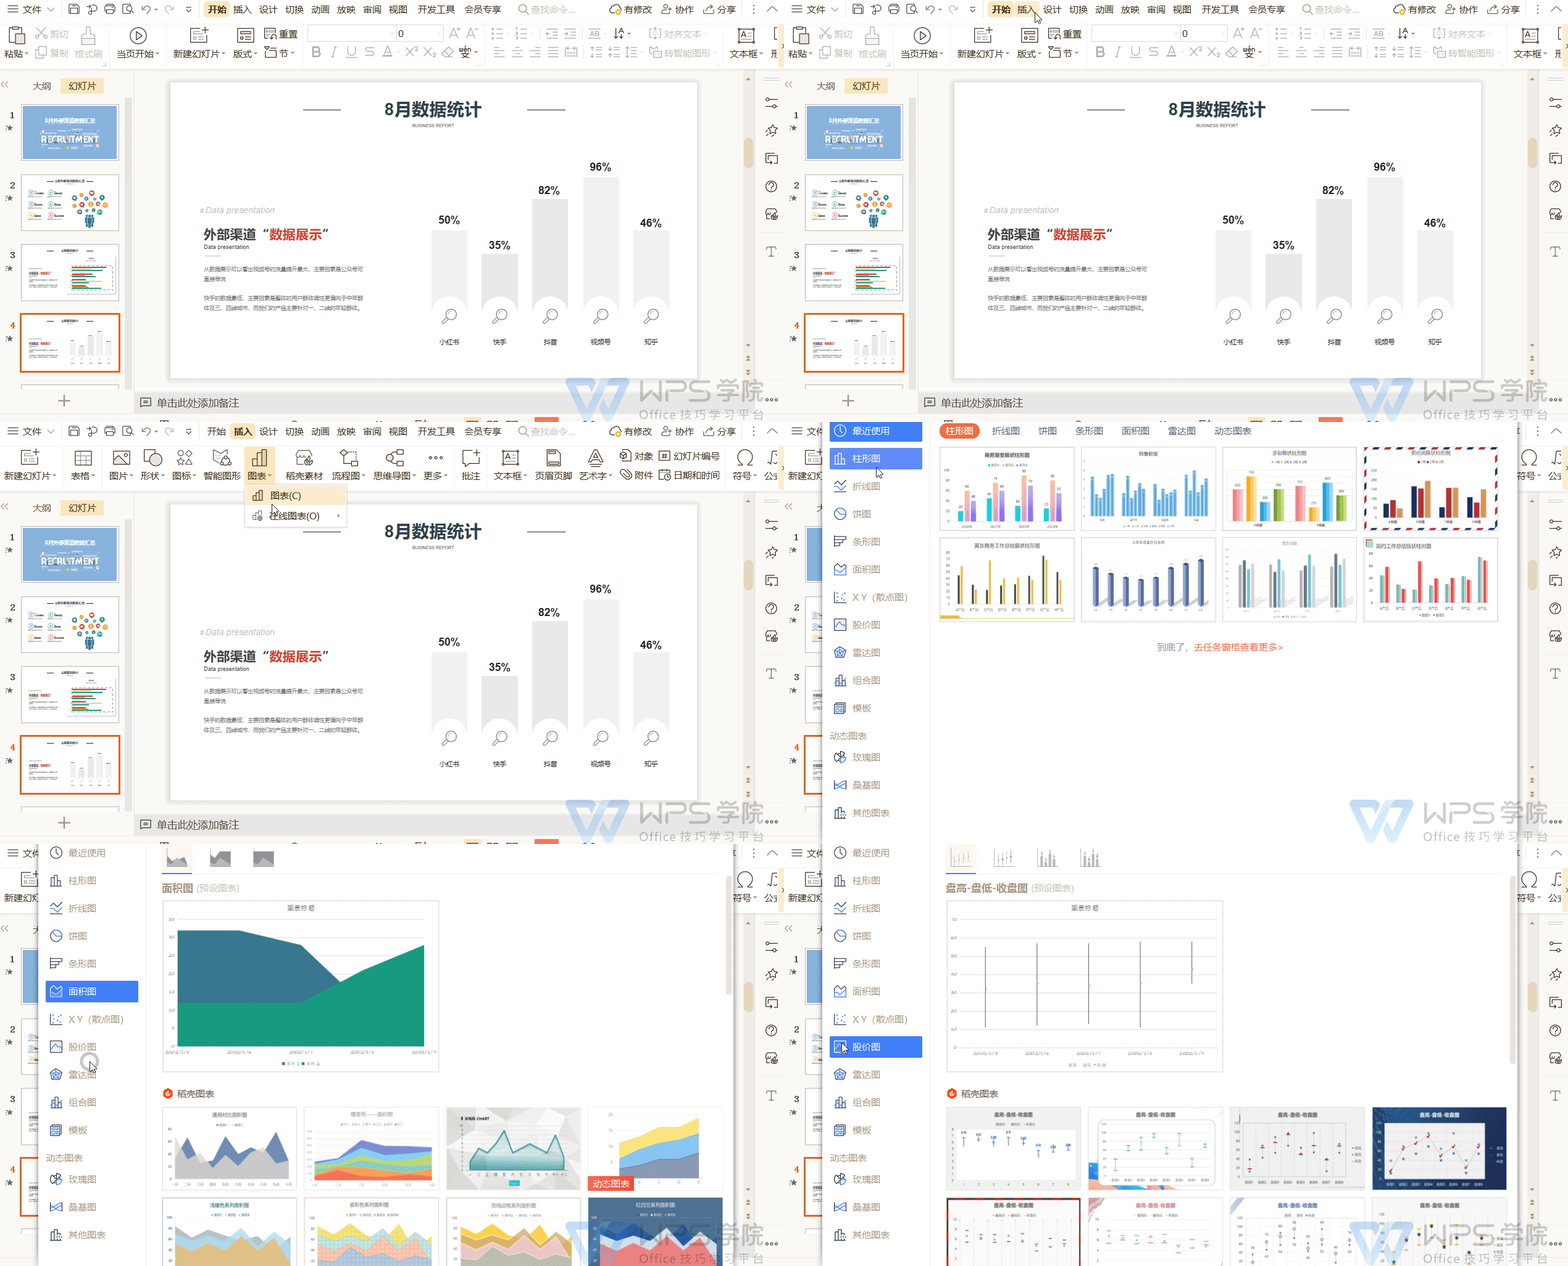
■ Take the course closing report PPT as an example. First click the [Insert] - [Chart] button. Pull down and you can see [Chart] and [Online Chart]. Click [Chart] 】You can see that there are many types of visual charts. Just select the appropriate chart to insert.

■How to modify the chart style?
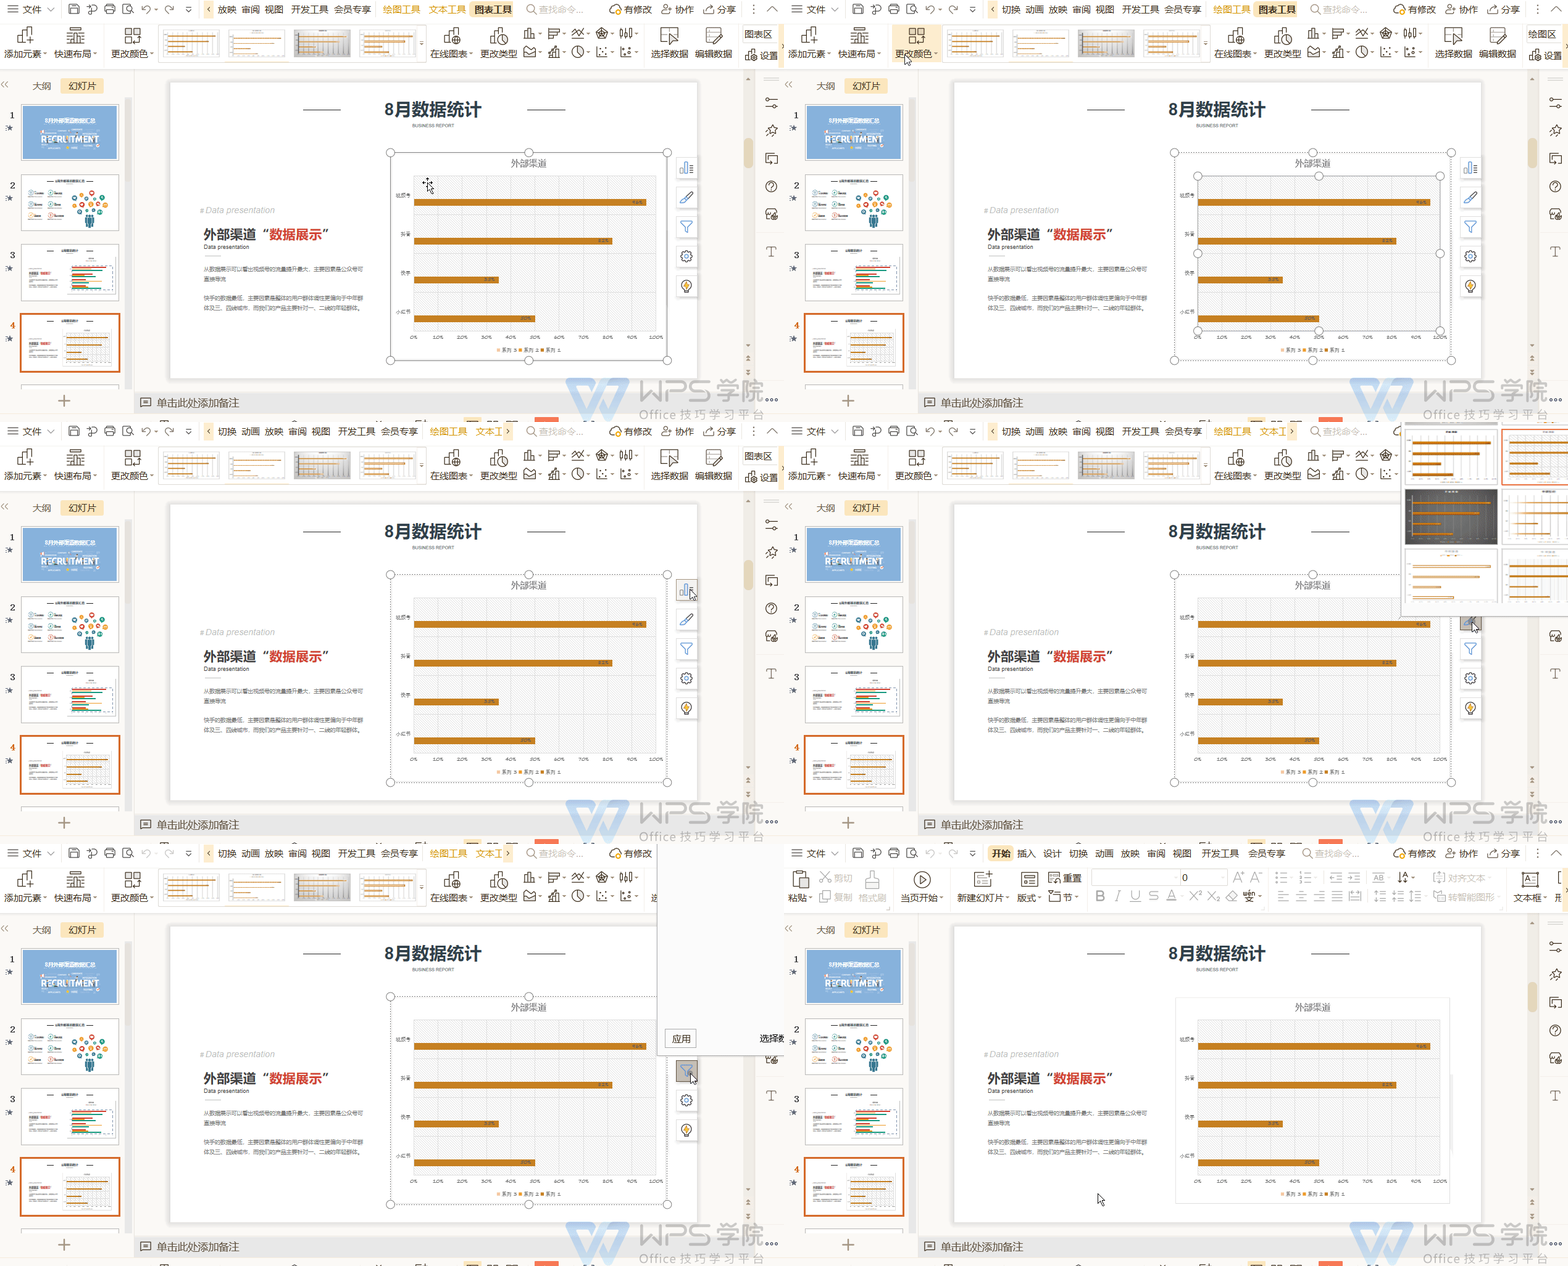
Click on the chart in the slide, and in the edit box above, you can quickly correct the color of the chart through functions such as [Add Elements], [Quick Layout], and [Change Color]. Style etc. You can also make corrections using the function keys on the right side of the chart. After visualizing the data, you can see the changes in the data more clearly. Have you learned it? Go try it now.

Articles are uploaded by users and are for non-commercial browsing only. Posted by: Lomu, please indicate the source: https://www.daogebangong.com/en/articles/detail/da-xue-sheng-ying-yong-ji-qiao-qiao-yong-shu-ju-tu-biao-you-hua-shu-ju-hui-bao.html

 支付宝扫一扫
评论列表(196条)
测试