- Graphic and text skills
The pie chart is one of the common chart styles in tables, which can visually view the relationship between data proportions.
How to draw a table pie chart?
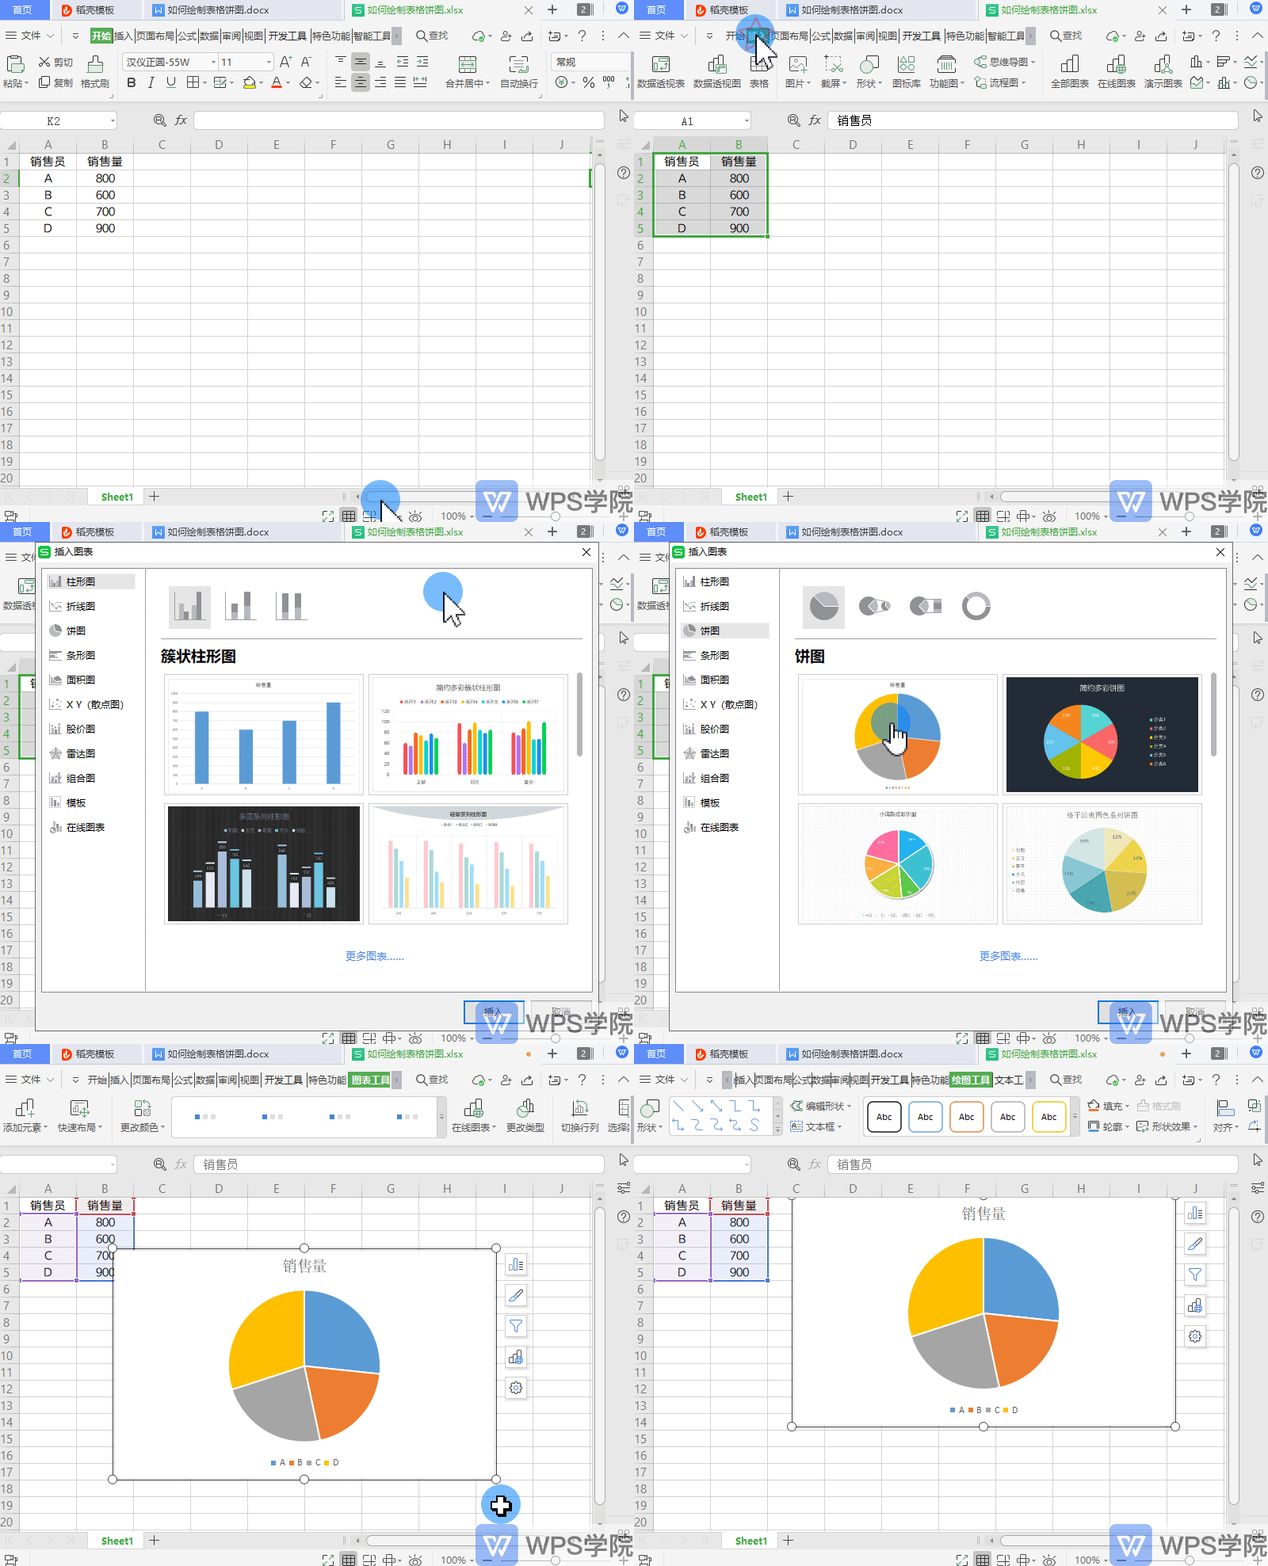
▪ Take this table as an example, and want to draw a pie chart of this table's data.
Select the table data cell and click Insert - All Charts - Pie Chart in the menu bar above.
Select the pie chart style and click to insert.


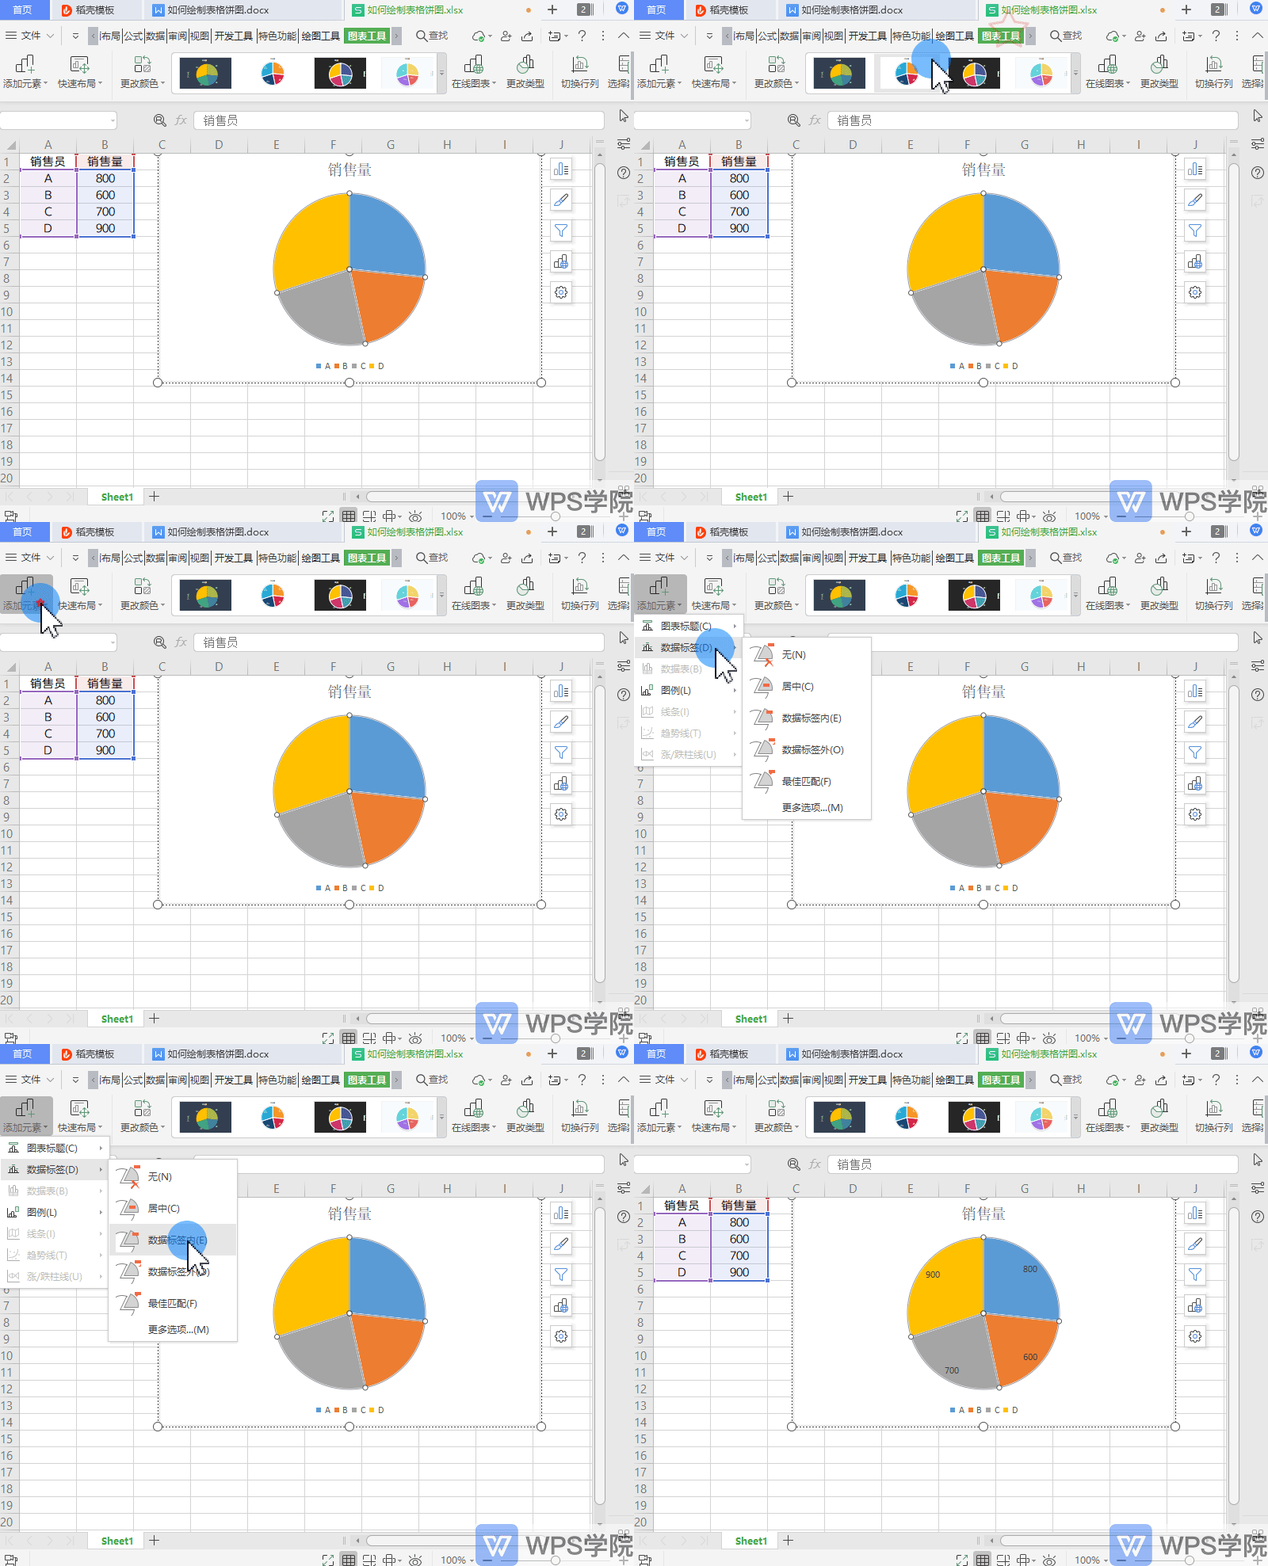
▪ If we want to insert corresponding data labels into the pie chart, how should we do it?
Click Chart Tools-Add Element-Data Label, select a style, and click to add.

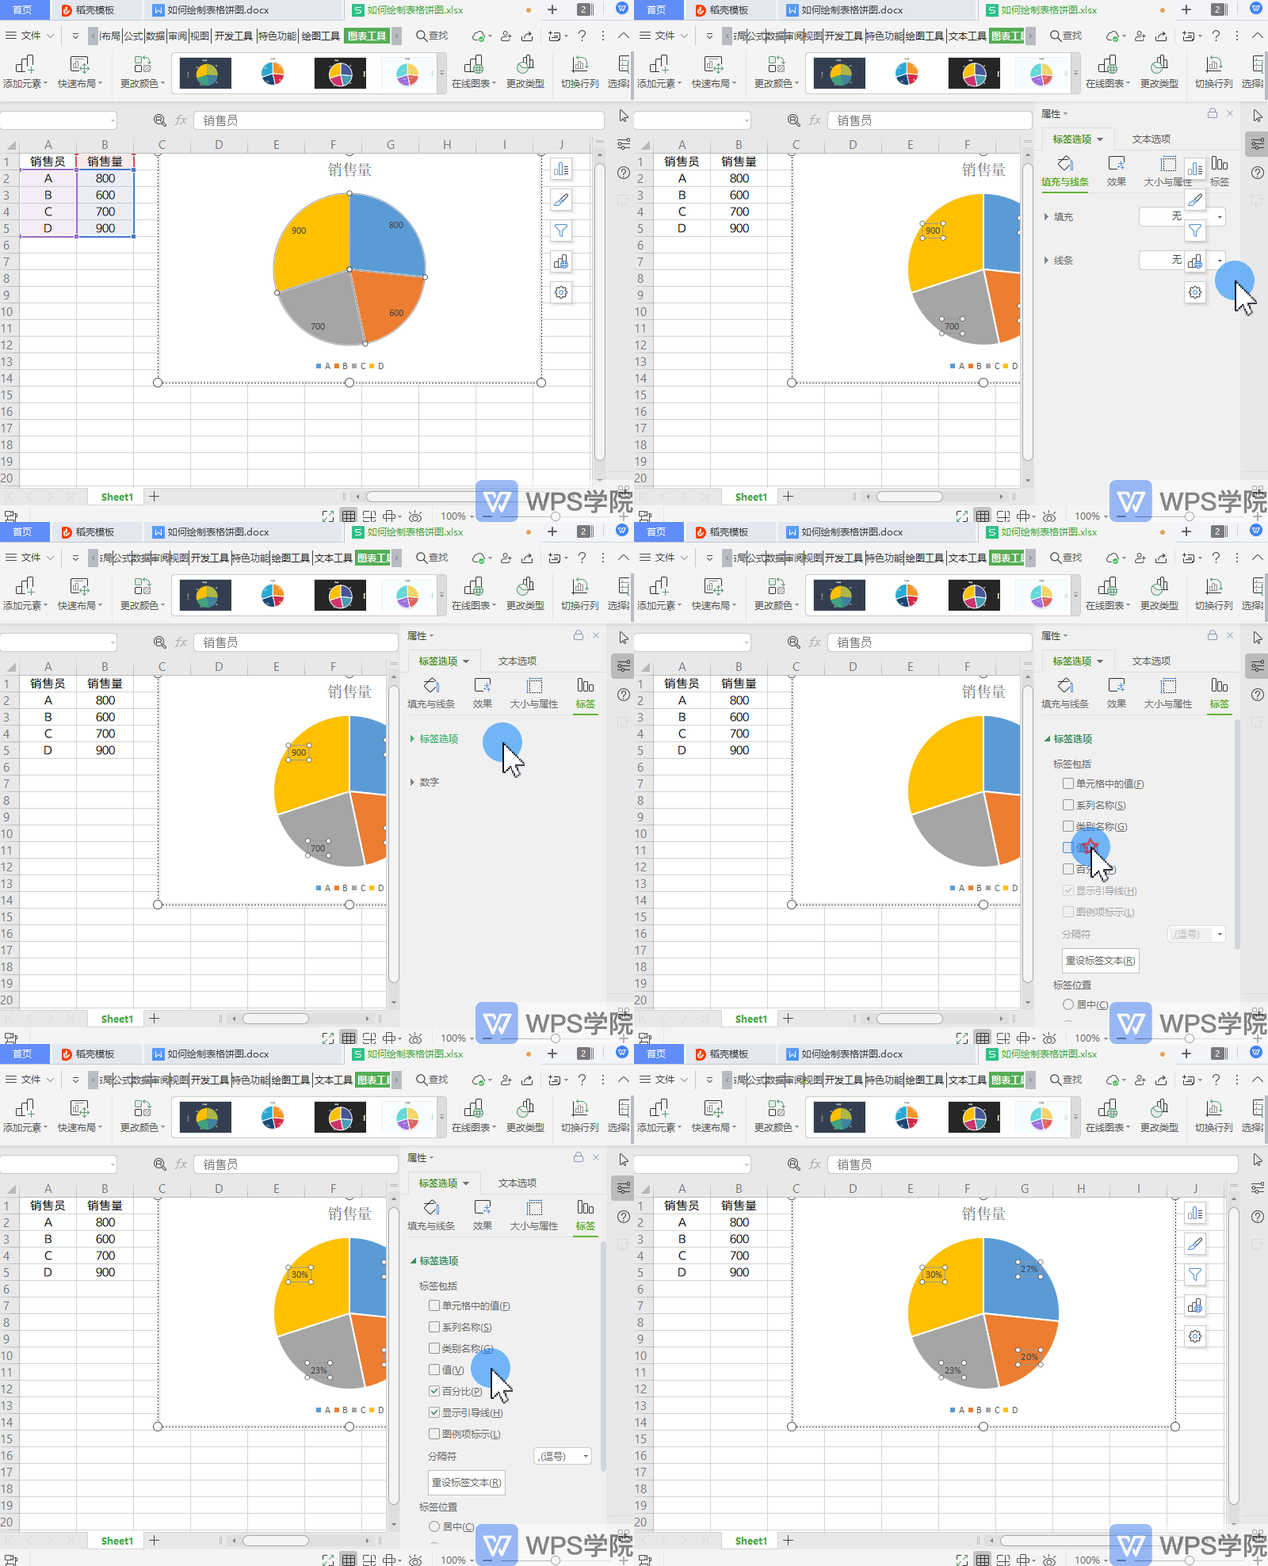
▪ How to display the data labels in the pie chart as a percentage?
Double-click the data label in the pie chart and select Label Options - Label in the property box on the right.
In the label options, uncheck "Value" and check "Percent".
This will display the pie chart data percentage.

Articles are uploaded by users and are for non-commercial browsing only. Posted by: Lomu, please indicate the source: https://www.daogebangong.com/en/articles/detail/bing-tu-zhi-zuo-zhi-nan-biao-ge-hui-zhi-xin-shou-ru-men.html

 支付宝扫一扫
评论列表(196条)
测试