- Picture and text skills
Use charts to express data more intuitively.
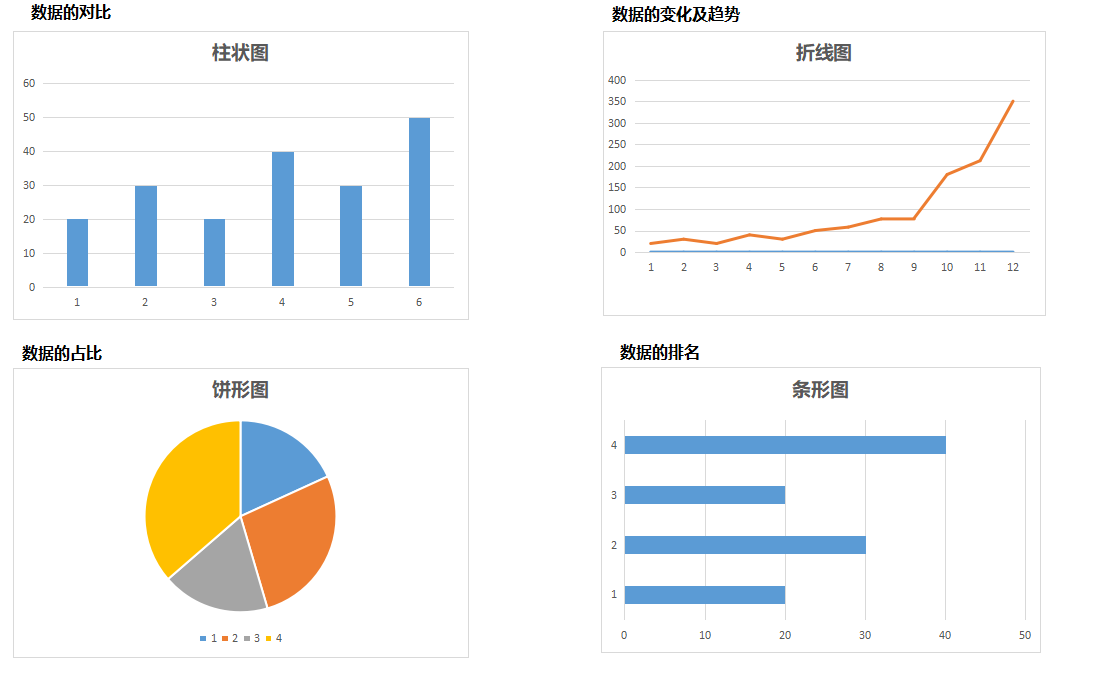
This issue will introduce you to the basic chart types, namely bar chart and line chart. , pie chart, bar chart.

Bar charts are used to represent the contrast and comparison of data.
Line charts are used to represent changes and trends in data.
Pie charts are used to represent the proportion of data.
Bar charts are used to represent the ranking of data.

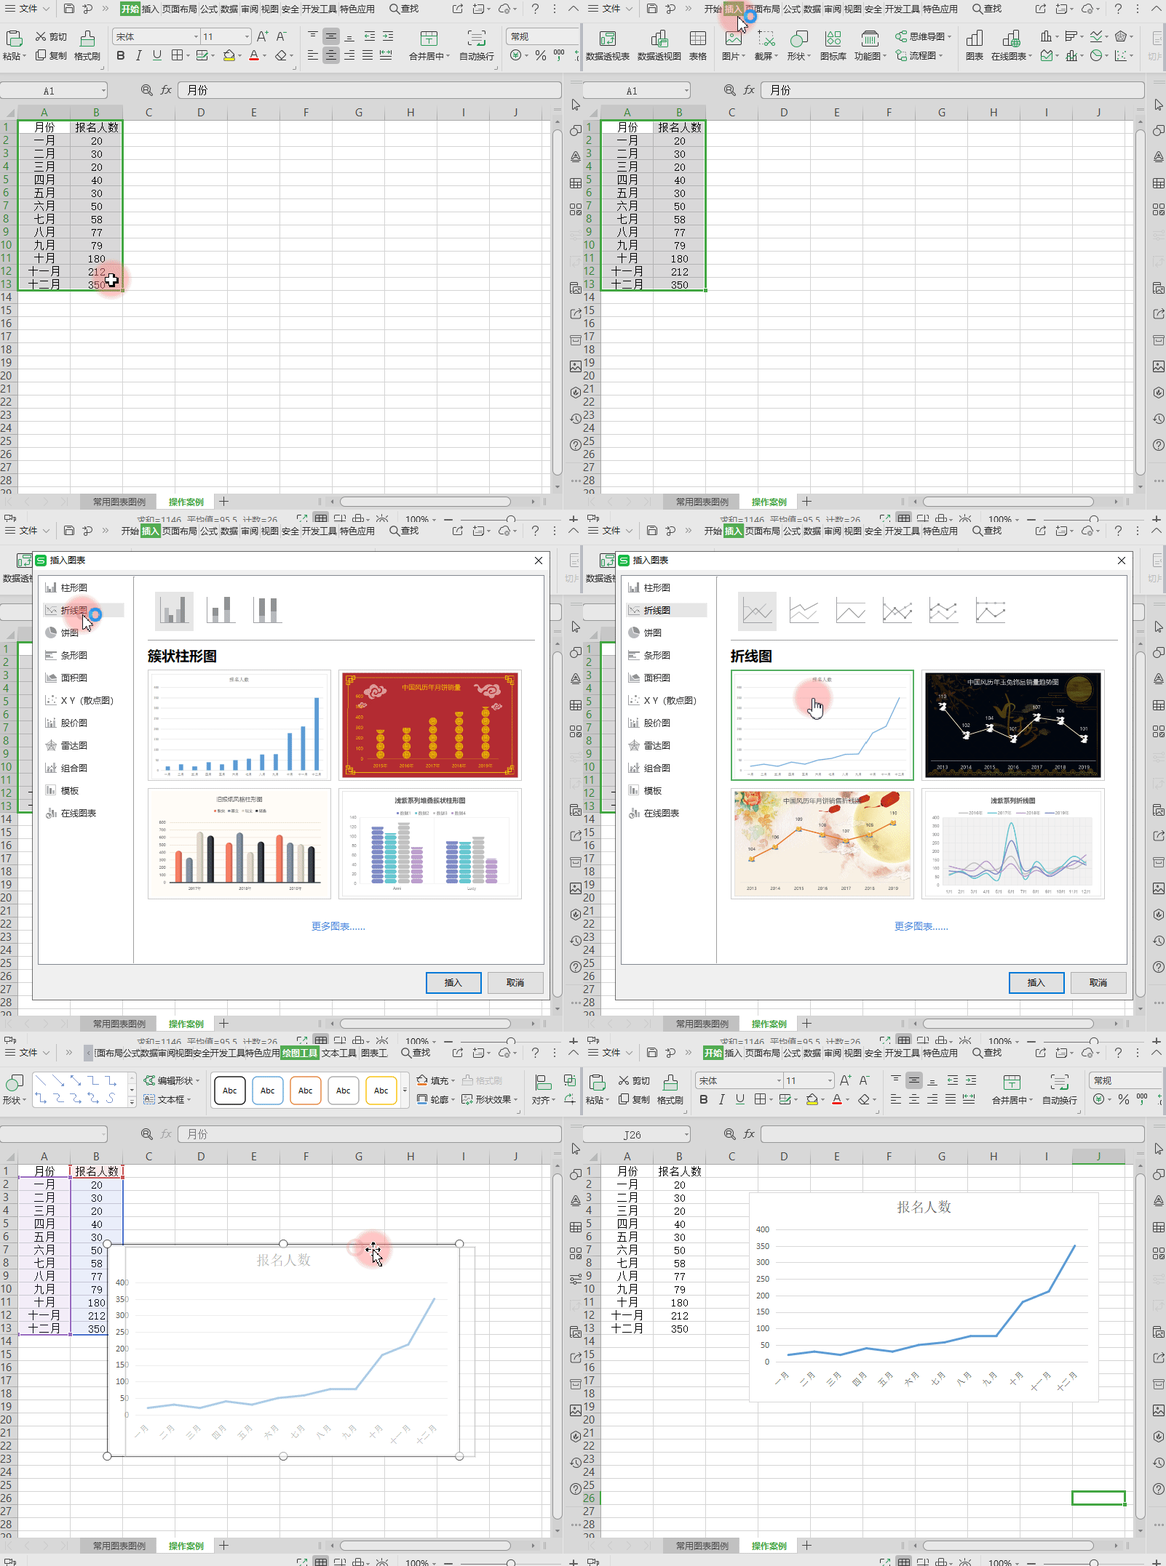
In the WPS table, data can be automatically generated into charts.
■ This table is the statistics of monthly applicants.
To more intuitively show the trend of changes in the number of monthly registrations, you can use a line chart.
Select the data area, click "Insert" - "Chart", here you can choose to automatically generate various types of chart.
Click on the line chart, select a style, click Insert, and the line chart will be automatically generated.

Articles are uploaded by users and are for non-commercial browsing only. Posted by: Lomu, please indicate the source: https://www.daogebangong.com/en/articles/detail/biao-ge-xin-shou-jiao-cheng-tu-biao-zi-dong-sheng-cheng.html

 支付宝扫一扫
评论列表(196条)
测试