- Image and text skills
The line column chart is a very important and commonly used combination chart, which can visually express two sets of data in the same table.
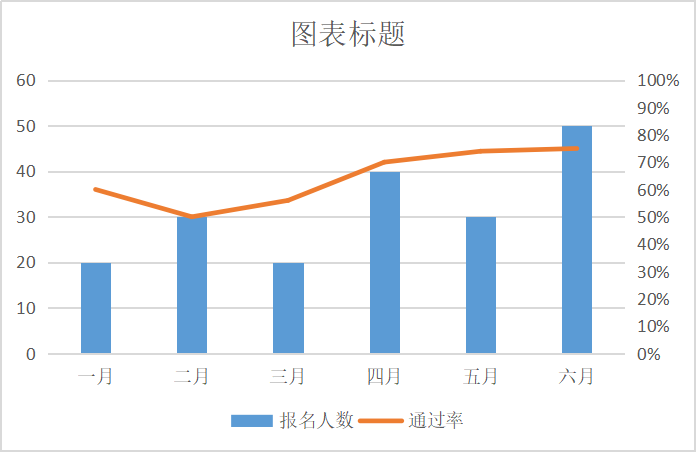
For example, you want to express the comparison of the number of people who sign up for the exam each month and the exam passing rate in a chart.
How to make such a chart?

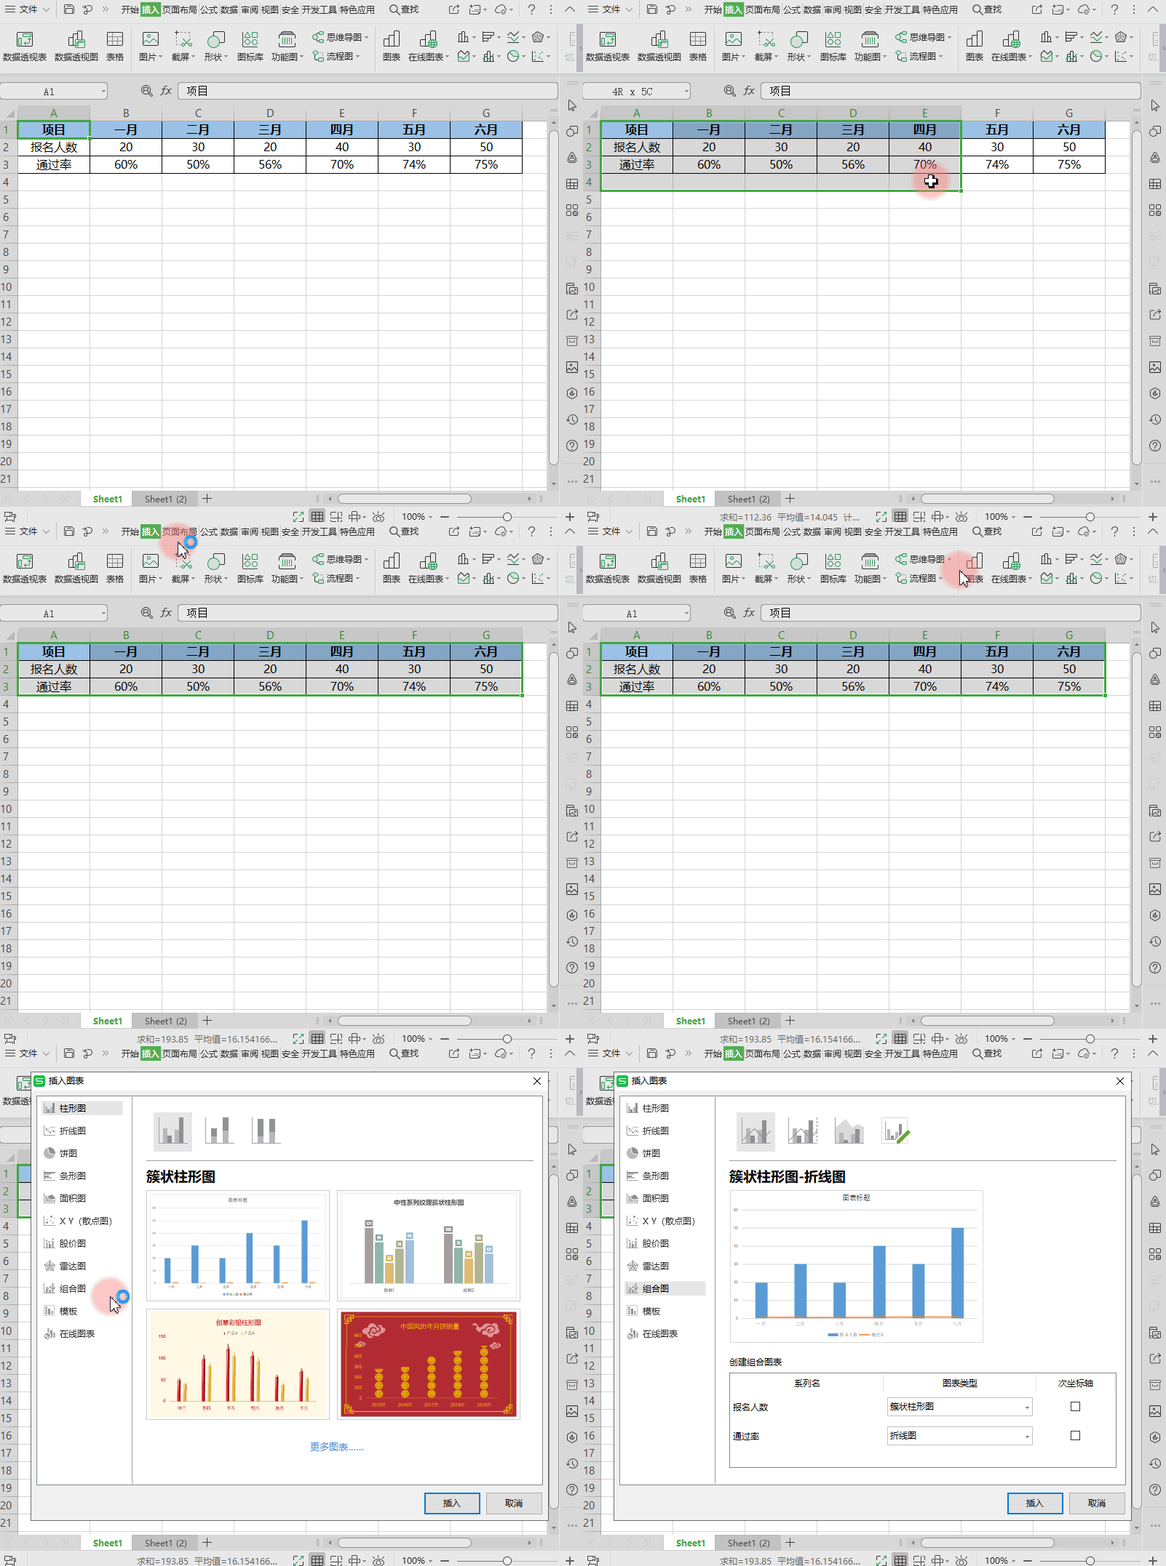
First prepare the table data.
■ In the first step, select the data area, click "Insert" - "Chart", and select "Combined Chart".
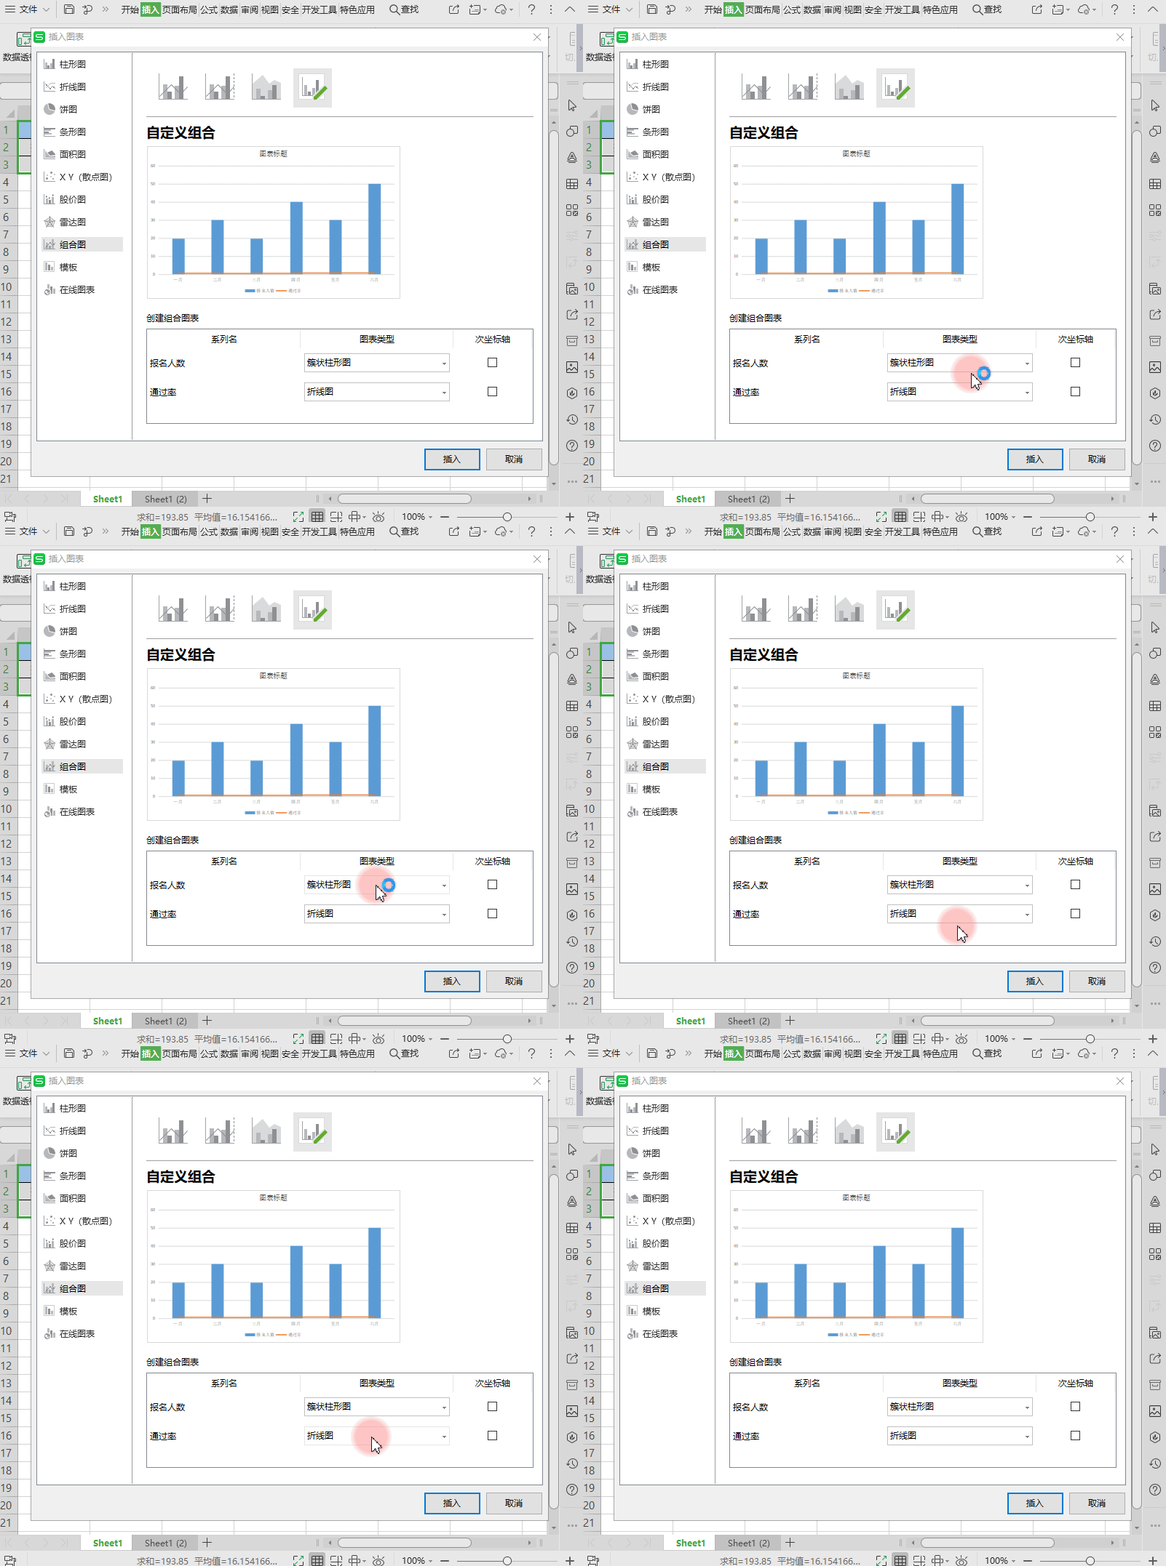
■ In the second step, select clustered column chart-line chart.
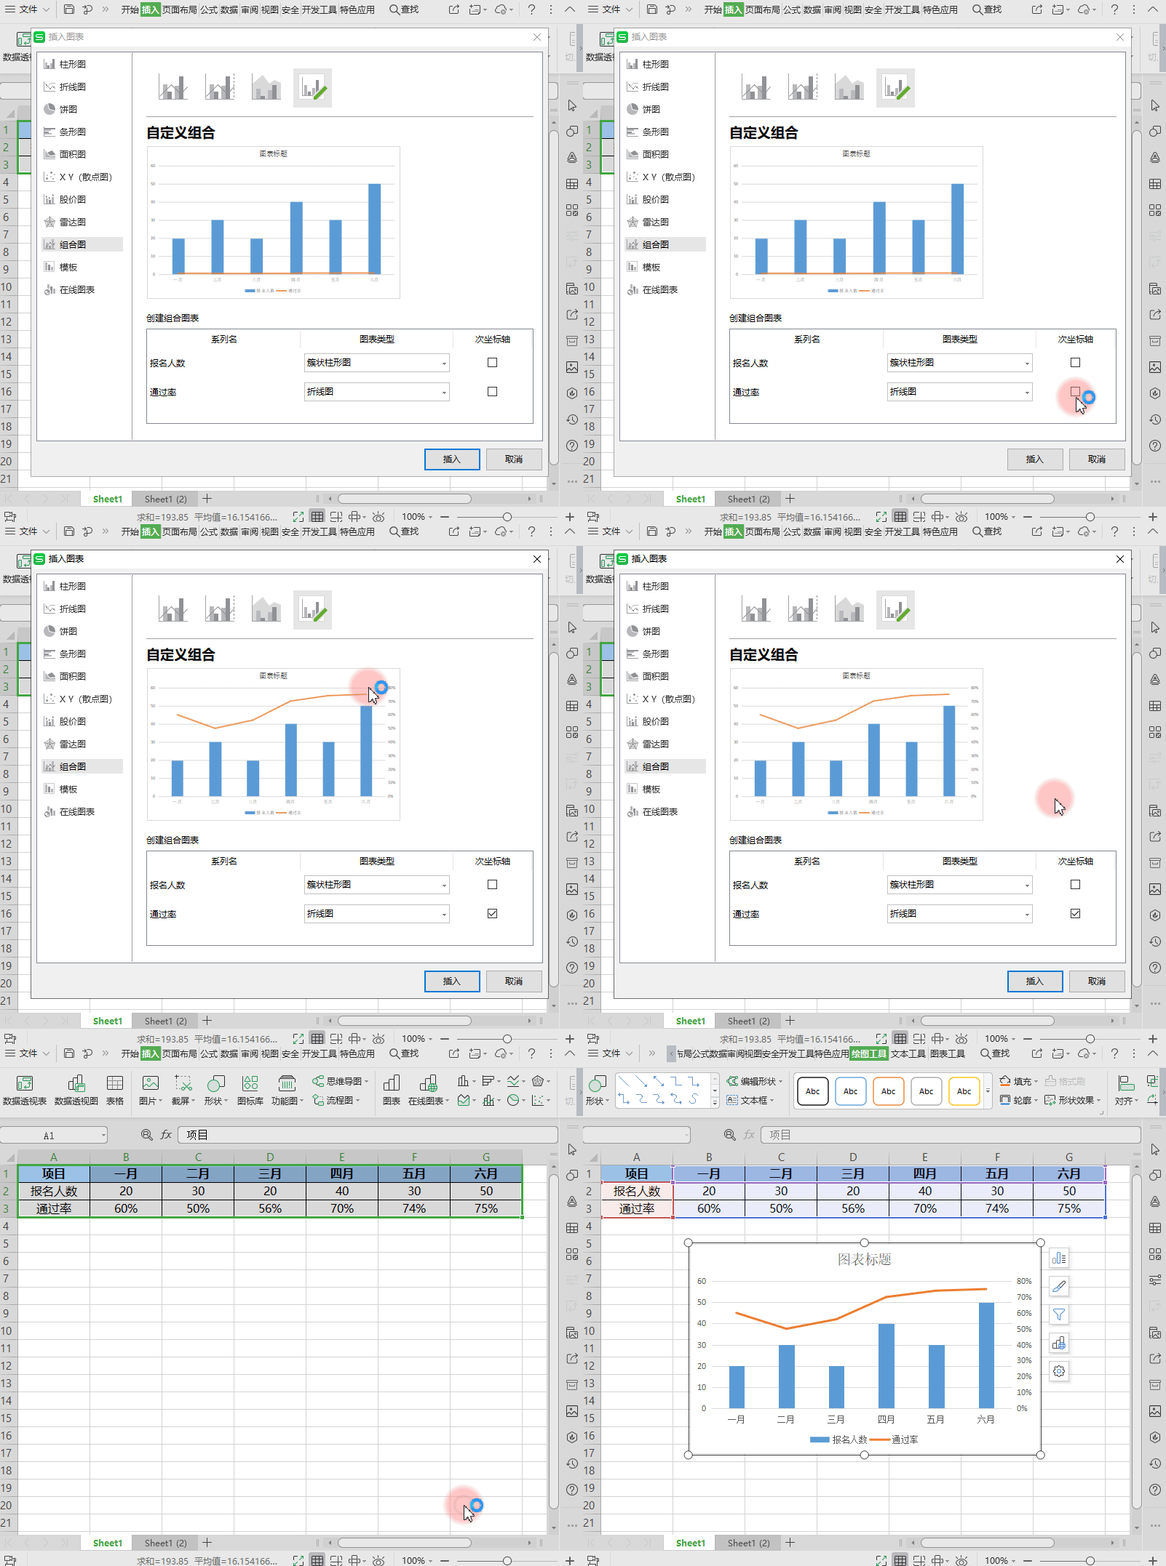
Because the data on the number of applicants and the passing rate are very different, the passing rate cannot be displayed in one chart.
■ So in the third step, check the "Secondary Axis" behind the line chart and set the coordinate axis of the line chart to the right.
After the chart is generated, you can see that the column chart and line chart are in the same table.
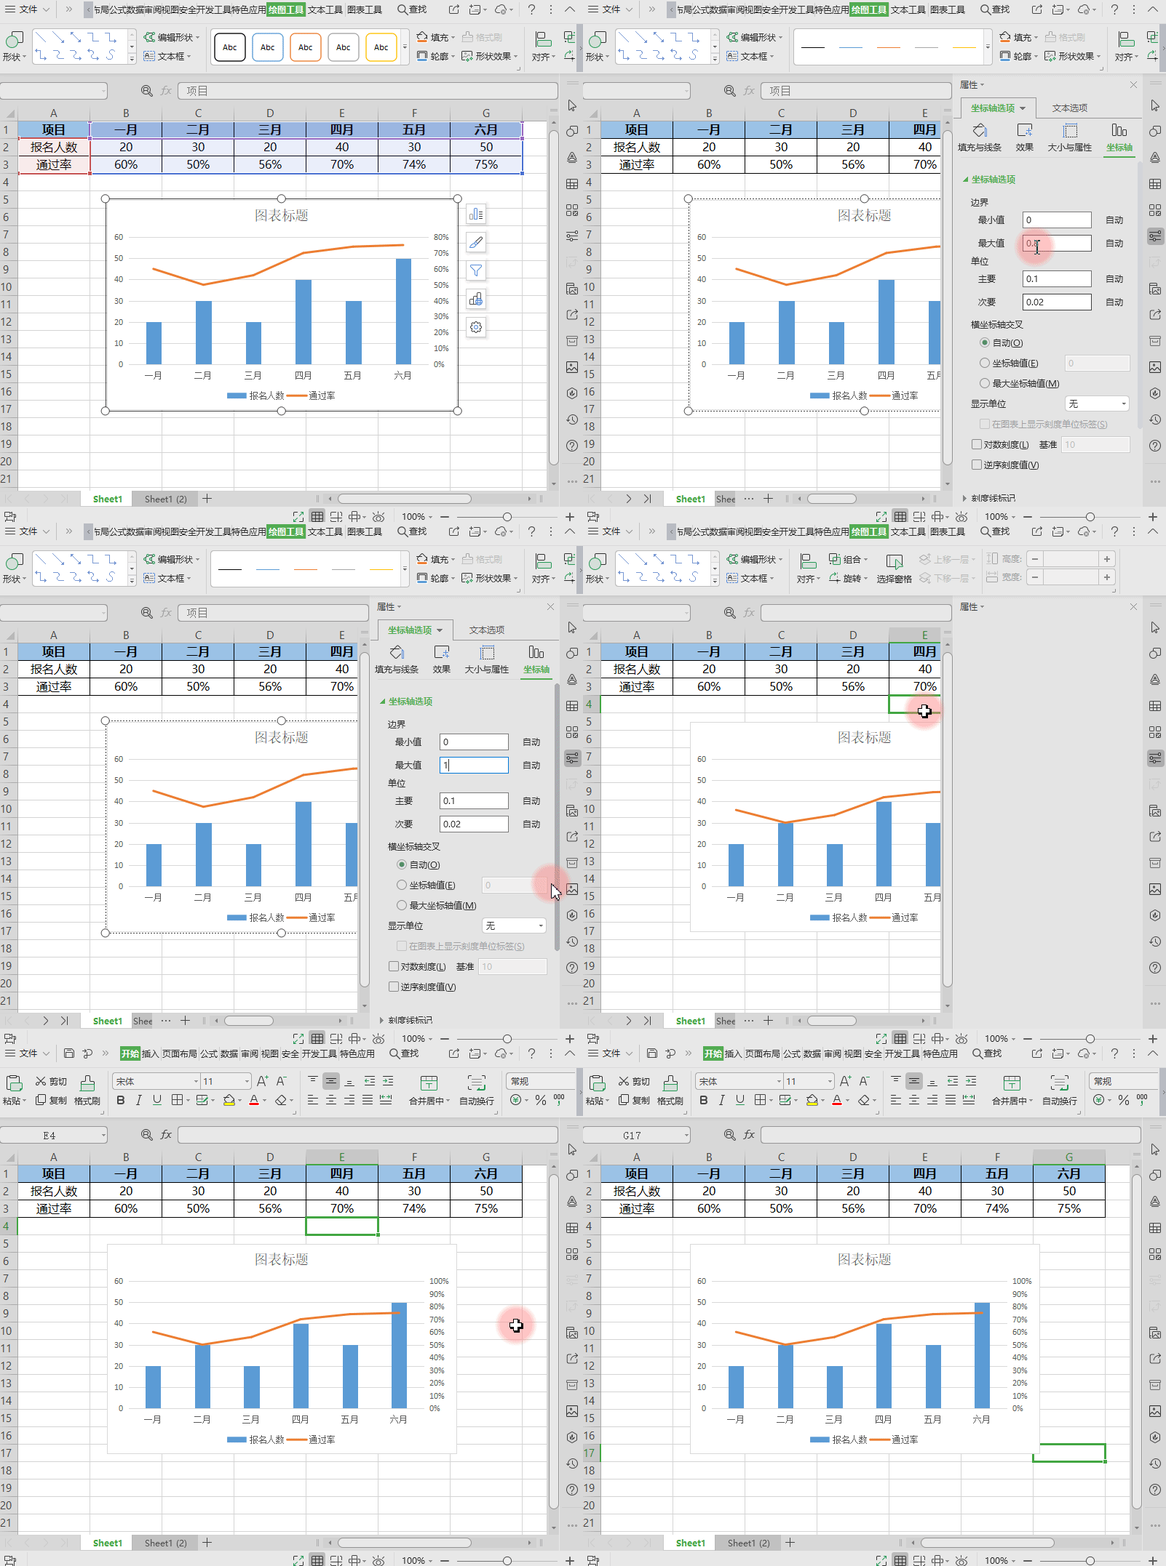
■ To customize the axis scale, double-click the coordinate scale.
Select "Axis Options" in the task pane on the right to modify the maximum value of the axis.
The completed effect is as shown in the picture.
Articles are uploaded by users and are for non-commercial browsing only. Posted by: Lomu, please indicate the source: https://www.daogebangong.com/en/articles/detail/biao-ge-xin-shou-jiao-cheng-chang-yong-tu-biao-xian-zhu-tu.html

 支付宝扫一扫
评论列表(196条)
测试