- Graphic and text skills
How can a novice with zero foundation quickly get started with light dimension tables? Come and take a look~
Feature Highlights
As an online collaboration tool, Qingwei Table's main function is to achieve data tracking management and collaborative office. By building a task management system through Qingwei Table, we can quickly assign tasks and see the completion progress of each task.
Next, we open the light dimension table from Kingsoft Documentation and take you to easily build a task management system using templates.
First, we click [New] in the team to create a new light-dimensional table, and select [Team Task Management Dashboard] in the template. There is a [Keep Template Data] command here that can be checked according to actual needs.
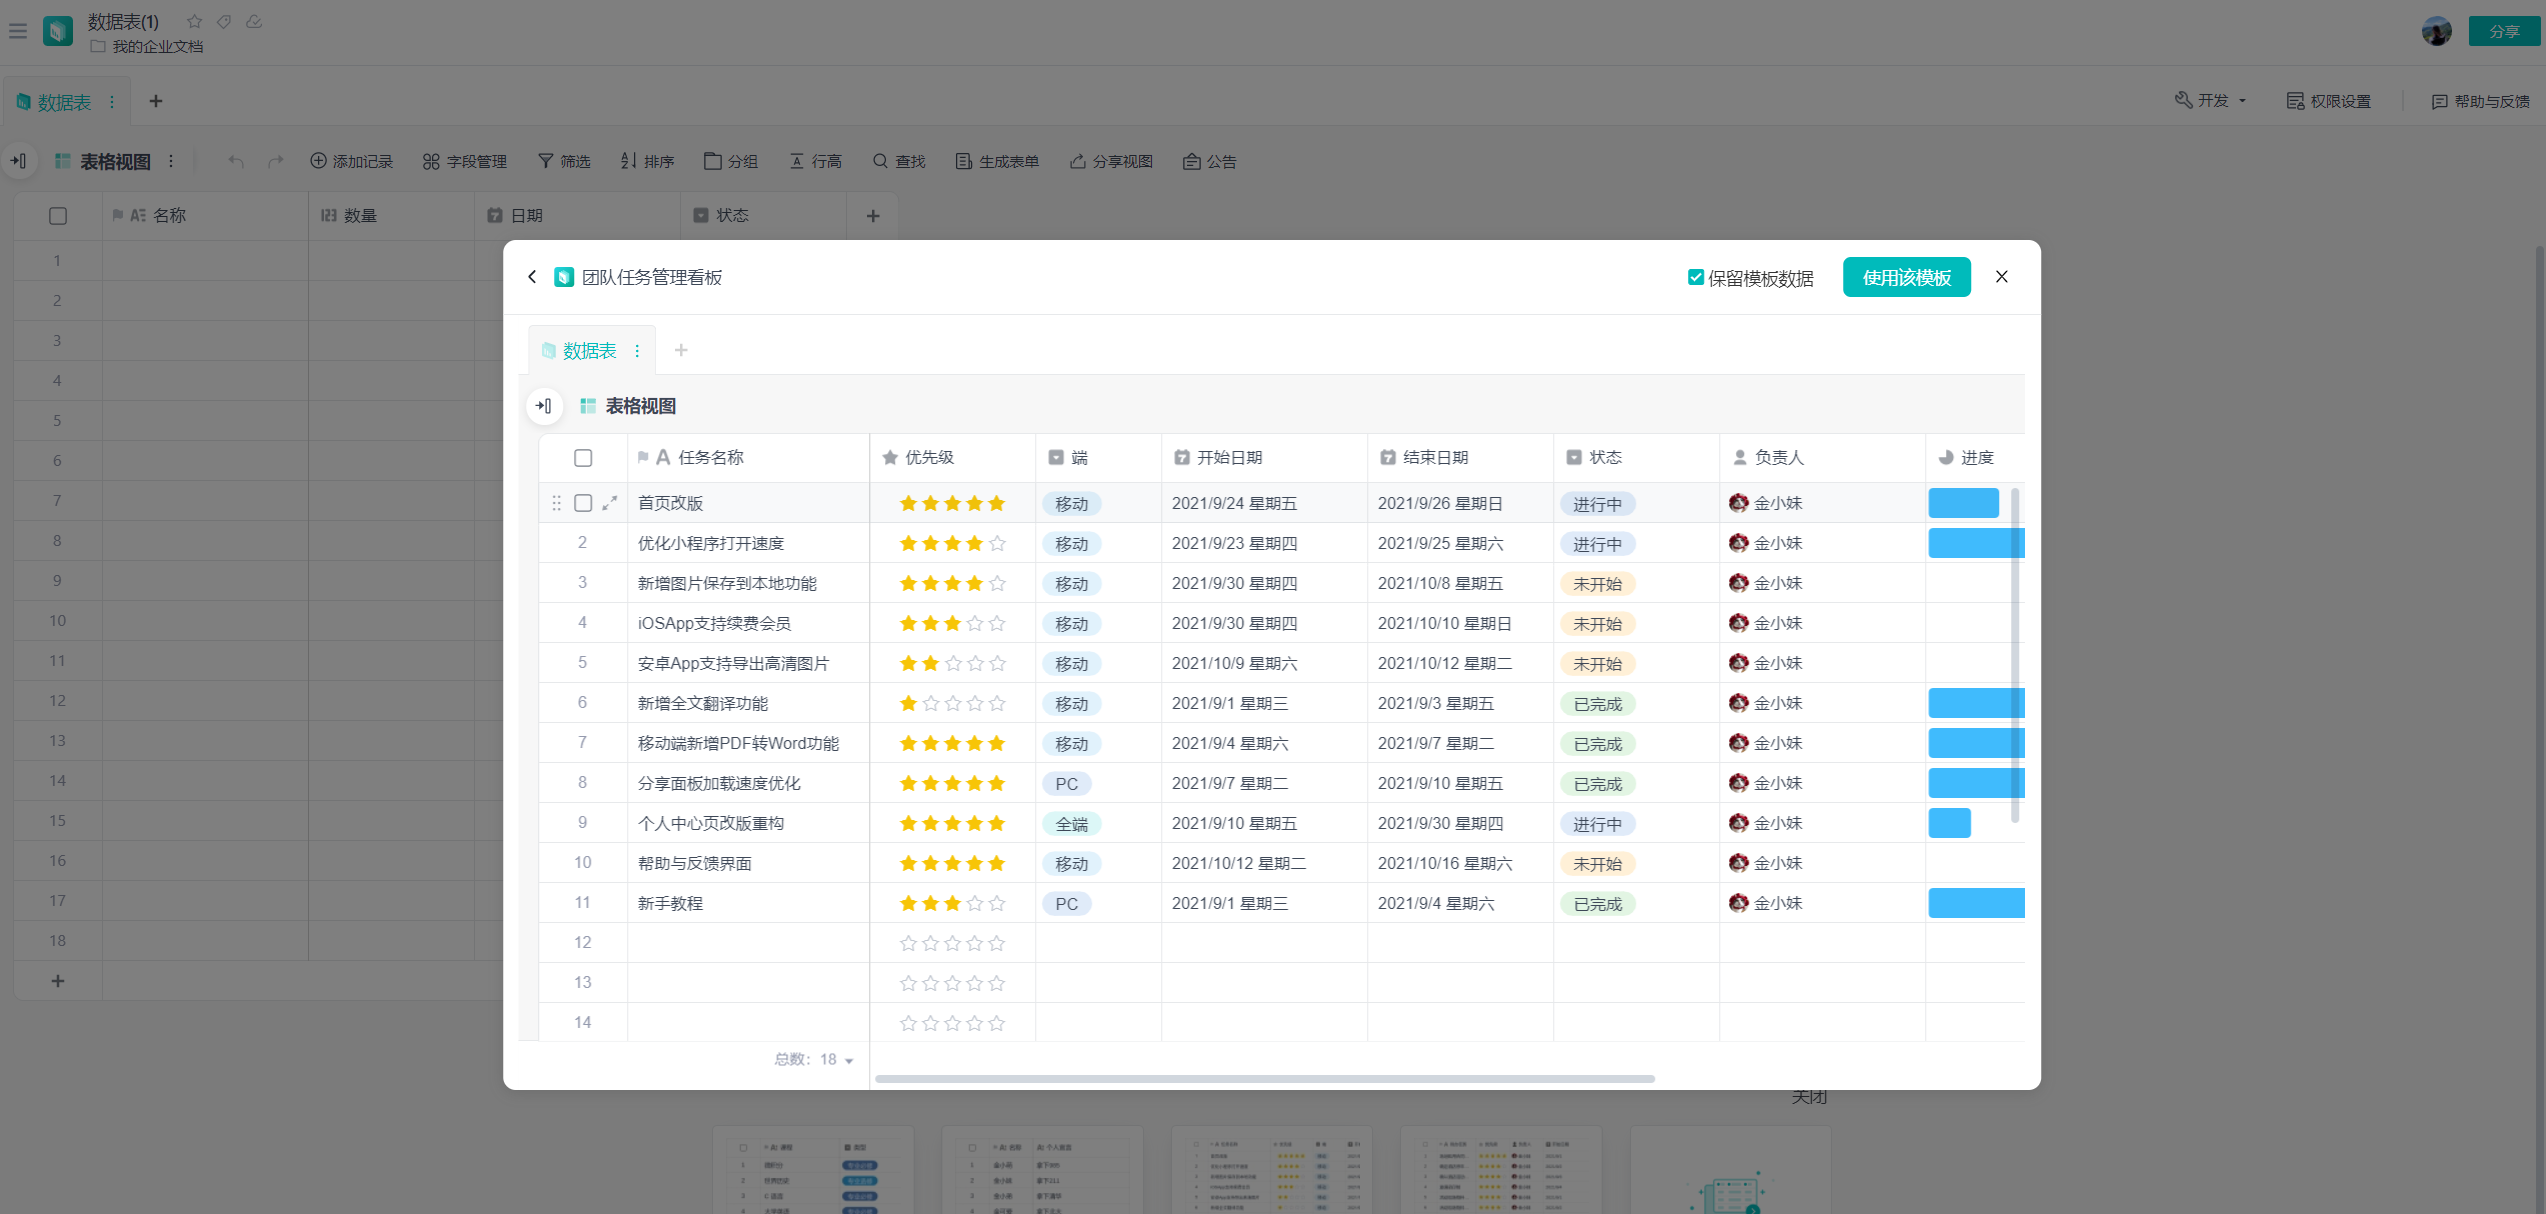
There are multiple views on the left side of the table. A view is a way to display data in different dimensions based on the source data of the data table. The same data can have multiple different views at the same time to facilitate the organization and management of the data.
When the source data changes, the data in the view will also change simultaneously.
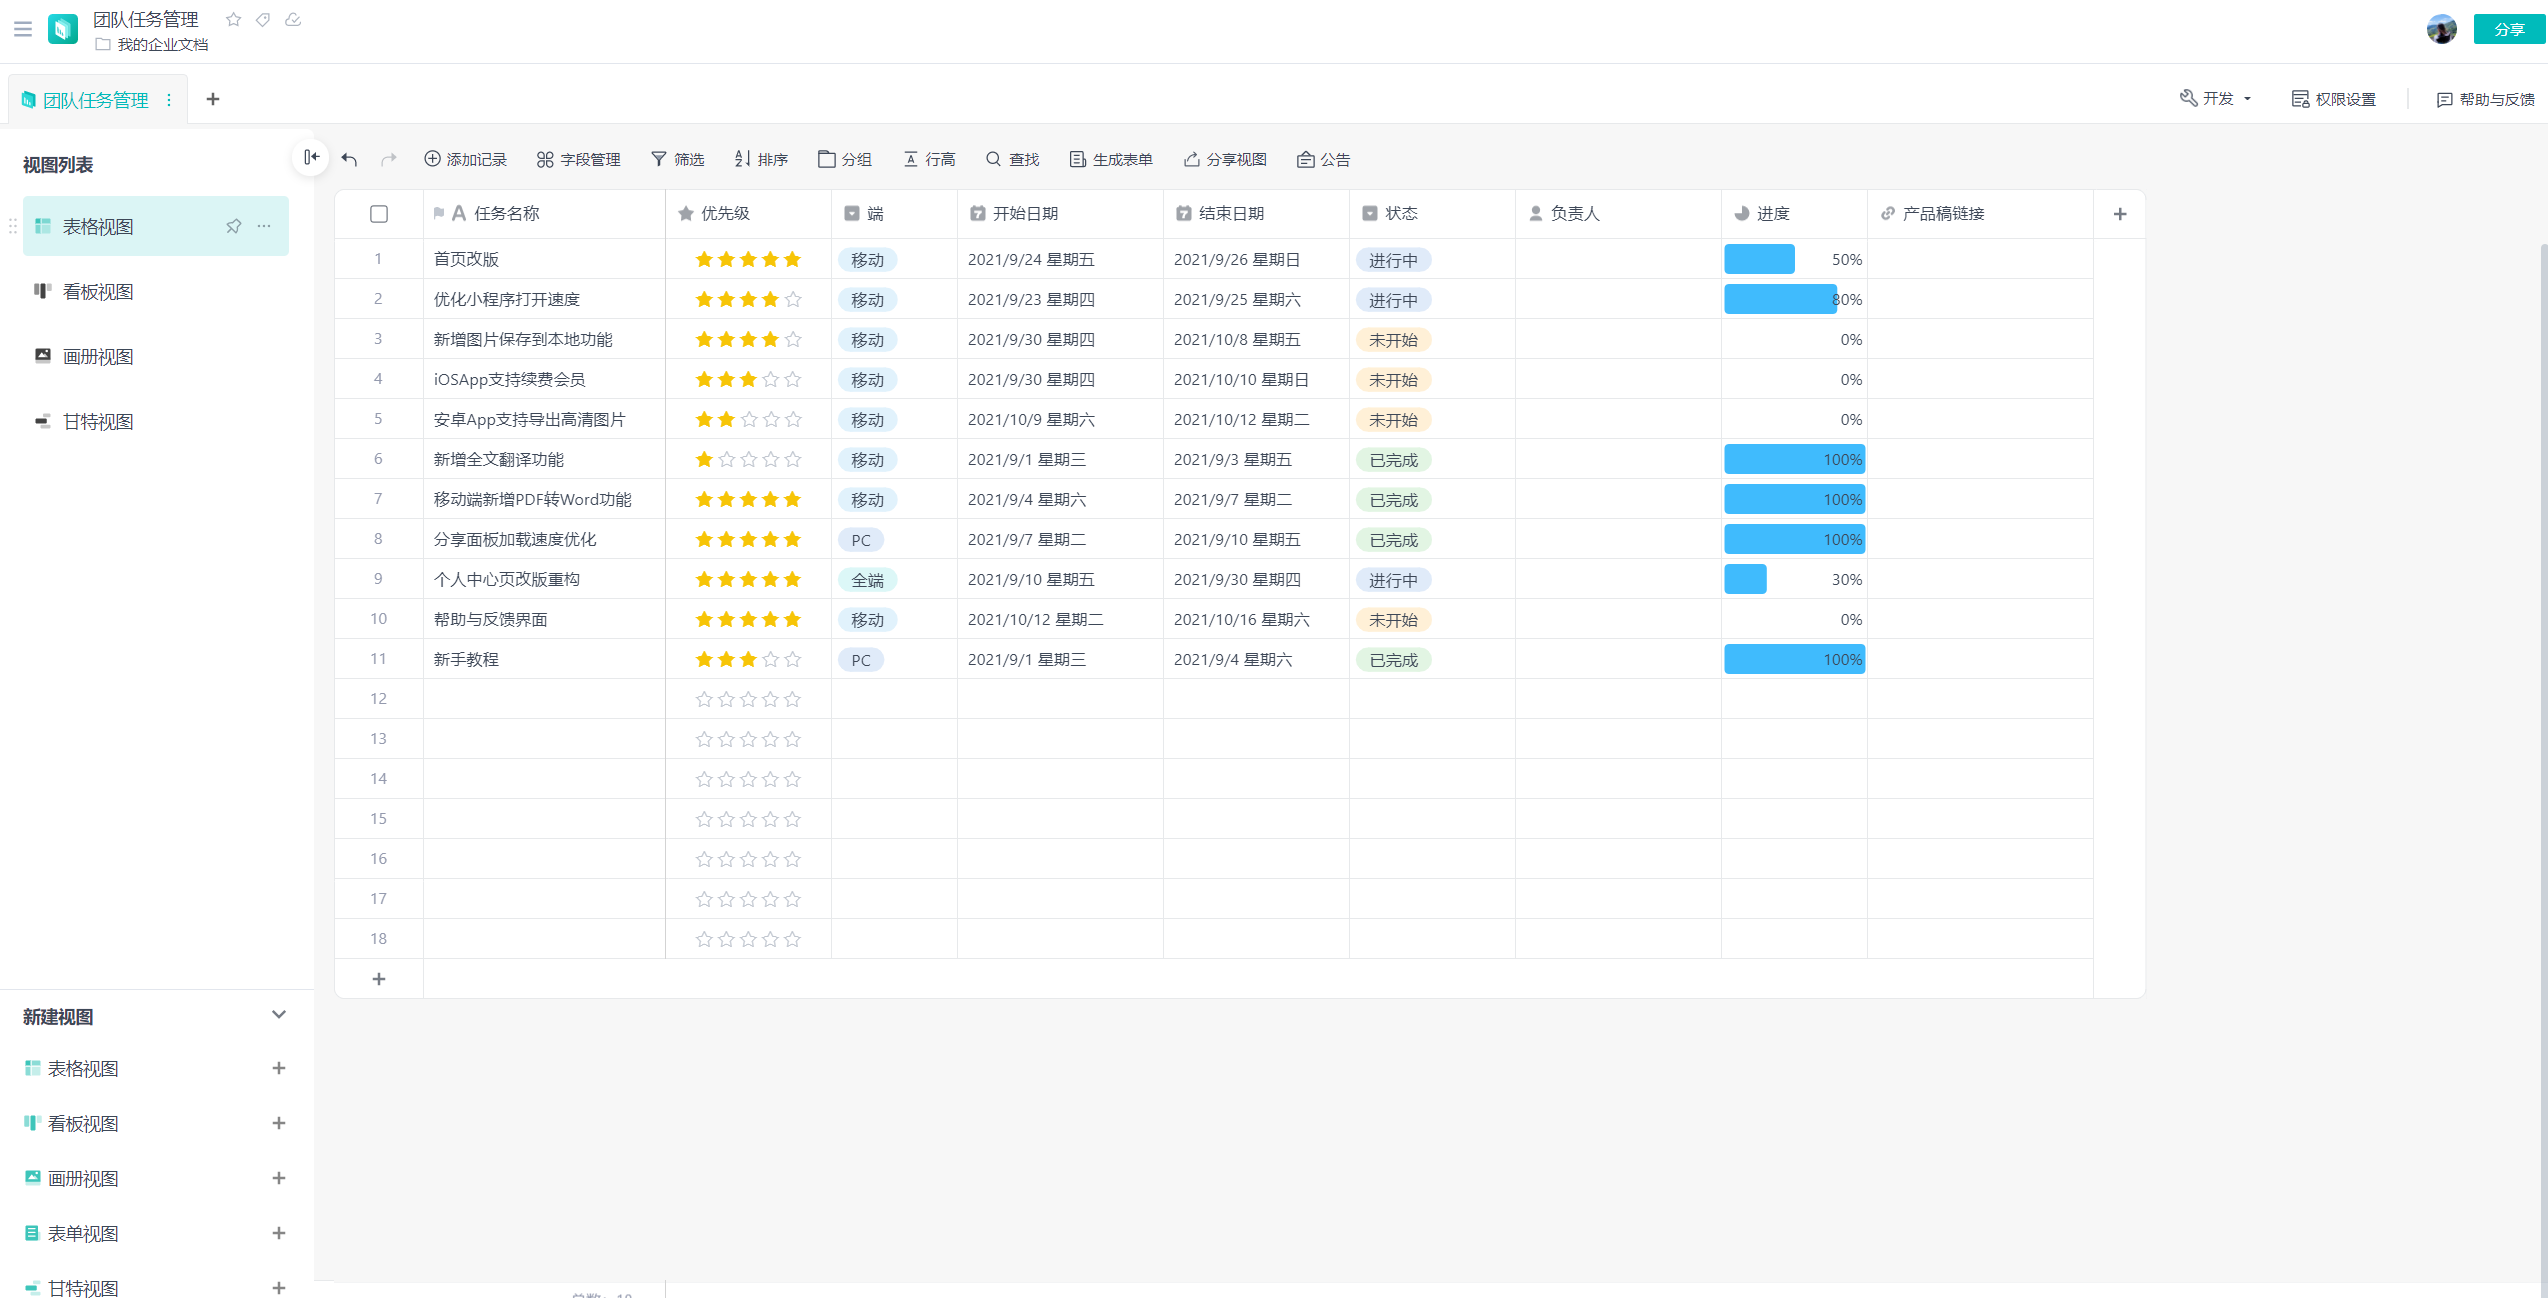
Table view
As the default view of the data table, the table view is suitable for any data scenario. It is generally stored as raw data. The field types in the same column are the same (such as grade and date fields), so when filling in, it must be filled in according to the specifications. This is The accuracy and consistency of data are guaranteed.
Kanban view
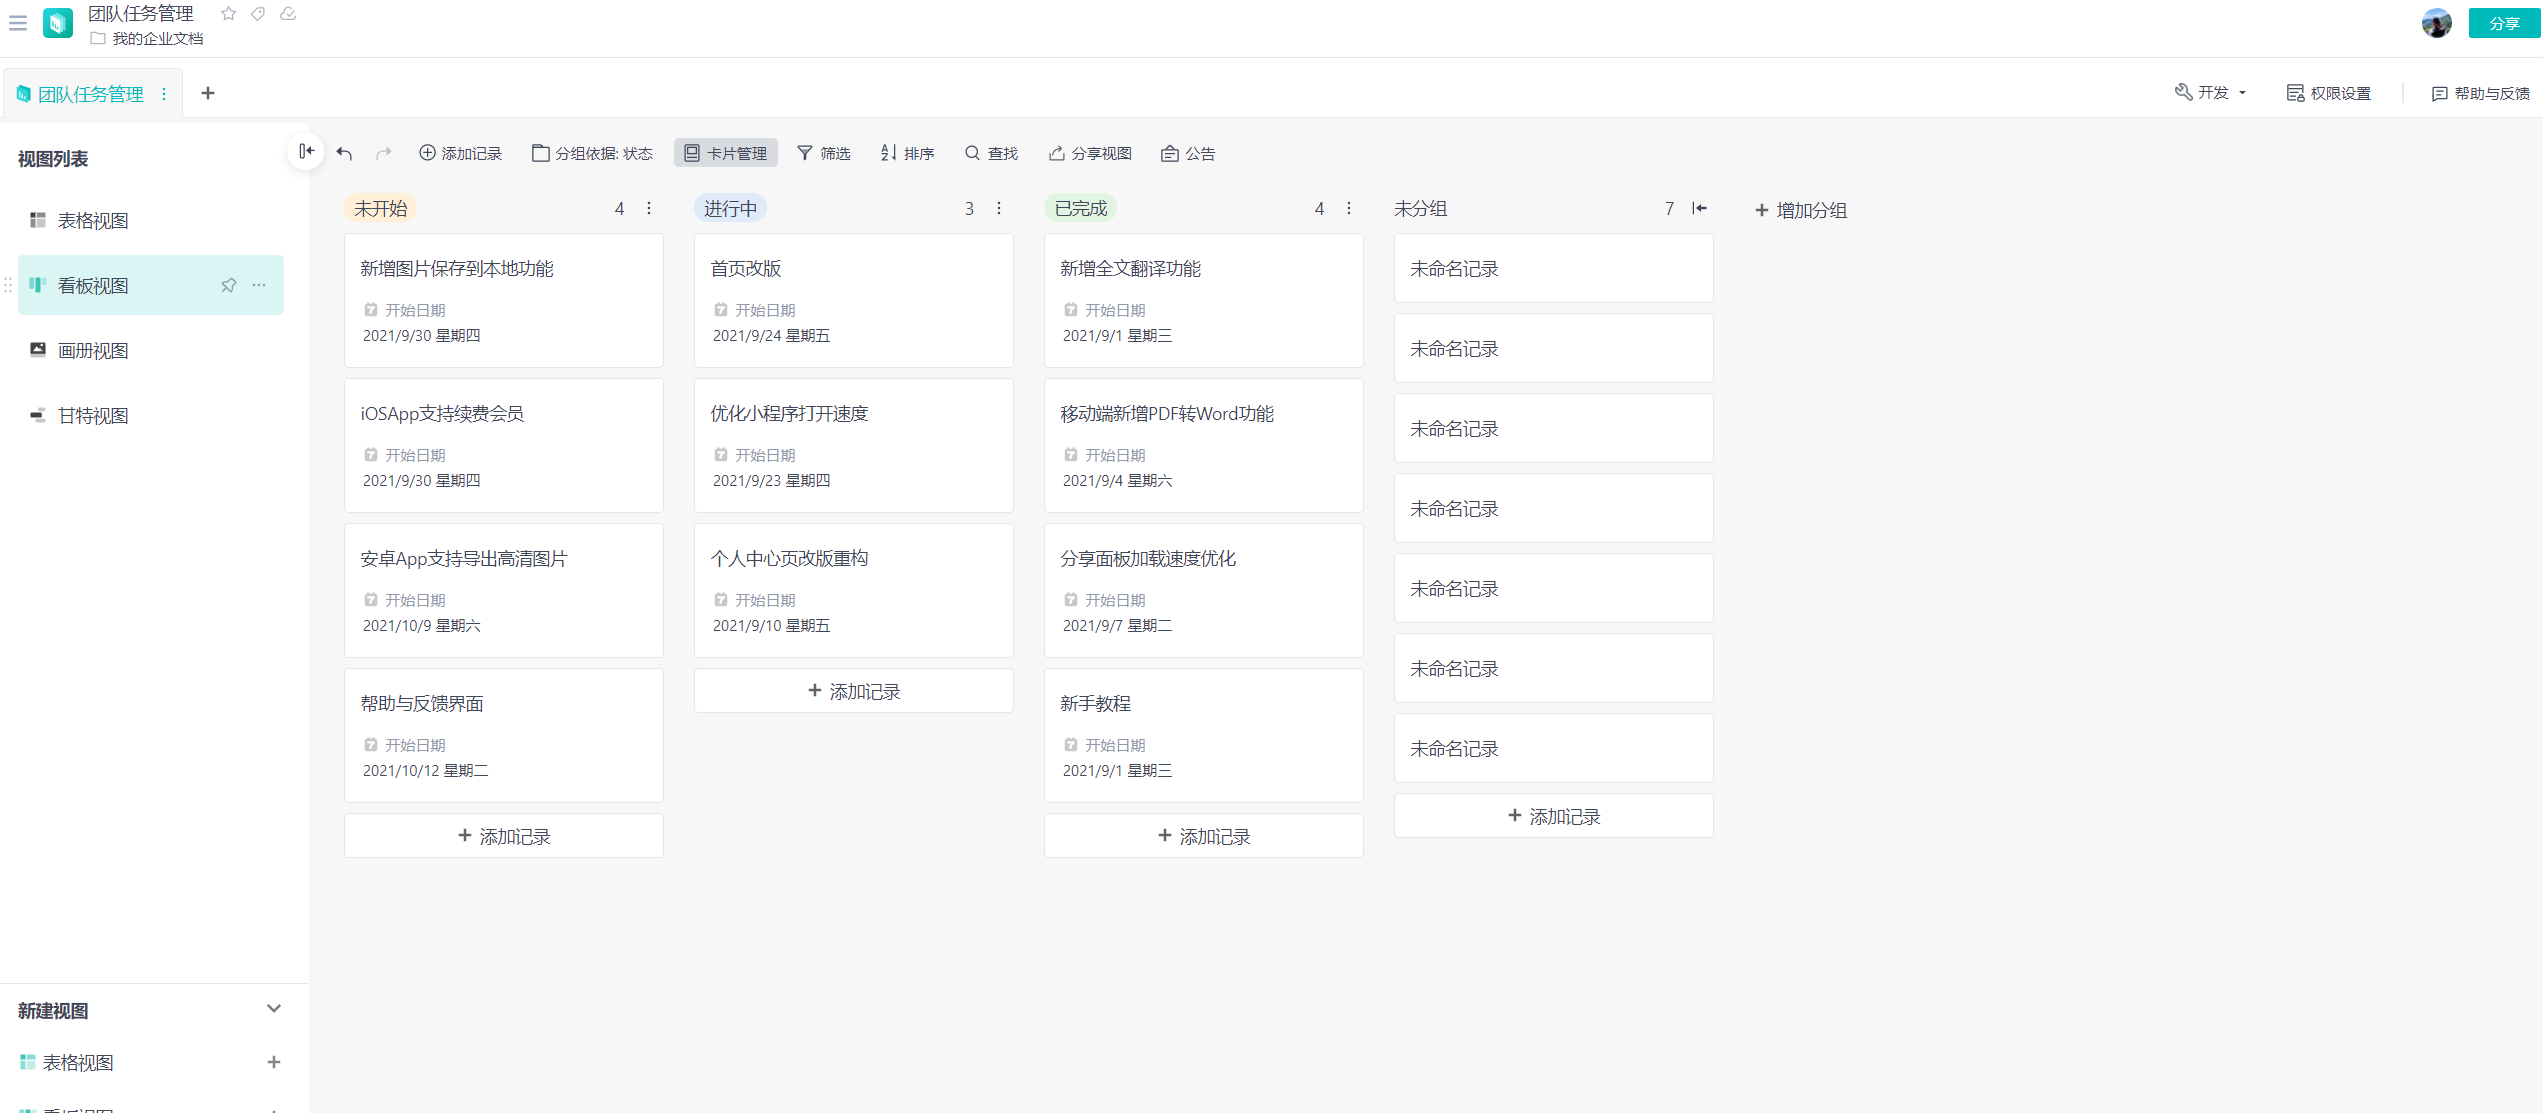
If we want to see the statistics of different categories of tasks, we can choose the Kanban view. The Kanban view automatically categorizes and displays data in grouped cards. We see that the current grouping basis of the table is grouping by status. You can also specify the grouping basis according to the actual situation and change the grouping effect, such as grouping by terminal. Click on the card to view all records under a certain option.
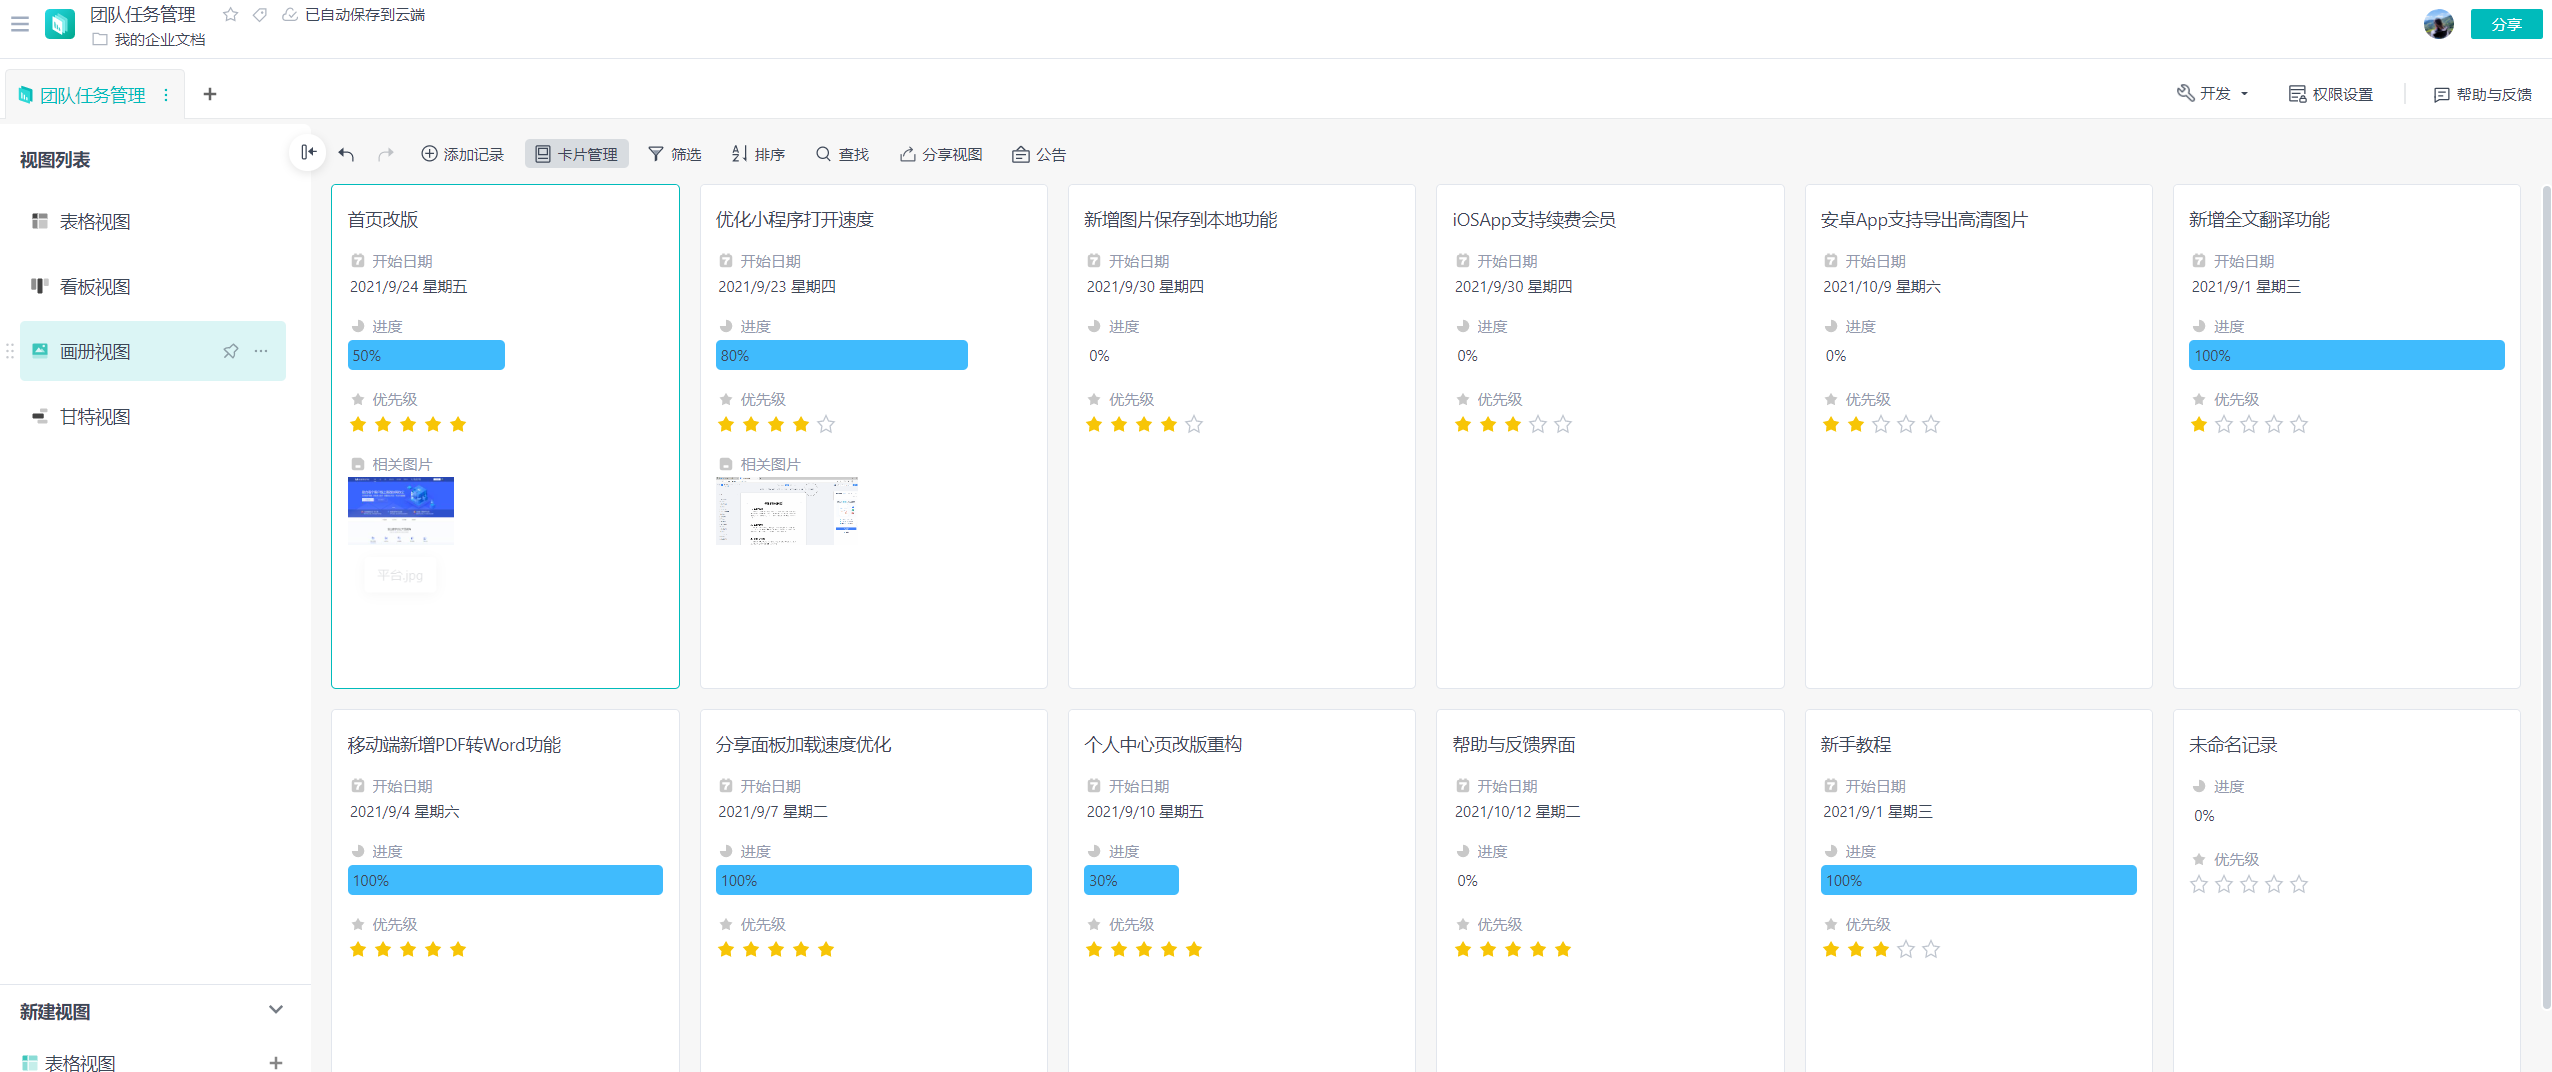
Album view
The album view is suitable for product management, product descriptions, etc. It uses pictures and attachments as the main body, and the data in it is displayed like a card. For example, an e-commerce company has product pictures, and you can click on the card to view the complete content of the corresponding record. See Add Image Field.
Gantt view
The Gantt view is suitable for viewing the progress of tasks. We can choose to view the progress of task completion according to the task cycle unit (click Weekly, Monthly and Quarterly).
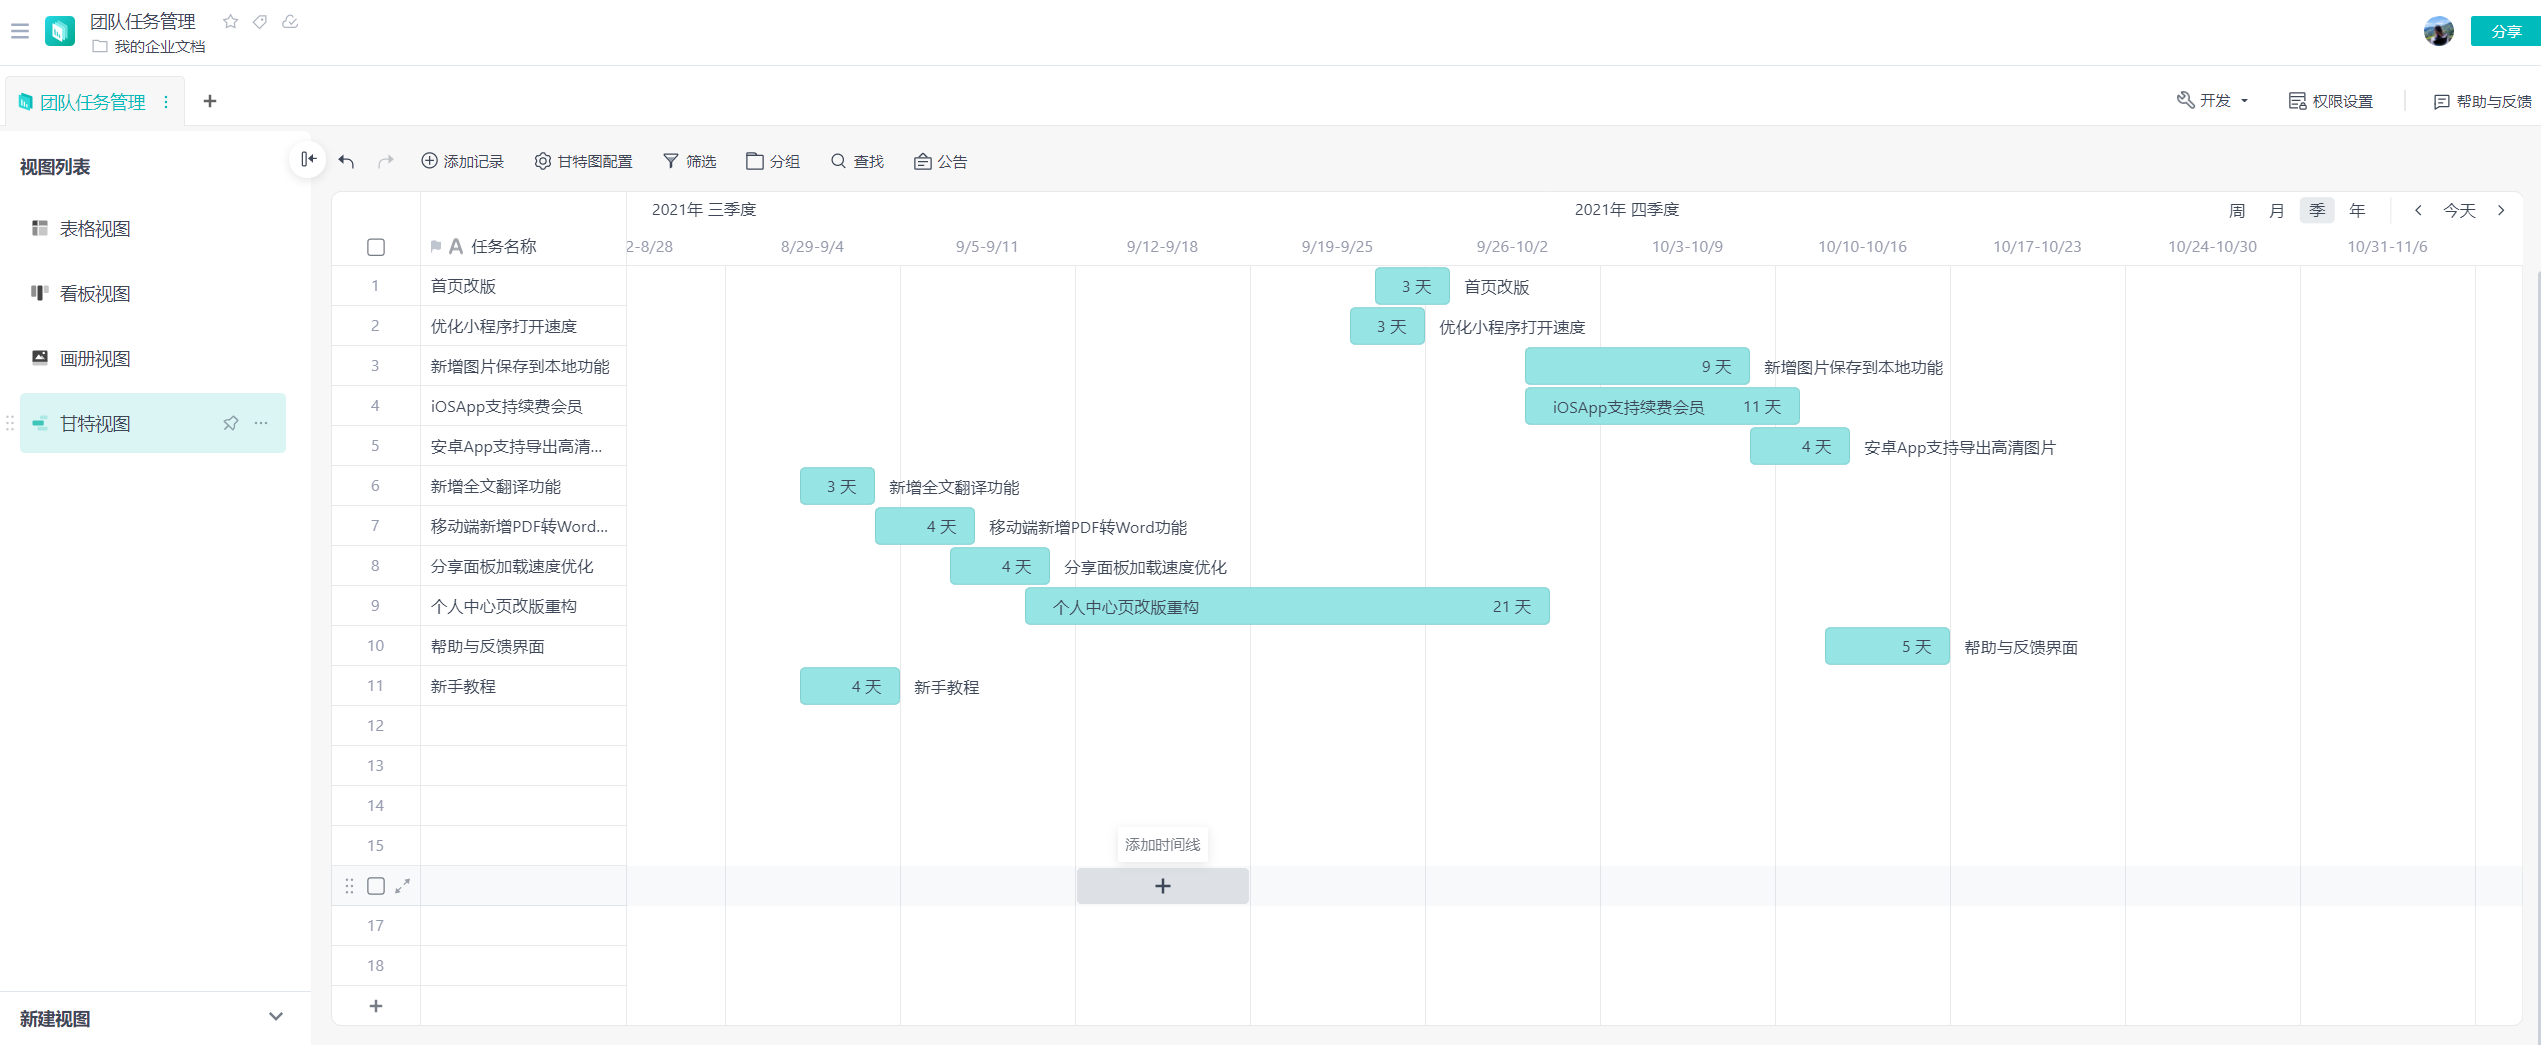
The source data of the three views comes from the table view. Not only can we display data through various views, but we can also share the data with others for collaborative work. Click [Share], set the corresponding permissions, and copy the link to the corresponding person to share the light dimension table with others.
Articles are uploaded by users and are for non-commercial browsing only. Posted by: Lomu, please indicate the source: https://www.daogebangong.com/en/articles/detail/WPS-365-qing-wei-biao-ru-men-li-yong-mu-ban-kuai-su-gou-jian-ren-wu-guan-li.html

 支付宝扫一扫
评论列表(196条)
测试