
I read a financial magazine in the United States today. In April this year, the number of employed people in the United States reached 253,000. This is a very small number, but it has hit the highest level in the past 12 months in the United States. Record, really stunned me!

I have to say that American young people are now starting to introvert themselves, not to mention anything else, you can see it from their PPT.
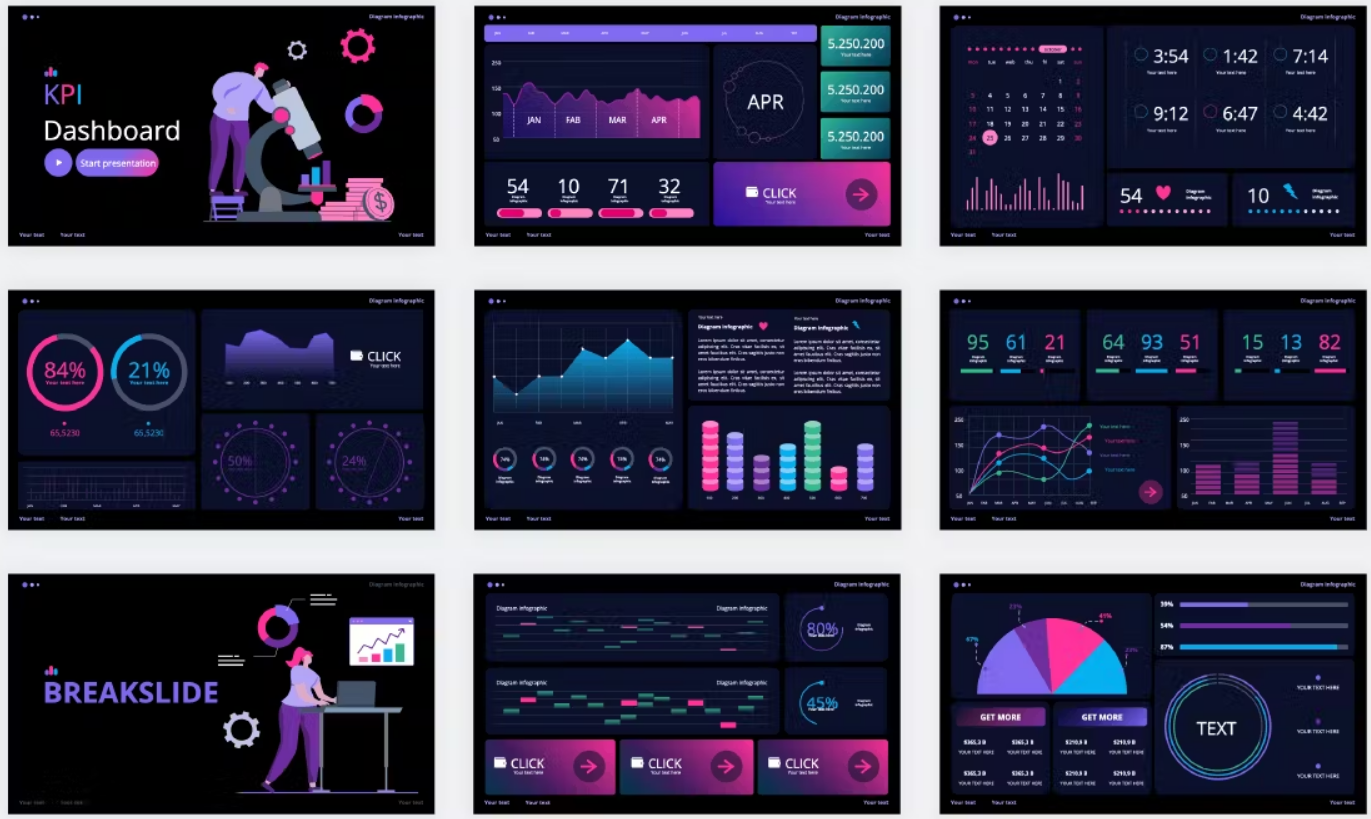
Although there are many tables and numbers on each page, the layout looks very advanced and comfortable.
At the end of the article, I recommend three template websites and pack a foreign PPT source file, be sure to read to the end~
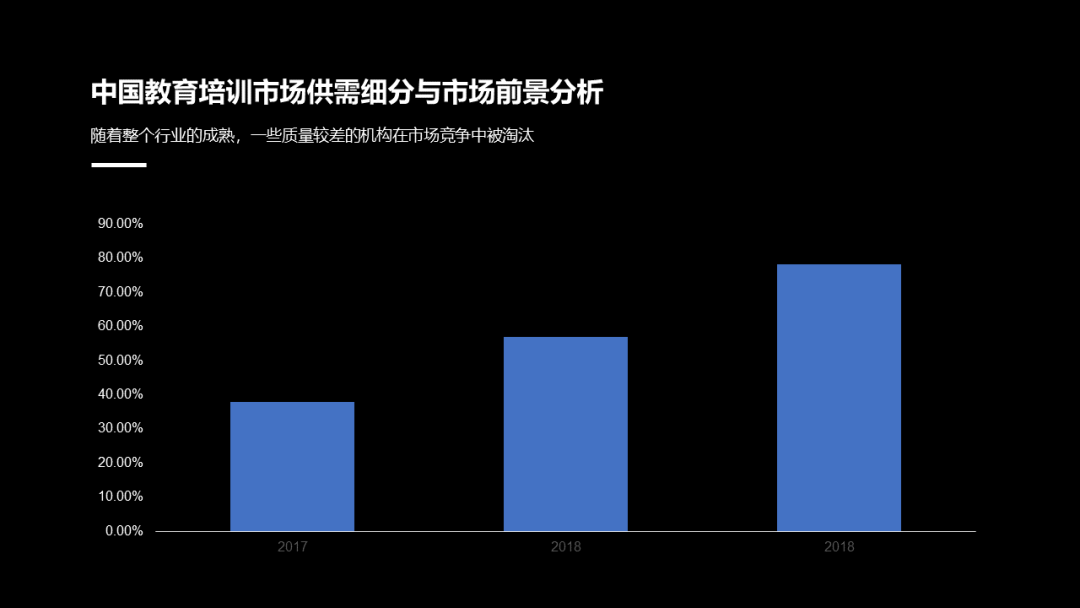
In fact, when we do PPT on the form page, we often encounter it. Is the typesetting of most people like this:
Although there is nothing wrong with it, it just looks dirty and messy. But if we can put a little effort into it, we can easily make creative PPT charts. like this:


Today’s article will teach you how to make several PPT forms
1. Histogram chart
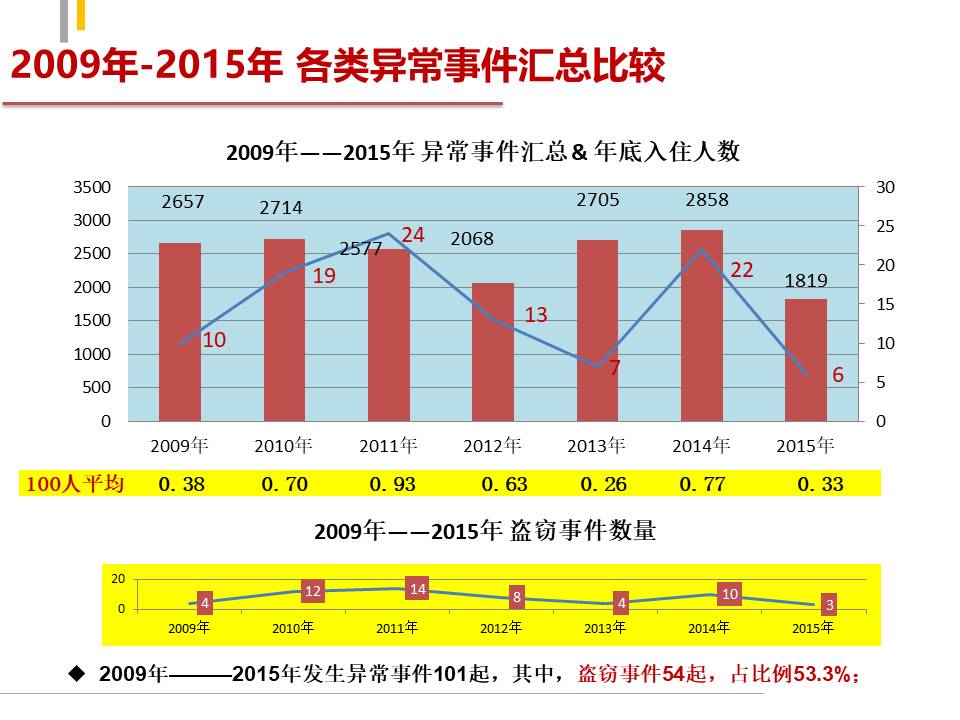
When we want to show changes in data, we know that most of the time we will use a line chart or a histogram, right?
But have you ever thought about it, if we change the form and change the histogram to a triangle shape, we can also make the chart like this:
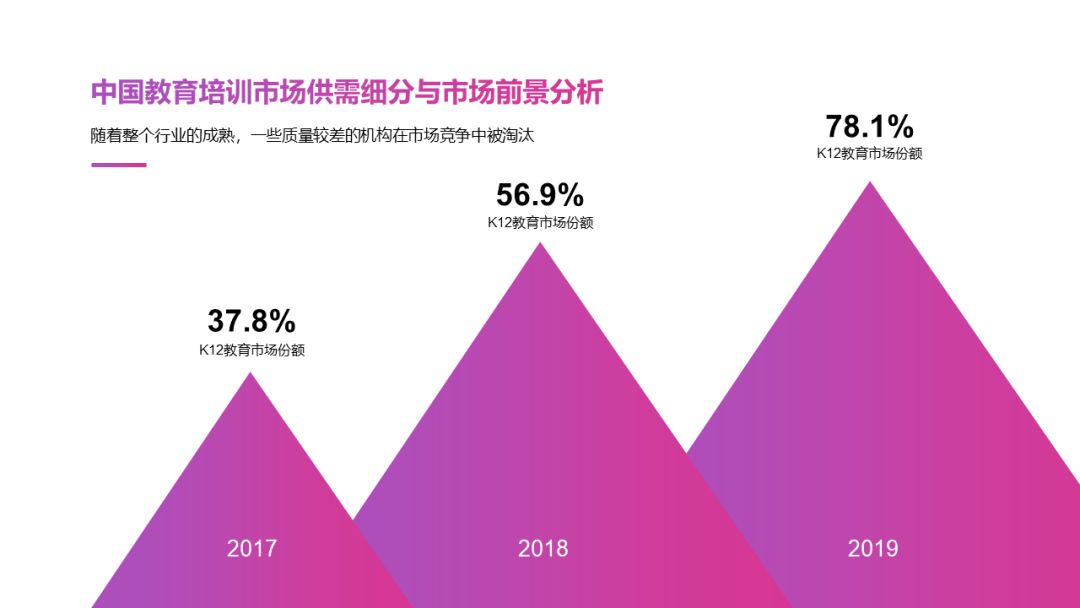
Or like this:
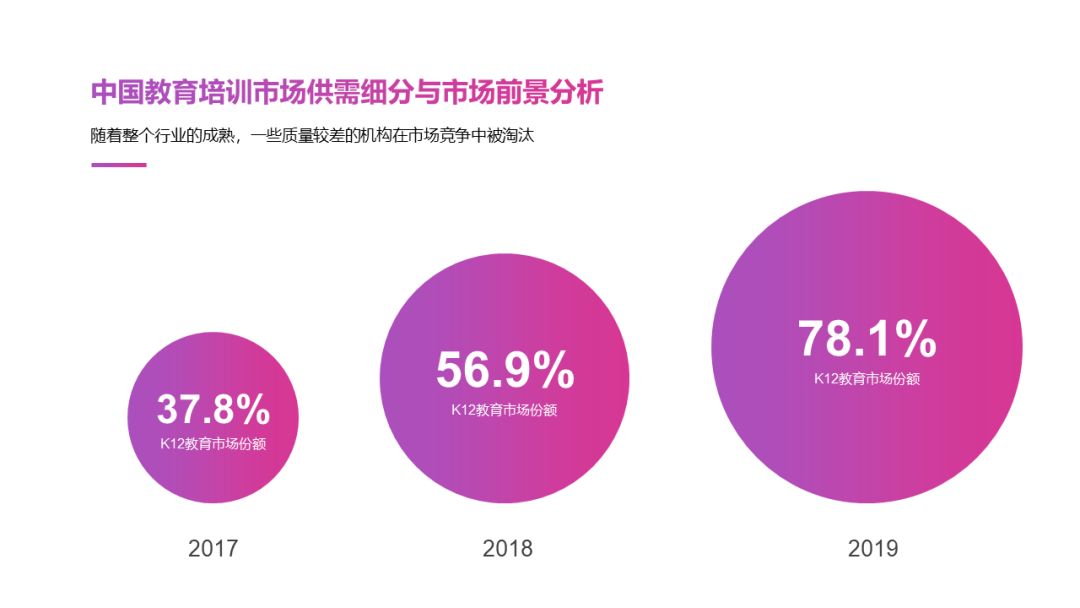
Of course, if we only want to simply show a few different numbers, we can also change the histogram to a rounded rectangle:

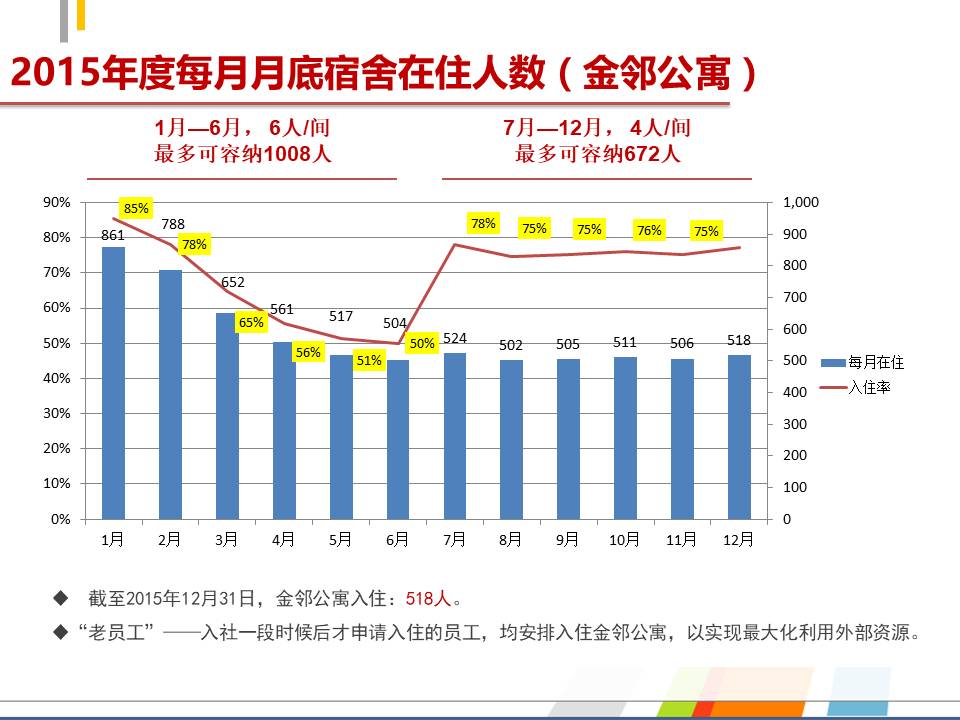
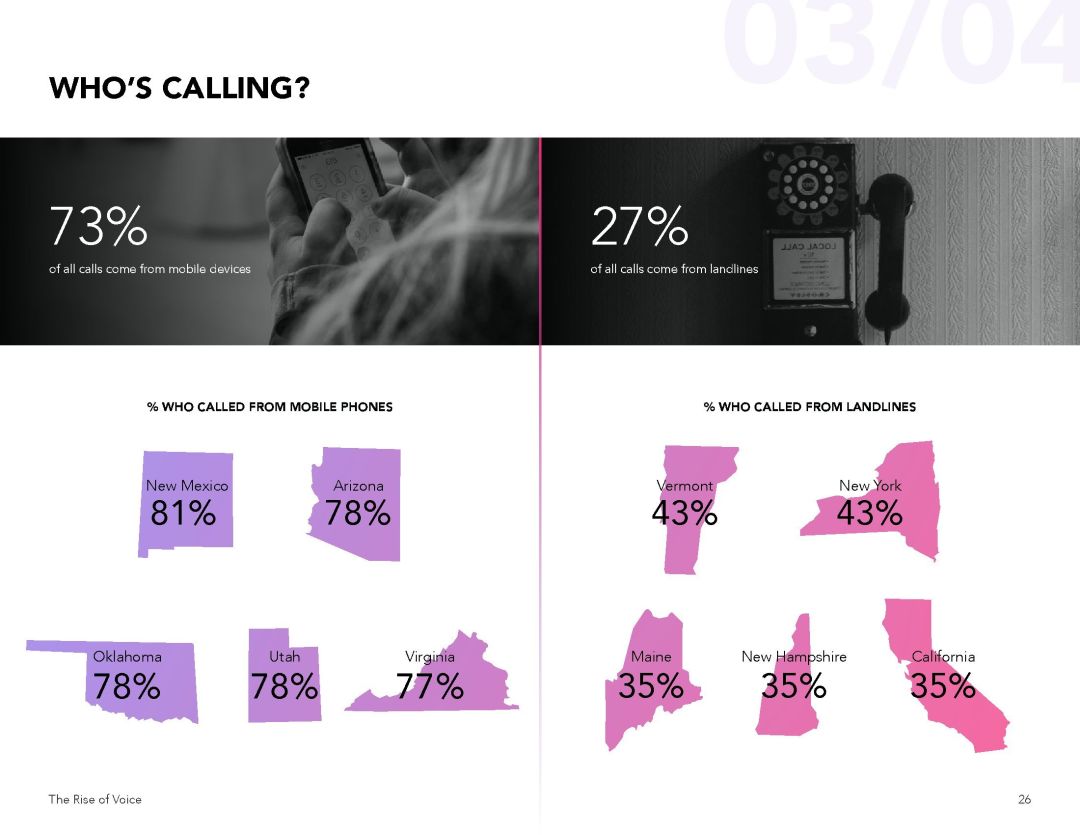
For another example, when we want to present data charts of several different regions, can we consider splitting them up and replacing them with map shapes?
In addition, I have also seen a more interesting data presentation form, changing the bar graph into a polyline with different amplitudes, and using the amplitude to represent the amount of data:

At the end of the article, I packed a PPT chart template for everyone, and you can apply it with one click. Be sure to read to the end~
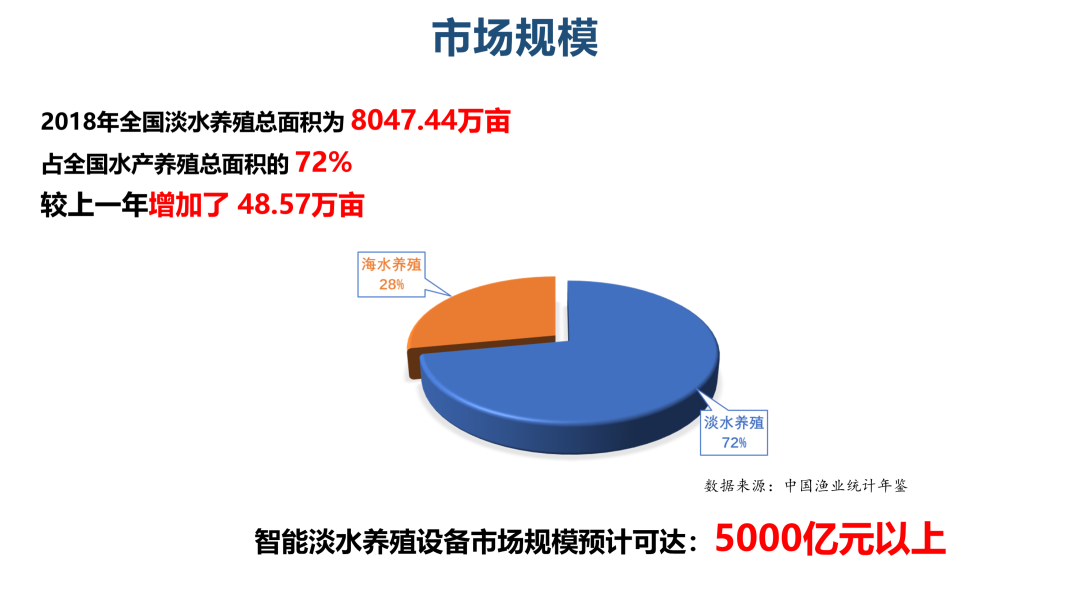
2. Three-dimensional chart
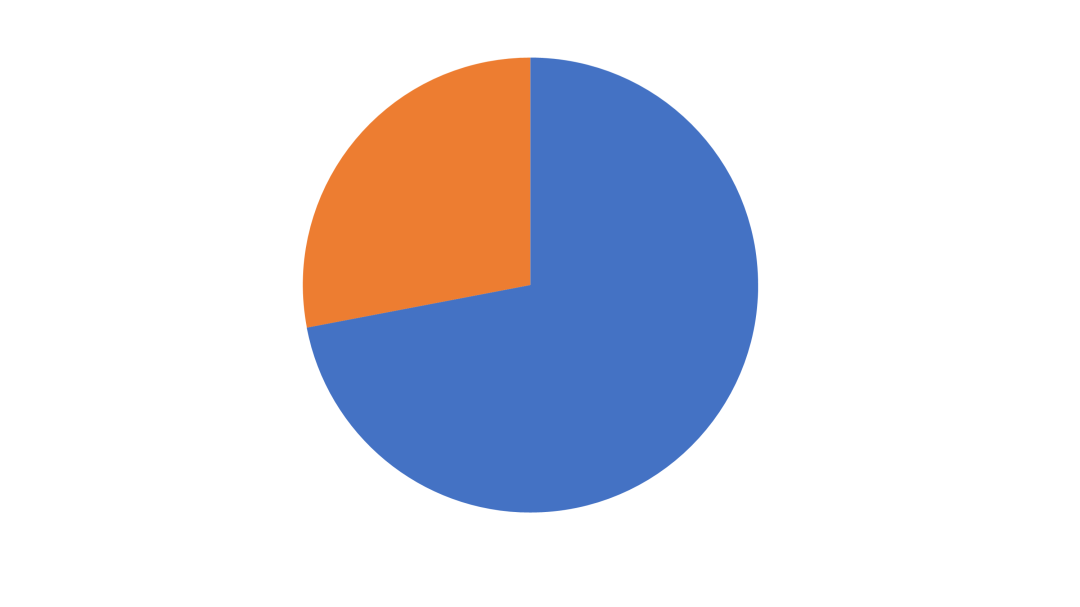
In addition to using the built-in basic shapes to complete the chart, we can also make some awesome 3D chart. Take this for example:
➊ In the first step, we insert a chart style and turn it into a vector graphic:
➋ The second step is to open it in the Ai software and adjust the parameters of the three-dimensional chart:
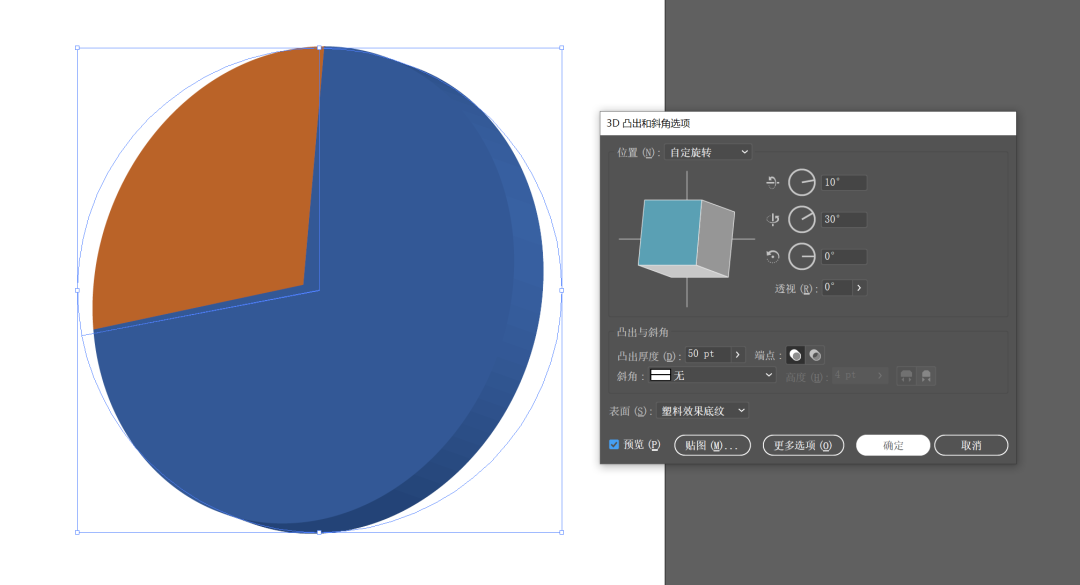
➌ The third step, drag the three-dimensional chart back to the PPT page, and adjust the color:

➍ Finally, simply layout the text information on the page:

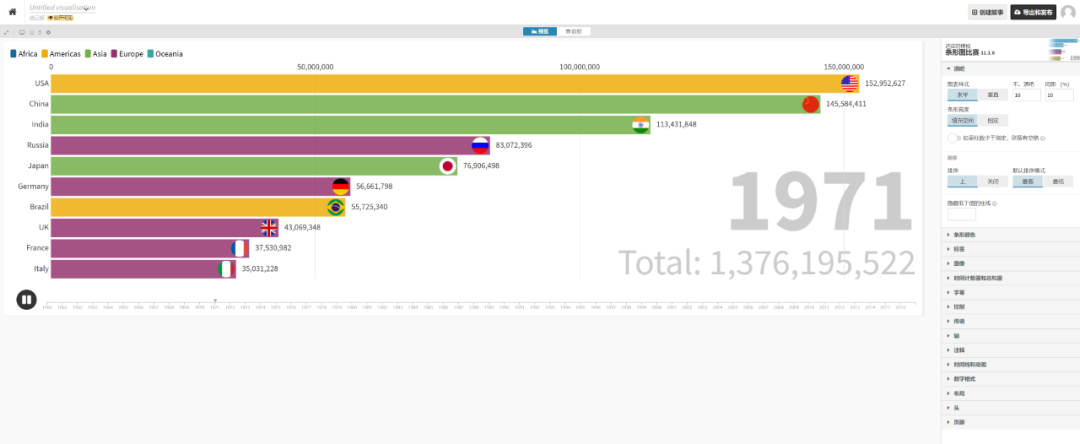
3. Dynamic data running score chart
As you can tell from the name, this is used to dynamically present data, mainly to show the change of numbers.
How is this chart made? You also need to borrow an online tool called flourish:
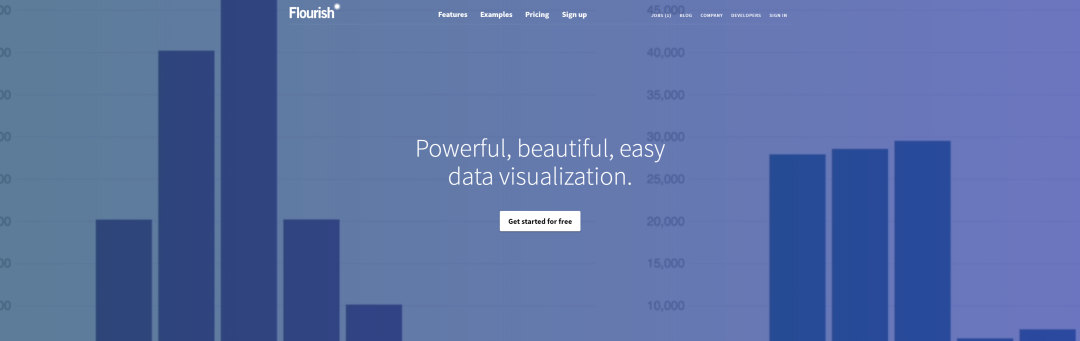
URL is: app.flourish.studio
Here, the dynamic running score chart ranks first. We click Make your own and choose to use this template:
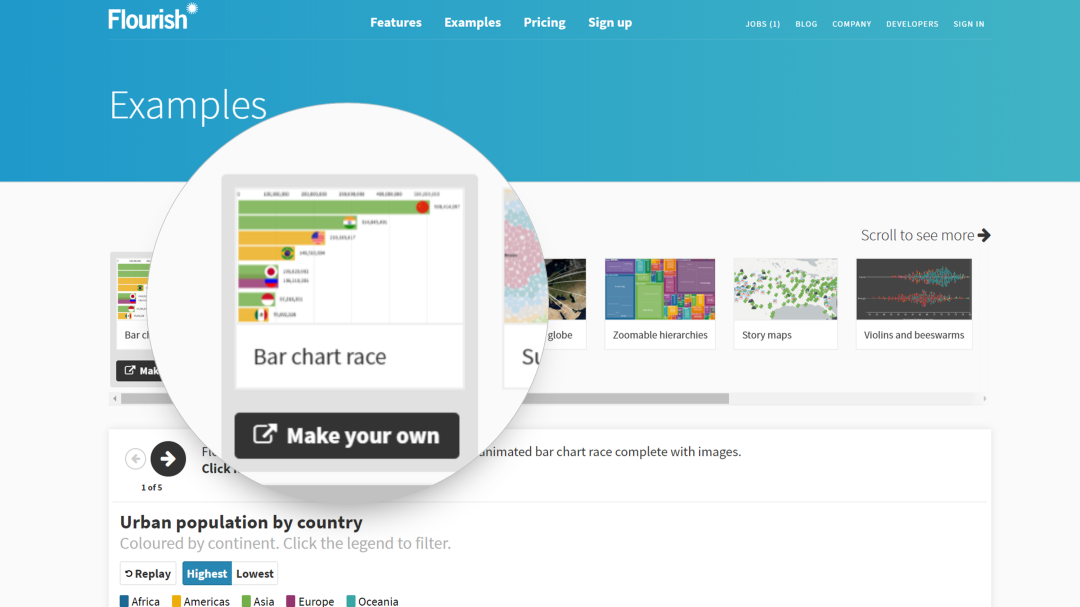
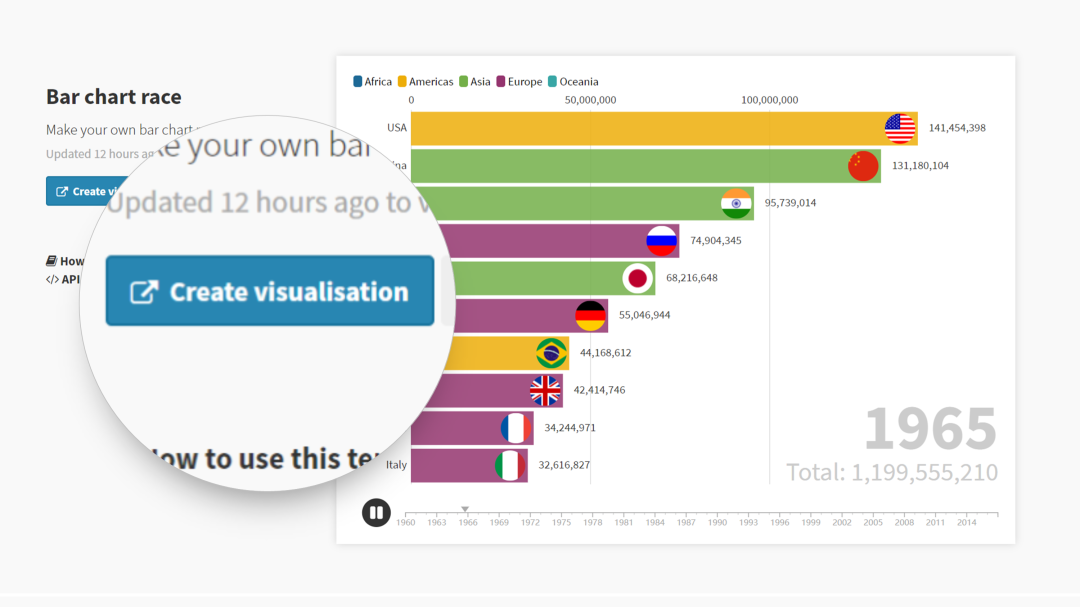
Then, click to enter and choose to create a visual chart:
The interface here is very simple, divided into two sections, one is to preview the dynamic chart, and the other is to modify the data:
Let's modify the data first:
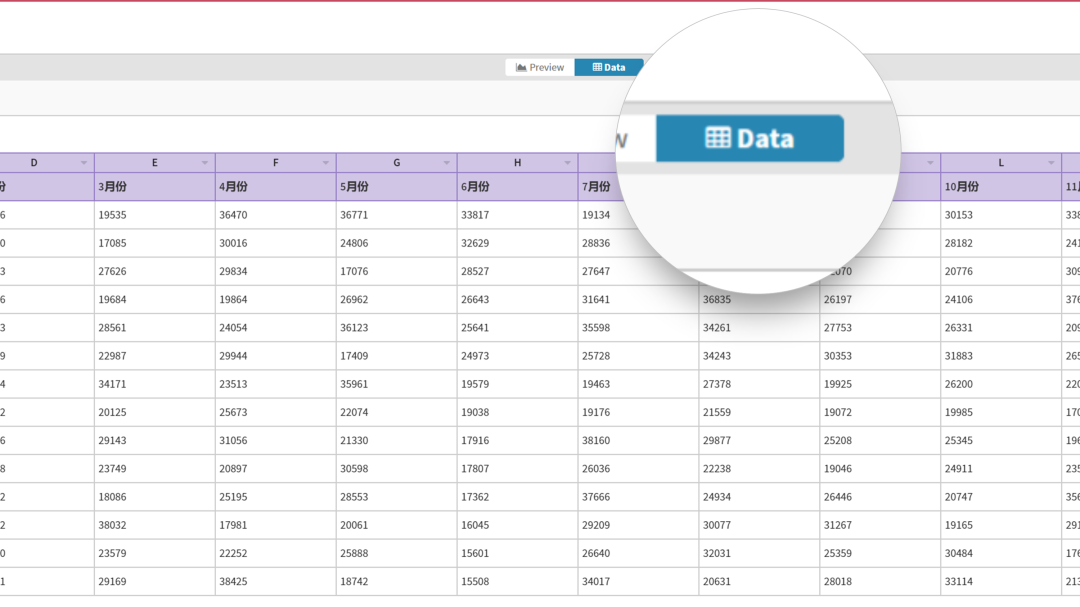
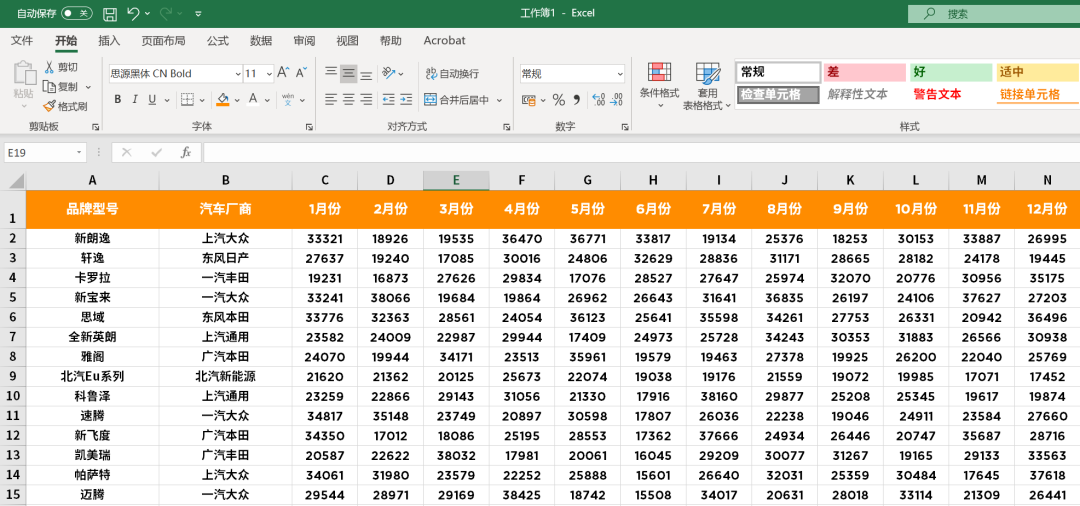
Here, we need to complete the data editing in Excel.
For example, we can make a data chart of changes in car sales ranking in 2019:
After uploading the data, return to the preview interface and it will look like this:
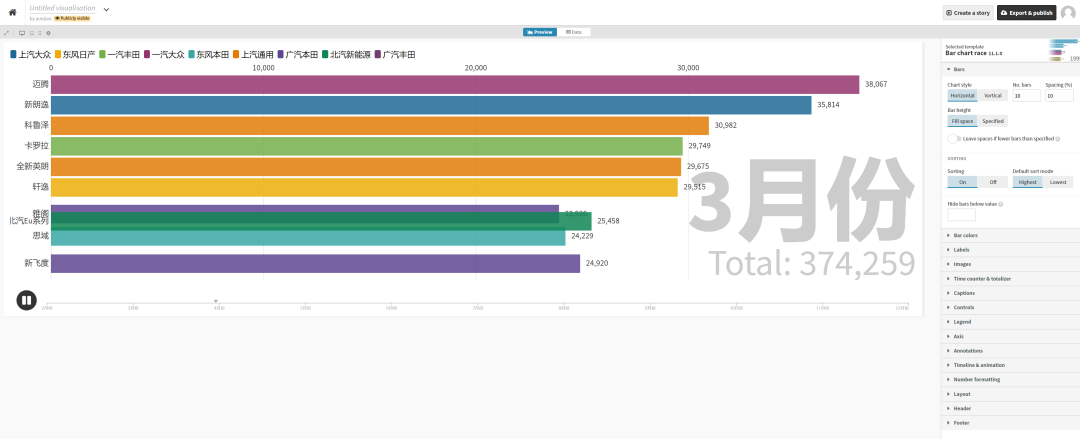
The styles presented here may not be what we want, but fortunately, all the styles here can be re-edited.
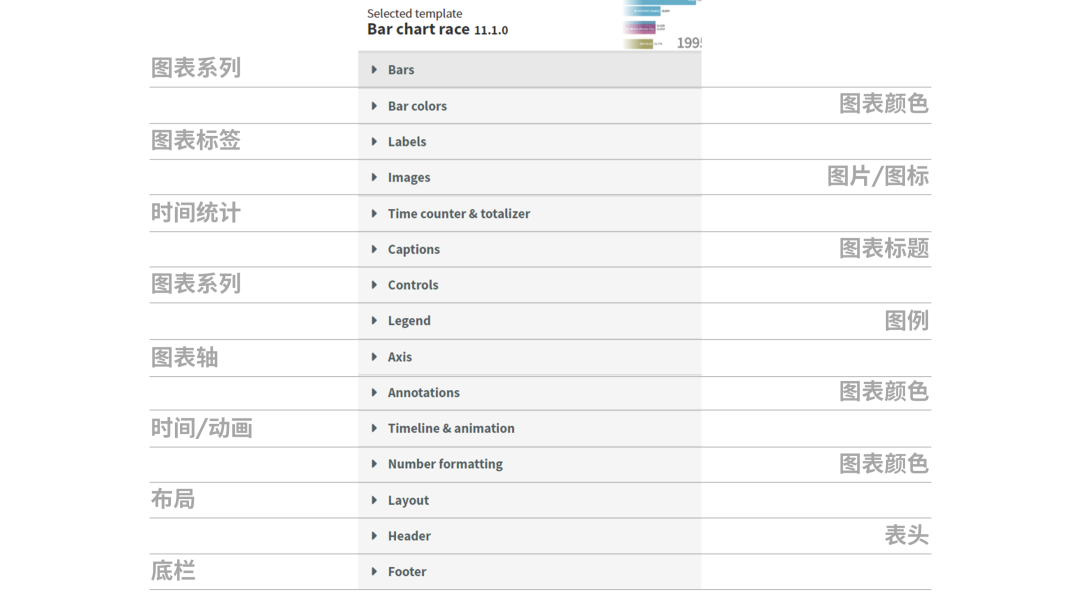
On the right side of the chart, there are very detailed parameter modifications:
After modifying it according to your own needs, you will come to a very critical step, the animation recording.
Because this website does not support exporting to Gif format, we need to use animation recording software to complete animation recording:< /span>
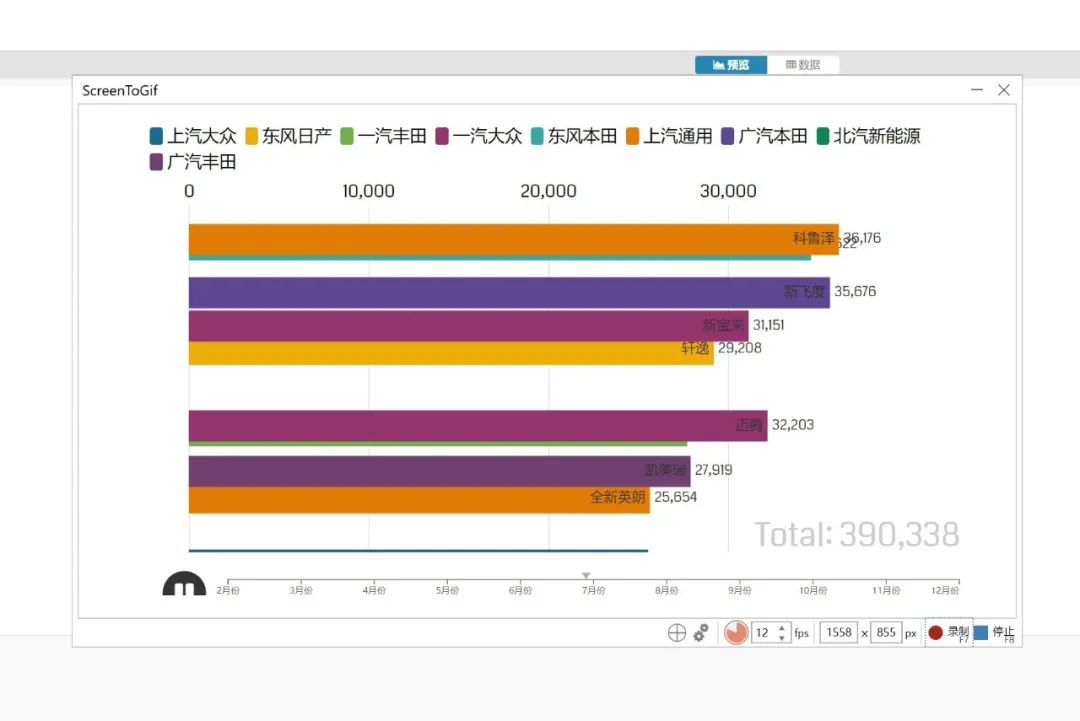
I am using ScreenToGif
Finally, insert the chart into the PPT page:

How about it? Isn't such a chart page instantly eye-catching?
If you still have no ideas about PPT charts, I have packaged a PPT chart template and foreign PPT source files for you and organized 3 PPT resource websites:
You can:

Articles are uploaded by users and are for non-commercial browsing only. Posted by: Lomu, please indicate the source: https://www.daogebangong.com/en/articles/detail/The%20popular%20PPT%20chart%20page%20on%20the%20Internet%20is%20so%20simple%20female%20colleague%20God%20taught%20me.html
 支付宝扫一扫
评论列表(196条)
测试