Ok, I'll do my best to assist you in drawing the thermometer and share some footage for you to use. The following is a simple tutorial: Step 1: Open the PPT and add the background color of the thermometer. Step 2: Use a circle from the Shape Toolbar to dr

**This sharing**

Taking the thermometer on the far left as an example, it is actually composed of four parts superimposed, as shown in the figure below. 
Among these "parts", whether it is shadow or highlight, they all build a three-dimensional world on the basis of two-dimensional graphics. To put it bluntly, there are no fixed rules, it is actually a visual experience. 
▲Design works of Dugu Xiaobian
Based on my little design experience, the most common but also the most important visual feature in the 3D world is just two words——< /span>< span> For example, the fourth figure, which looks like a shiny sphere, is actually just a combination of a circle and an ellipse. The circle has a color gradient from light to dark from the middle to the edge, while the transparency of the ellipse gradually increases from top to bottom, so there is a fading effect. These can all be set in the shape format of the graph. 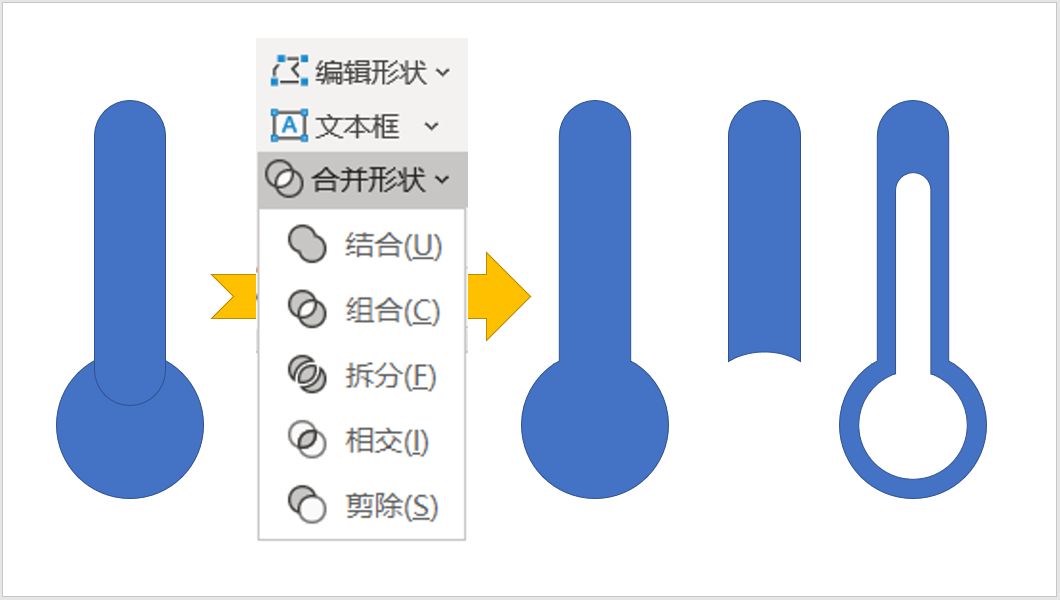
The original standard shape in non-ppt can be realized by merging shapes, such as “combine”“cut " and so on are actually the graphic Boolean functions in ppt. 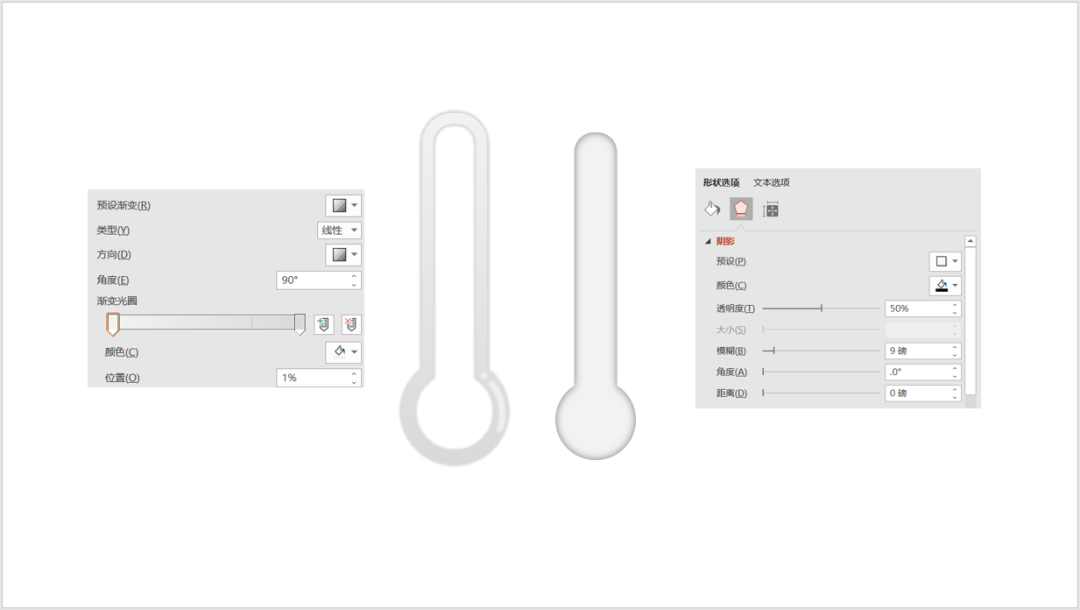
Based on this, the following effects can be made by using the fill gradient or the shadow effect in the three-dimensional format. 
Finally, the tick mark can be realized by copying multiple short lines and using the alignment tool in the arrangement tool. Horizontal distribution and vertical distribution can realize uniform arrangement between graphics. 
Superpose and align the above layers in order to get the final rendering. 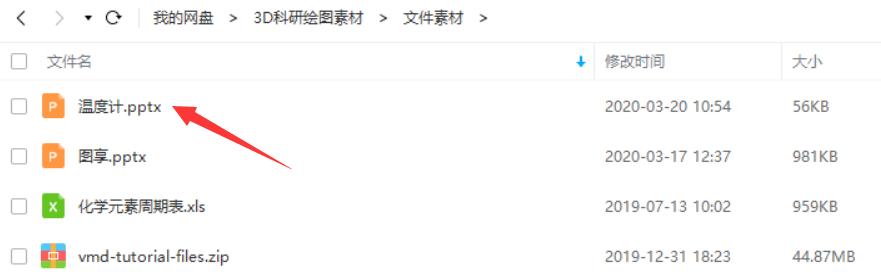
This material has been uploaded to the link of "Drawing Tutorial>>Material Sharing" in the official account menu, and you can download it yourself. 
Sphere - a bridge between science and art
Our design team is a professional master and doctor team with profound scientific research background, and is committed to providing the most thoughtful scientific research image design services for the majority of scientific research workers. Customers are all over the world, including MIT, Stanford, Cornell, Chinese Academy of Sciences, Tsinghua University, Peking University and other universities and scientific research institutions, and are well-known at home and abroad. The work was selected as the cover of CNS, JACS, Chem and other journals, and was invited to make popular science animation for it. There is also the largest public account for scientific research and mapping teaching in China "3D Research and Drawing", which has provided professional drawing lectures and training for Zhejiang University, Fudan University, Wuhan University, Dalian Institute of Chemical Physics, Chinese Academy of Sciences, etc. The total number of online and offline audiences exceeds ten million people.

Articles are uploaded by users and are for non-commercial browsing only. Posted by: Lomu, please indicate the source: https://www.daogebangong.com/en/articles/detail/Simple%20tutorial%20and%20material%20sharing%20of%20ppt%20drawing%20thermometer.html
 支付宝扫一扫
评论列表(196条)
测试