Hello everyone, I have been confused recently when using Seaborn to draw. Considering that Seaborn is based on Matplotlib, I am used to using the Matplotlib method of setting font size, but when using Seaborn, it is somewhat different. Let’s take a look today~
Set the font in seaborn drawing< /span>
Seaborn is based on Matplotlib, which is based on Python, and Python runs on the computer system.
Therefore, to use a certain font in Seaborn, the font must meet the following conditions :
- The font is installed in the system;
- Python can retrieve this font;
- This font can be retrieved from the Matplotlib font cache;
- Set to use this font in Seaborn when drawing.
1.1 Install fonts on your computer
Take the "Wenquanyi Micron Black" font as an example. The downloaded font installation package is "Wenquanyi Micron Black.ttf". Double-clicking it will automatically open the font manager that comes with the system. Click to install.
The above operations can be implemented on Windowns 10 and Ubuntu. I have never used Mac OS, so the process should be similar.
1.2 Let Python retrieve fonts
If Python is not running when installing fonts, There should be nothing to do.
If Python is running when installing the font, you need to restart the Python environment. Using Jupyter Notebook, you can simply restart the kernel.
1.3 Update Matplotlib font cache
It is not possible to install fonts in Seaborn and When used in Matplotlib, you need to update Matplotlib's font cache first. code show as below. Here you only need to use the matplotlib.font_manager package. Since you will be making figures later, pandas、seaborn< /span>, matplotlib.
import pandas as pdimport seaborn as snsfrom matplotlib import pyplot as pltimport matplotlib.font_manager as font_manager%matplotlib inlinefont_manager._rebuild()1.4 Using fonts in Seaborn
To use fonts, you must first know the font name. Use the following command to view the font names in Matplotlib's font cache.
for font in font_manager.fontManager.ttflist: print(font)<Font 'STIXSizeOneSym' (STIXSizOneSymReg.ttf) normal normal 400 normal><Font 'cmss10' (cmss10.ttf) normal normal 400 normal> ; & lt; font 'stixNonicode' (StixNonuni.ttf) Normal normal 400 NORMAL & GT; & LT; Font 'StixSizeFousym' Al 700 NORMAL & GT; & LT; FONT 'StixSizeOneSym' ;Font 'STIXSizeFourSym' (STIXSizFourSymReg.ttf) normal normal 400 normal><Font 'DejaVu Sans Mono' (DejaVuSansMono.ttf) normal normal 400 normal><Font 'STIXGeneral' (STIXGeneralItalic.ttf) italic normal 400 normal>. ..Take "WenQuanYi Micro Hei" as an example and find the font name "WenQuanYi Micro Hei". This value can later be specified in the font parameters.
Seaborn is based on Matplotlib, so setting the Seaborn font parameters is setting Matplotlib. The following command displays Matplotlib's default font.
print(plt.rcParams["font.family"])print(plt.rcParams['font.sans-serif'])['sans-serif']['DejaVu Sans', 'Bitstream Vera Sans', 'Computer Modern Sans Serif', 'Lucida Grande', 'Verdana', 'Geneva', 'Lucid', 'Arial', 'Helvetica', 'Avant Garde', 'sans-serif'] rcParams is the parameter configuration dictionary for Matplotlib runtime , including various settings. The above prints out the values of two keys related to font settings.
The value of font.family is the default font family. Currently sans-serif. There are only four font families recommended by Matplotlib: fantasy, monospace, sans-serif, serif.
font.sans-serif The value is the font familysans-serif is a list of font names. When drawing, Matplotlib will prioritize the use of font names from front to back in the list. previous font.
So to use the specified font, you can add the font name to the font familysans-serif in the font list contained in it, put it at the front of the list, and then assign it to font.sans-serif.
In fact, there are two ways to set fonts, but they are not recommended:
- Change the value of font.family to the specified font name. Reason for not recommending: What is changed here is the default font family, and there are only four font families recommended by Matplotlib. Moreover, a font family contains several fonts. When the content cannot be displayed using the priority font, Matplotlib will use the second priority font. If you specify a font family as a single font, Matplotlib can only use that one font.
- Use span>seaborn.set() font parameter specifies the font. Reason for not recommending: This method actually modifies the font.family font family. The reason for not recommending is the same as above.
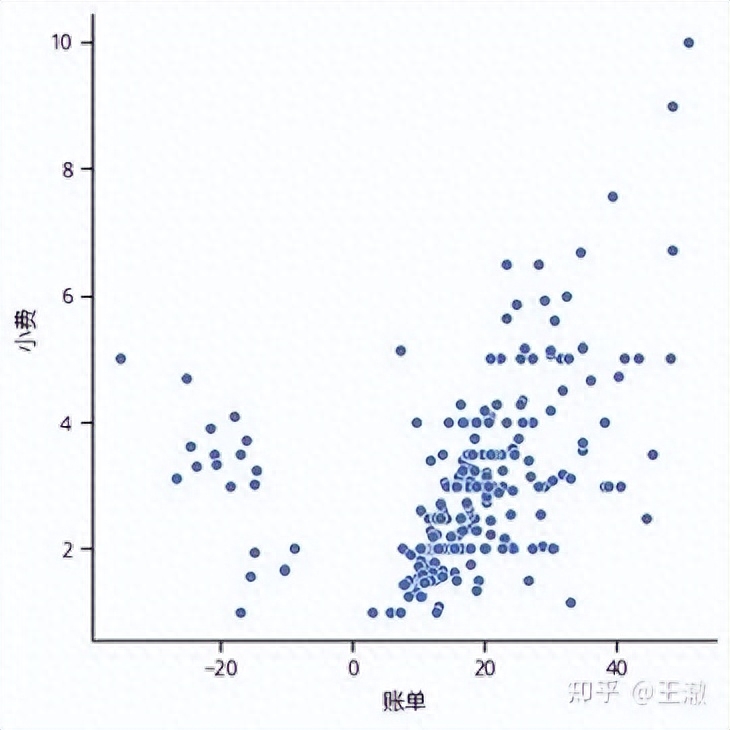
The method has been found. Here is a simple practical operation. The specific setting is to use the seaborn.set() function. ; --tt-darkmode-color: #4141FF;">rc parameters to modify Matplotlib's rcParams< sans-serif font list in /span>.
tips = pd.read_csv('seaborn-data-master/tips-zh.csv')rc = {'font.sans-serif': ['WenQuanYi Micro Hei', 'DejaVu Sans', ' Bitstream Vera Sans']}sns.set(context='notebook', style='ticks', rc=rc)g = sns.relplot(x='bill', y='tip', data=tips)
Set font size in Seaborn
There are two ways to set the font size in Seaborn drawing:
- Useseaborn.set() font_scale parameter, this method uses the font size in the selected seaborn style as the basis to enlarge the font by the specified multiple.
- In various In the text setting function, use the fontsize parameter to specify the font size.
2.1 Use the font_scale parameter to set the font size
It's very simple. Assign a number to font_scale and seaborn will automatically enlarge the font.
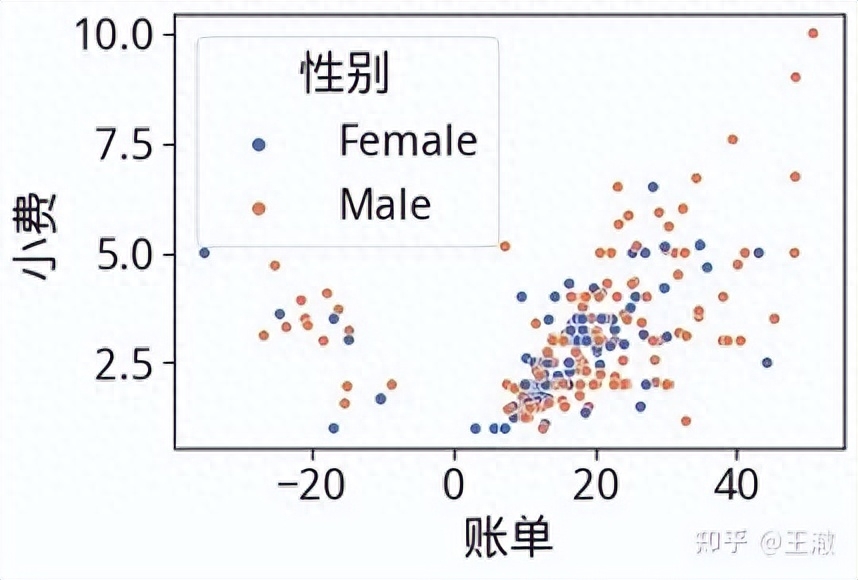
A simple example is as shown below and code. In the picture, the font of the built-in style is enlarged 2 times.
sns.set(context='notebook', style='ticks', font_scale=2, rc=rc)ax = sns.scatterplot(x='bill', y='tip', hue= 'Gender', data=tips)
2.2 Use the fontsize parameter to set the font size
Seaborn draws images into FacetGrid level images and ax level diagrams. This method only works on ax level graphs.
Use the fontsize parameter in the following function to specify the fonts at different positions Size, ax variable is an ax-level image object, taking the setting to size 14 as an example:
- ax.set_xticklabels( fontsize=14), set the X coordinate axis scale label font
- ax.set_yticklabels(fontsize=14), set the Y coordinate axis tick label font
- ax.set_ylabel(fontsize=14), set the Y coordinate axis label Font
- ax. set_xlabel(fontsize=14), set the X coordinate axis label font
- ax.set_title(fontsize=14), set the title font
- ax.legend(title = "Gender", fontsize = 14, title_fontsize = 14), Set the legend title, legend title font size, and legend font size
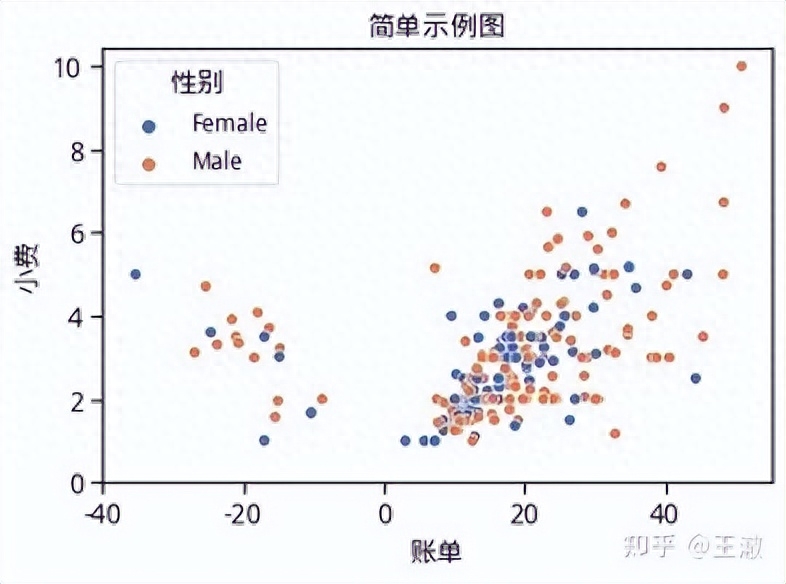
See the picture and code below for simple practical operations.
ax = sns.scatterplot(x='bill', y='tip', hue='gender', data=tips)x = [-40, -20, 0, 20, 40]ax .set_xticks(x)xlabs = [-40, -20, 0, 20, 40]ax.set_xticklabels(xlabs, fontsize=14) #Set the X coordinate axis scale label font y = [0, 2, 4, 6, 8, 10]ax.set_yticks(y)ylabs = [0, 2, 4, 6, 8, 10]ax.set_yticklabels(ylabs, fontsize=14) #Set the Y coordinate axis scale label font ax.set_ylabel('Tip ', fontsize=14) #Set the Y-axis label font ax.set_xlabel('Bill', fontsize=14) #Set the X-axis label font ax.set_title('Simple example picture', fontsize=14) #Set the title font ax.legend(title = "Gender", fontsize = 12, title_fontsize = 14) #Set legend title, legend title font size, legend font size
Author: Wang Che
Articles are uploaded by users and are for non-commercial browsing only. Posted by: Lomu, please indicate the source: https://www.daogebangong.com/en/articles/detail/Seaborn-hui-tu-zhong-she-zhi-zi-ti-ji-da-xiao.html

 支付宝扫一扫
评论列表(196条)
测试