Content overview:
1. A set of reporting methodology.
2. 6 practical skills for PPT reports.
3. These 12 small skills will make your PPT faster and taller.
4. Template material case.
1. Reporting methodology
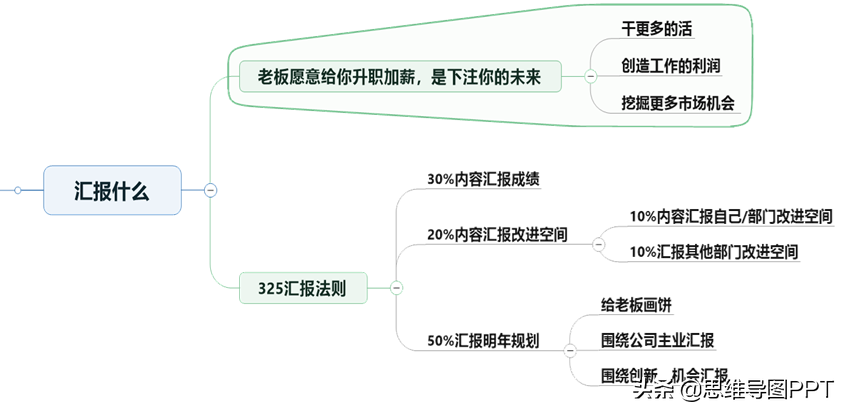
(1) What can be reported to impress the boss?
(2) How to report to impress the boss?

2. Reporting skills
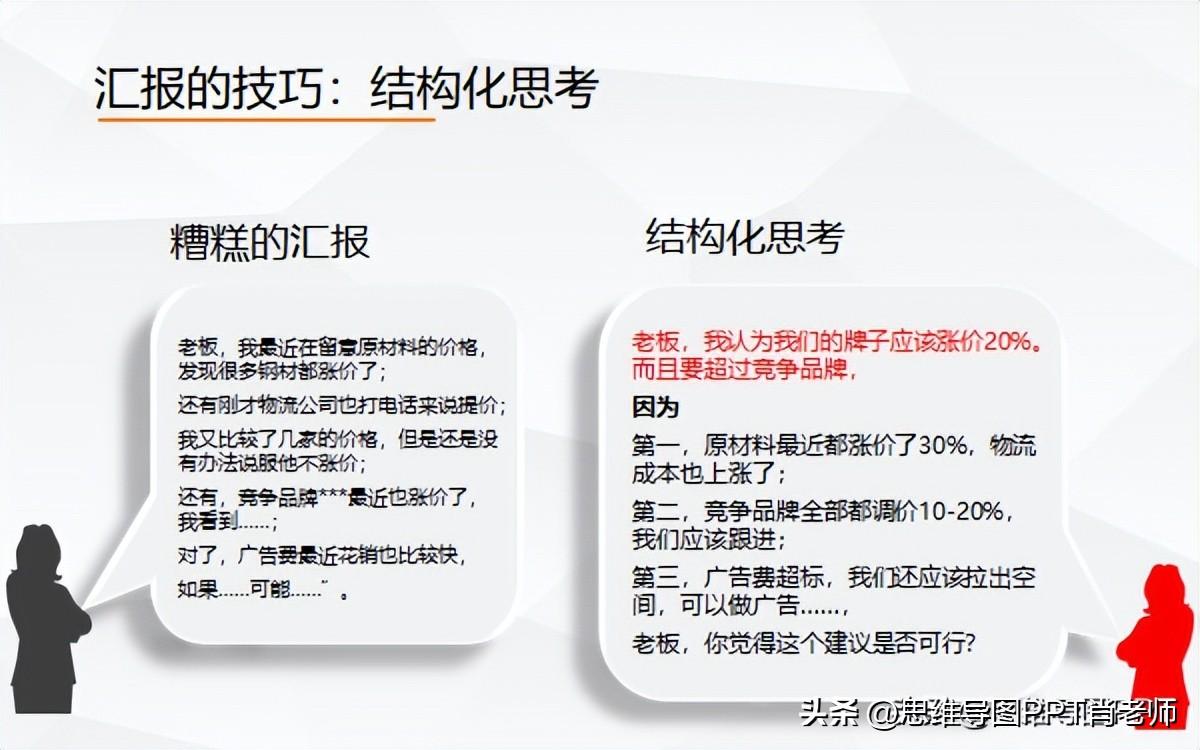
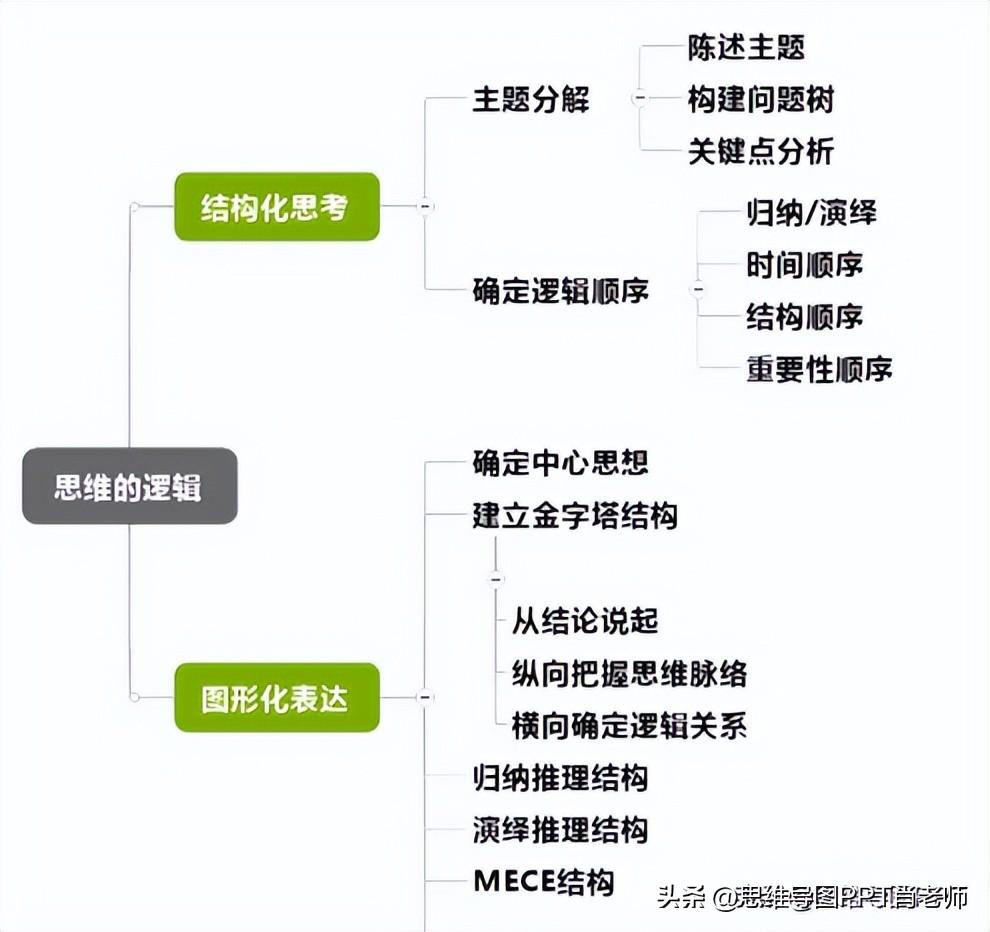
(1) Structured thinking.
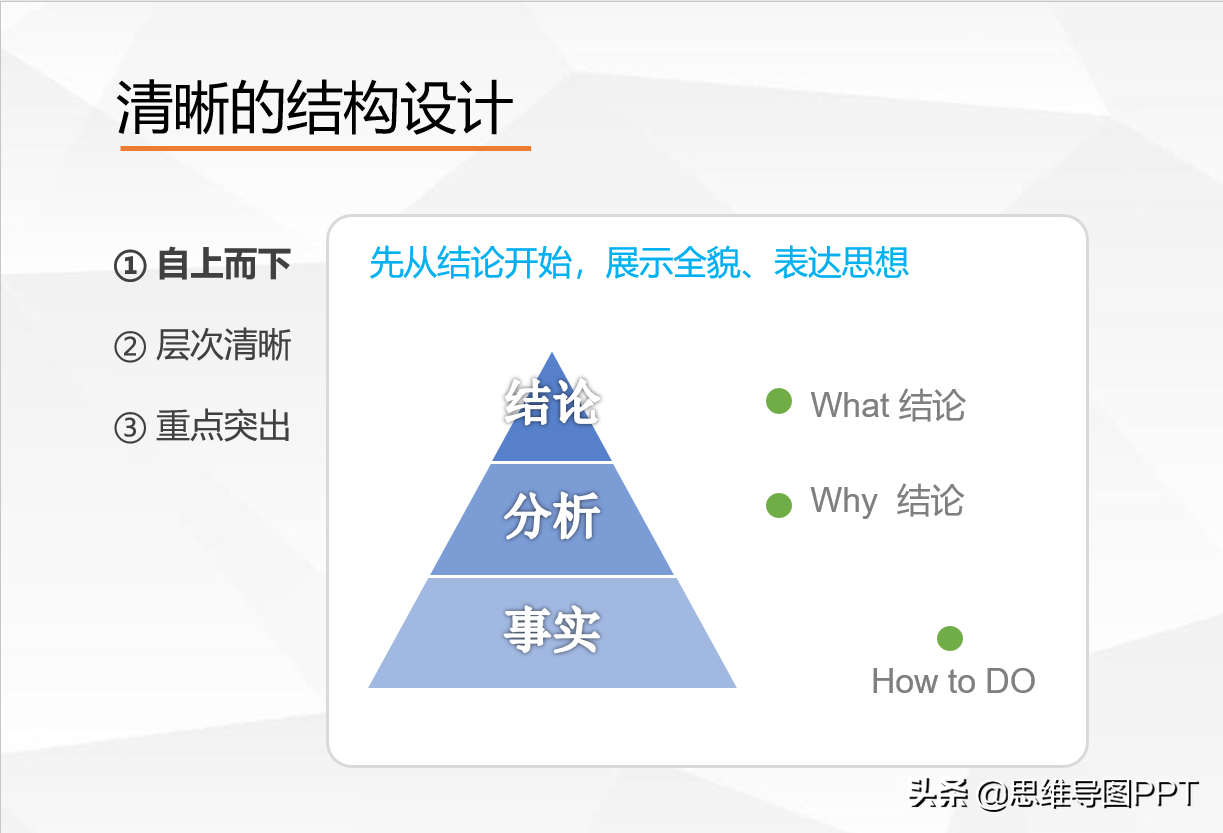
(2) Top-down design structure: start with the conclusion, show the whole picture, and express ideas.
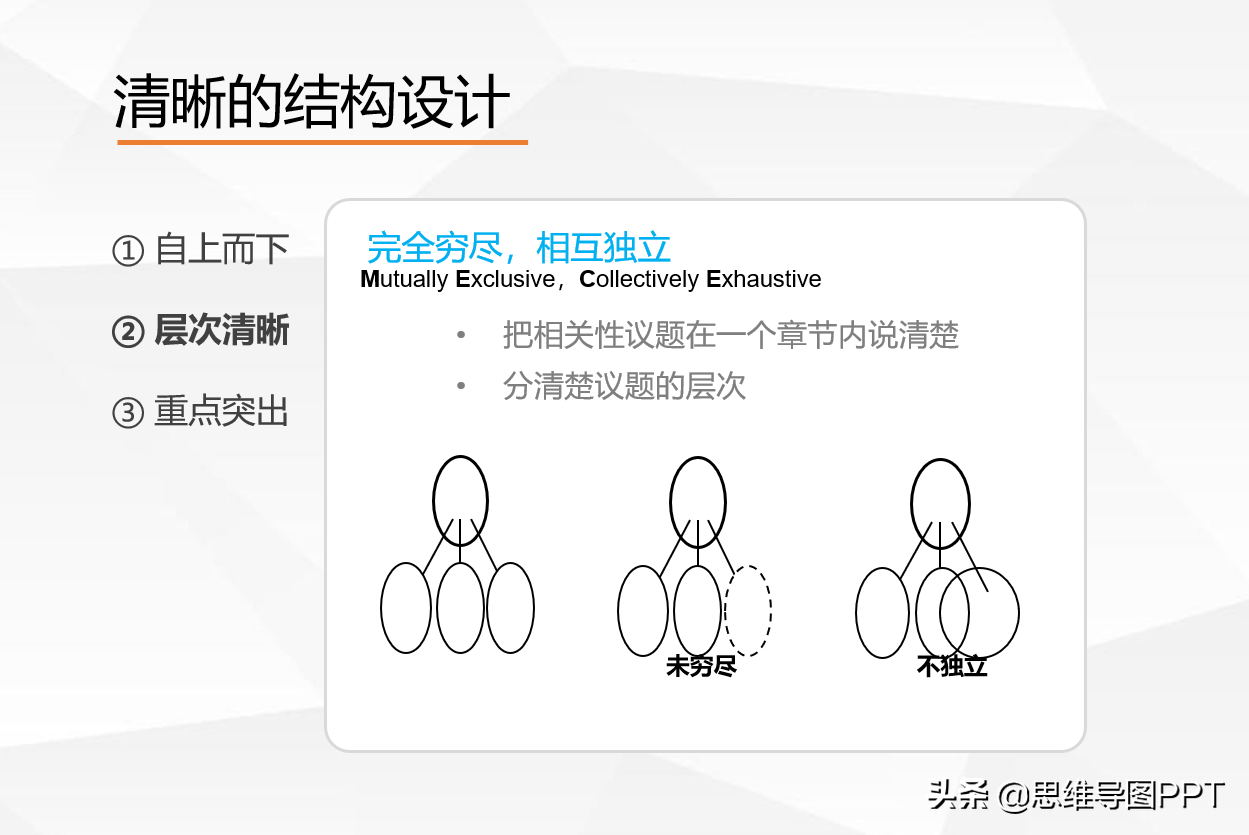
(3) The structure level is clear: follow the MECE rule of the pyramid principle, completely exhausted and independent of each other.
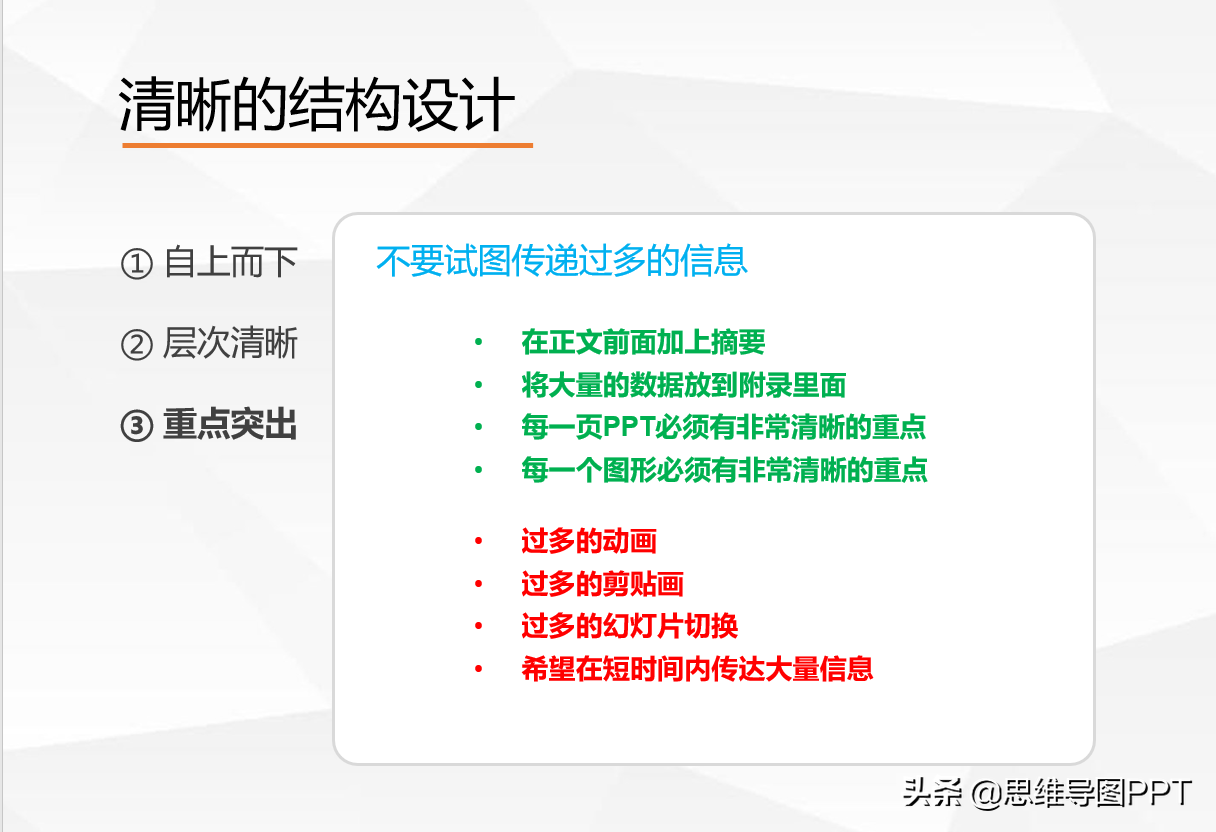
(4) Highlight the key points.
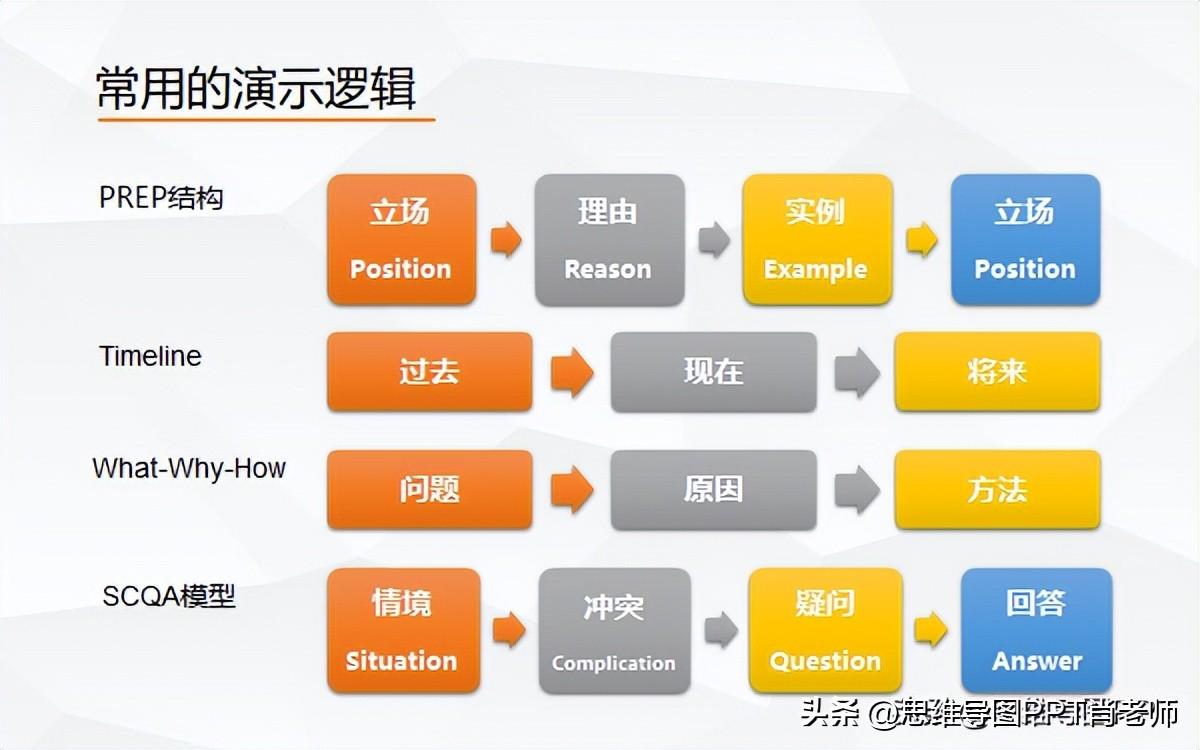
(5) Follow common logical structures, such as PREP structure, time sequence structure, what-why-how structure, SCQA story structure, etc.
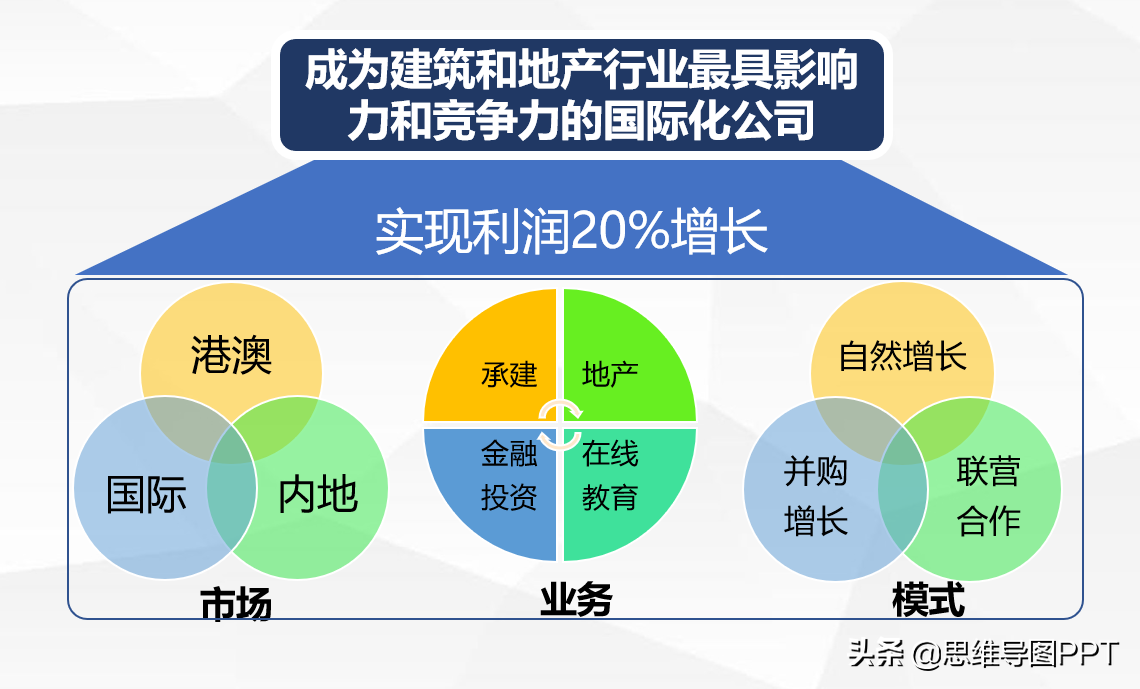
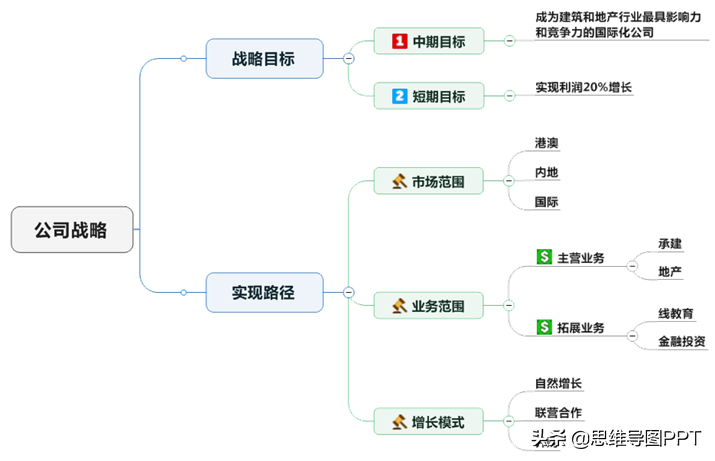
(6) Draw the structural block diagram of the content:
Third, 12 design skills for PPT to be tall
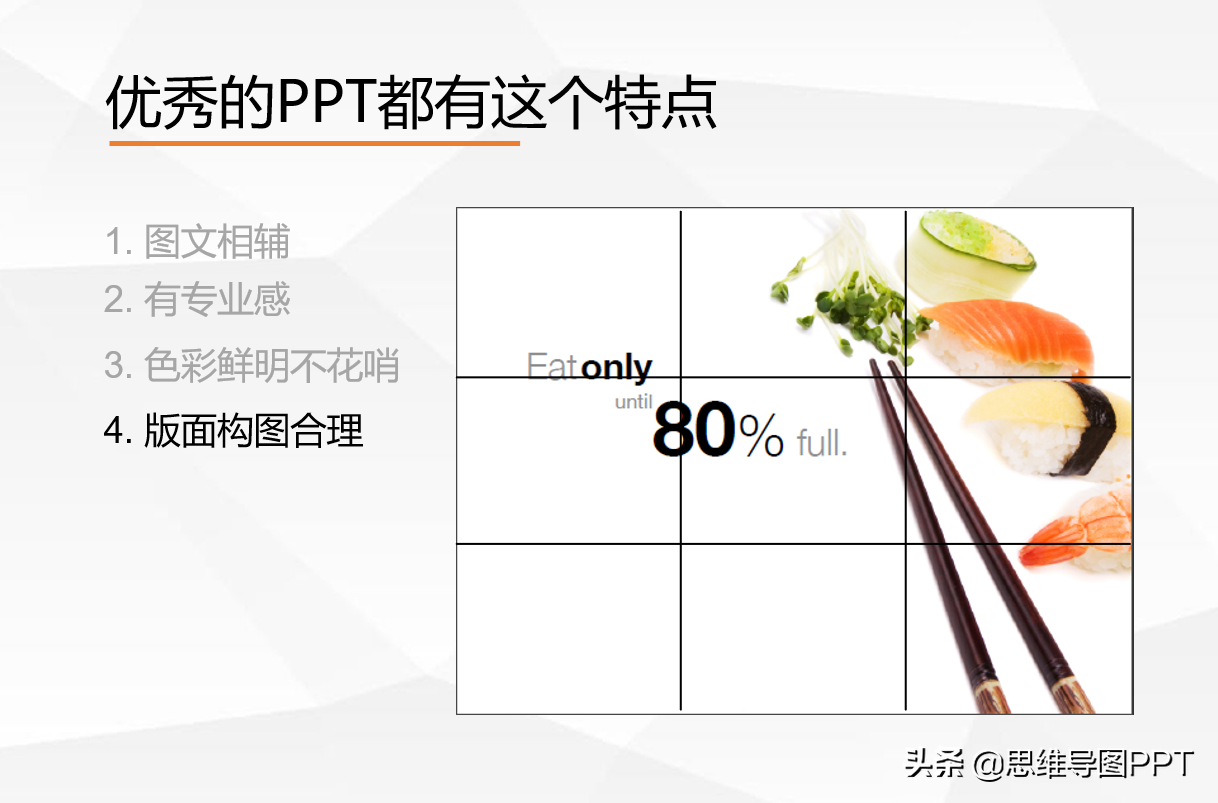
(1) Figure The text is consistent, professional, the color is bright and not fancy, and the layout and composition are reasonable.
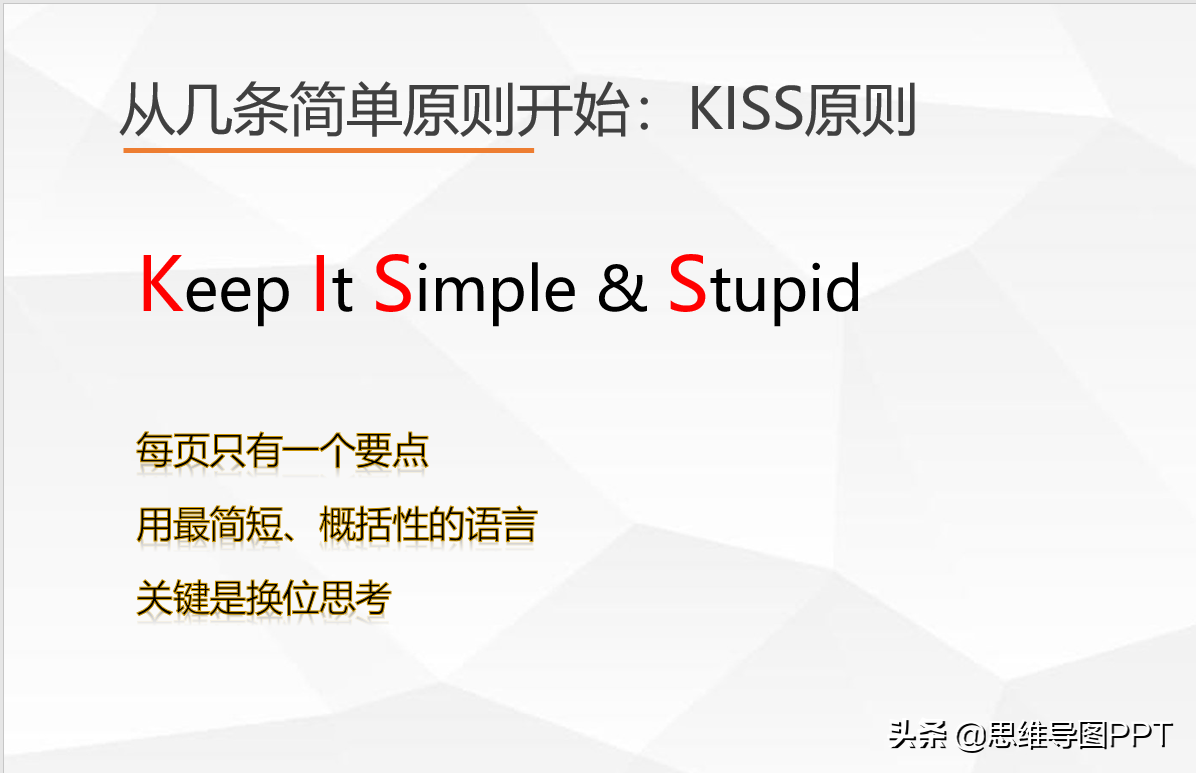
(2) One page of film only talks about one theme.
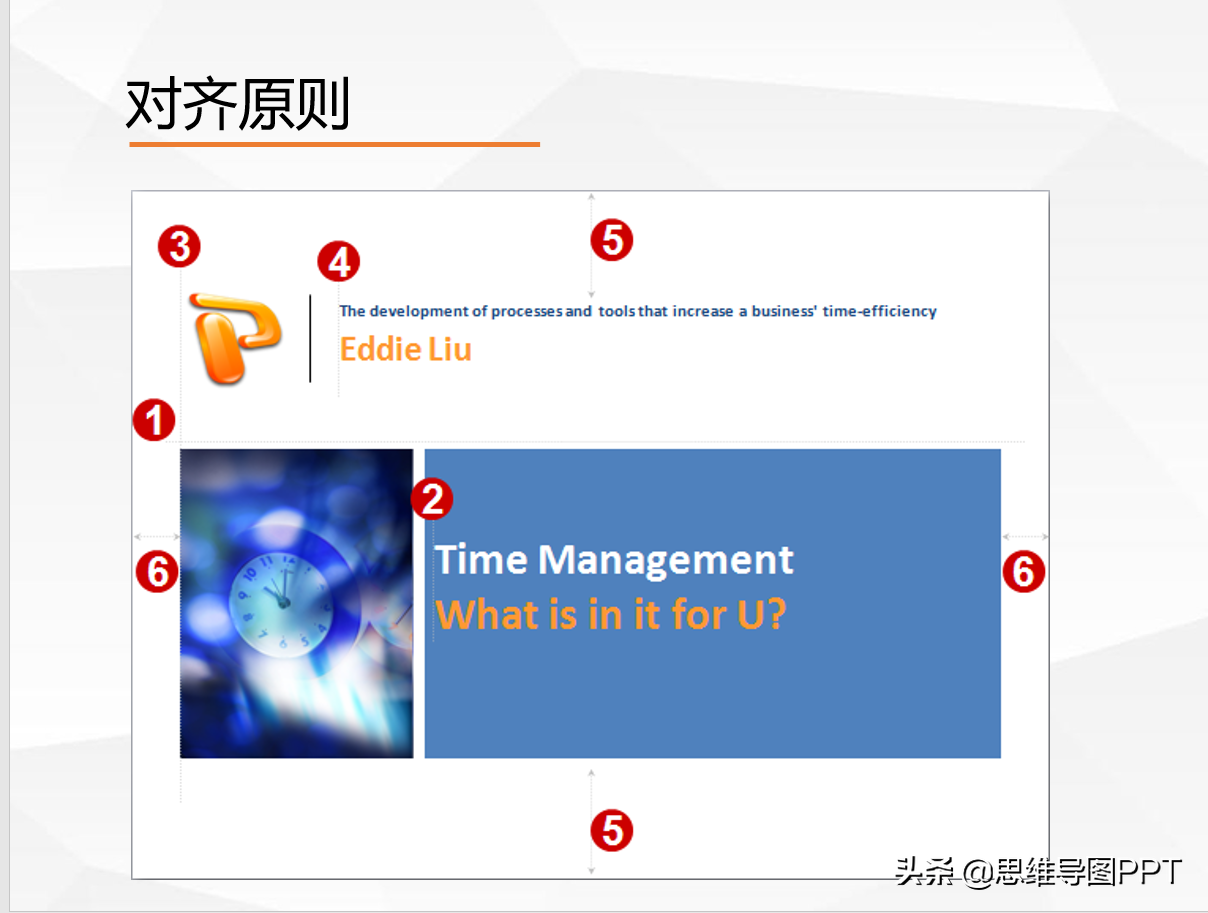
(3) Alignment, spacing, neatness.
(4) Starting from the visual habits of the audience.
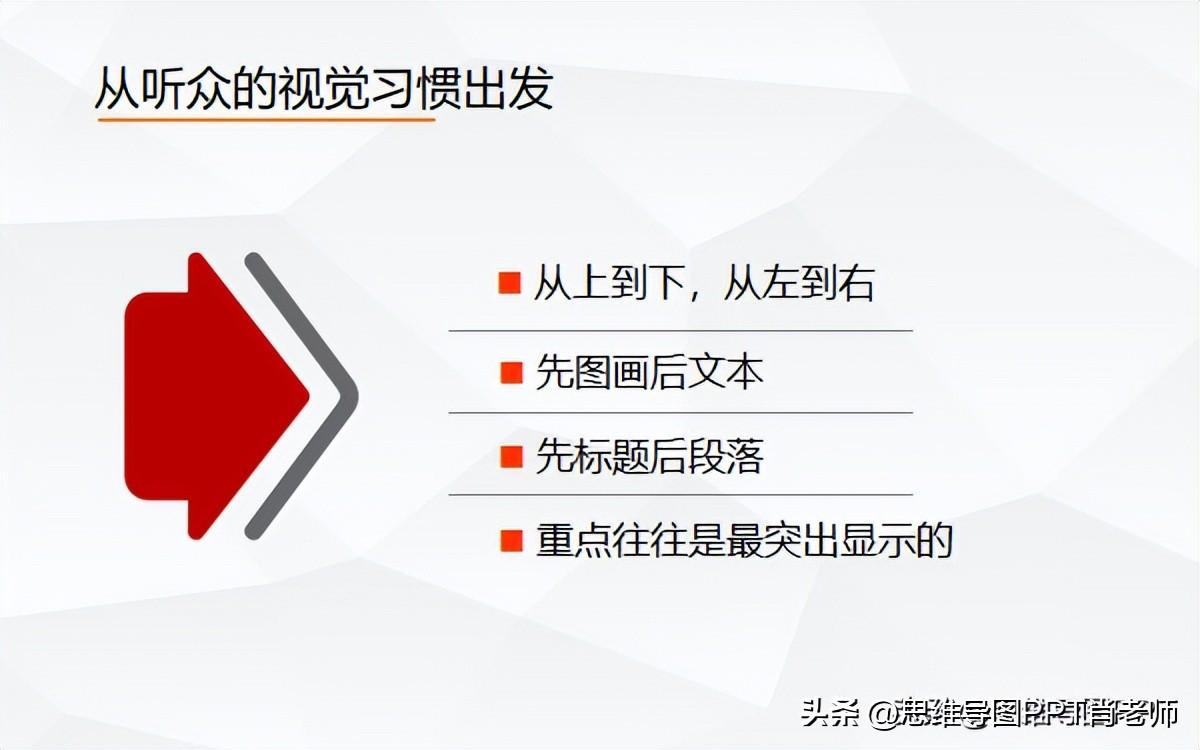
(5) Introduce what the audience cares about, not what you care about yourself.

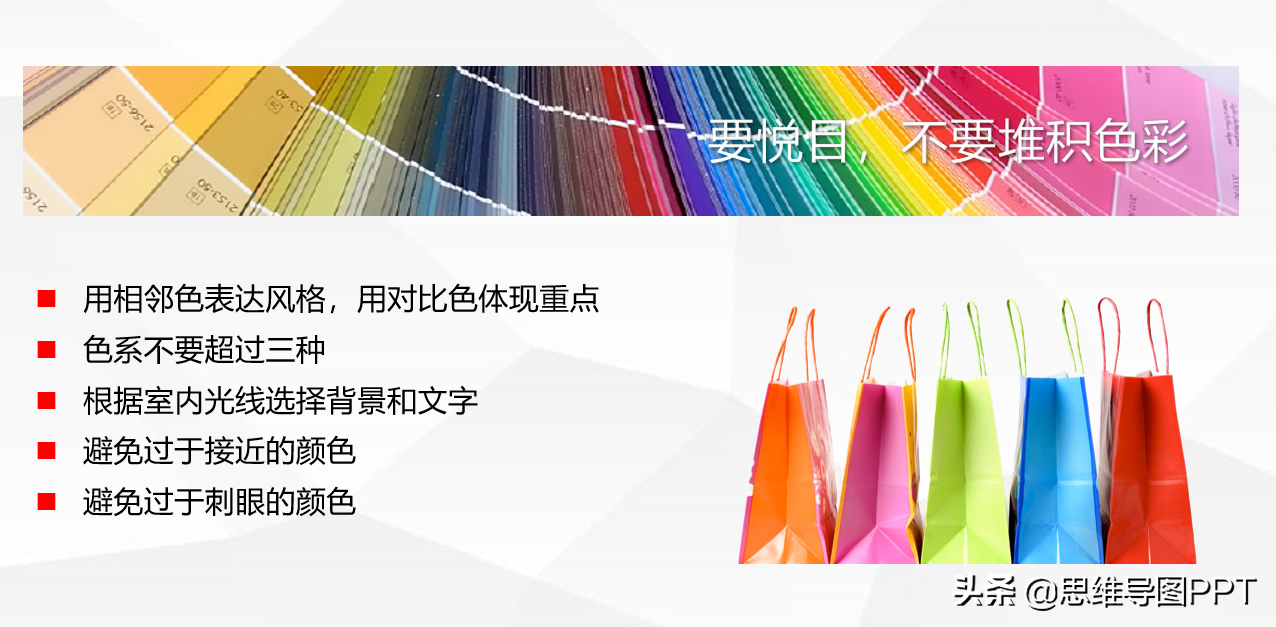
(6) Color matching: the color should be pleasing to the eye, and do not accumulate colors.
(7) Turn the text into pictures as much as possible.
(8) Pictures are the key to success: text is not as good as the table, and the table is not as good as the picture.

(9) Use image formatting and typesetting tools:
- 1. Image transparency;
- 2. Image style;
- 3. Image layout;
- 4. Use the designer that comes with office;
- 5. Image cropping;< /li>
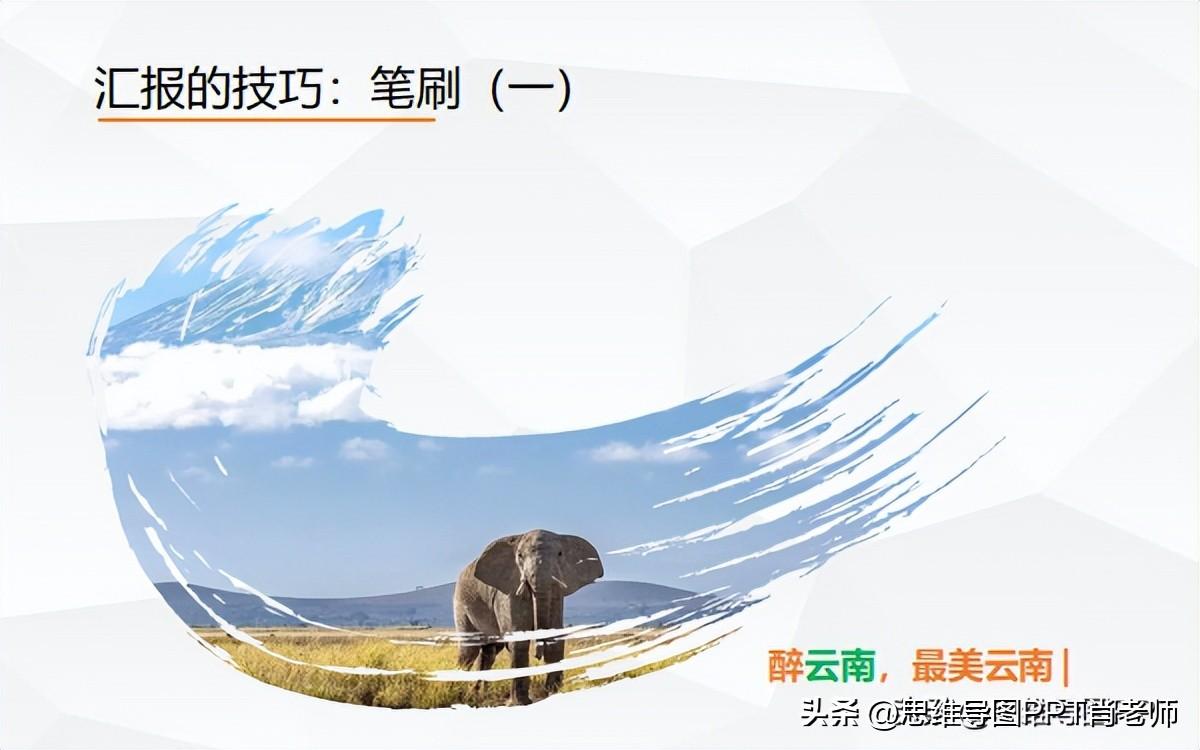
- 6. Brush;
- 7. SmartArt layout;
- 8. Masking.
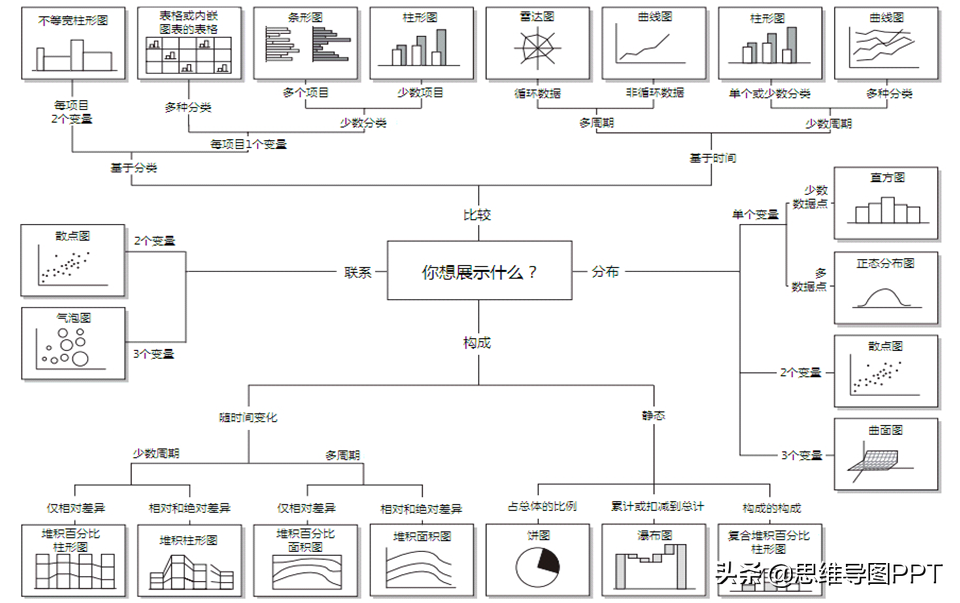
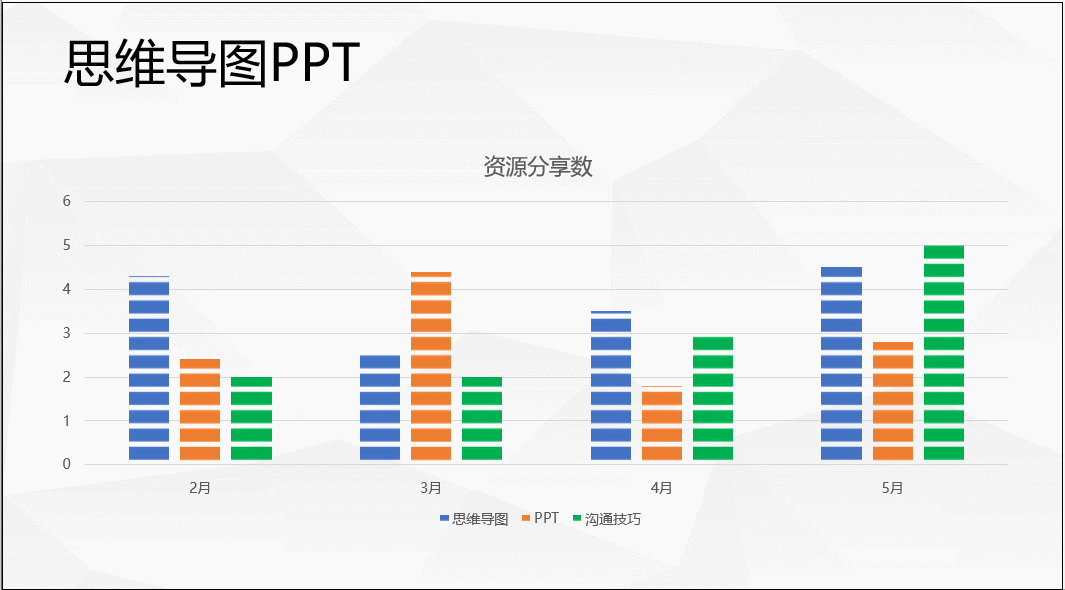
(10) Use dynamic charts.
Dynamic progress bar: used in scenes such as year-on-year comparison
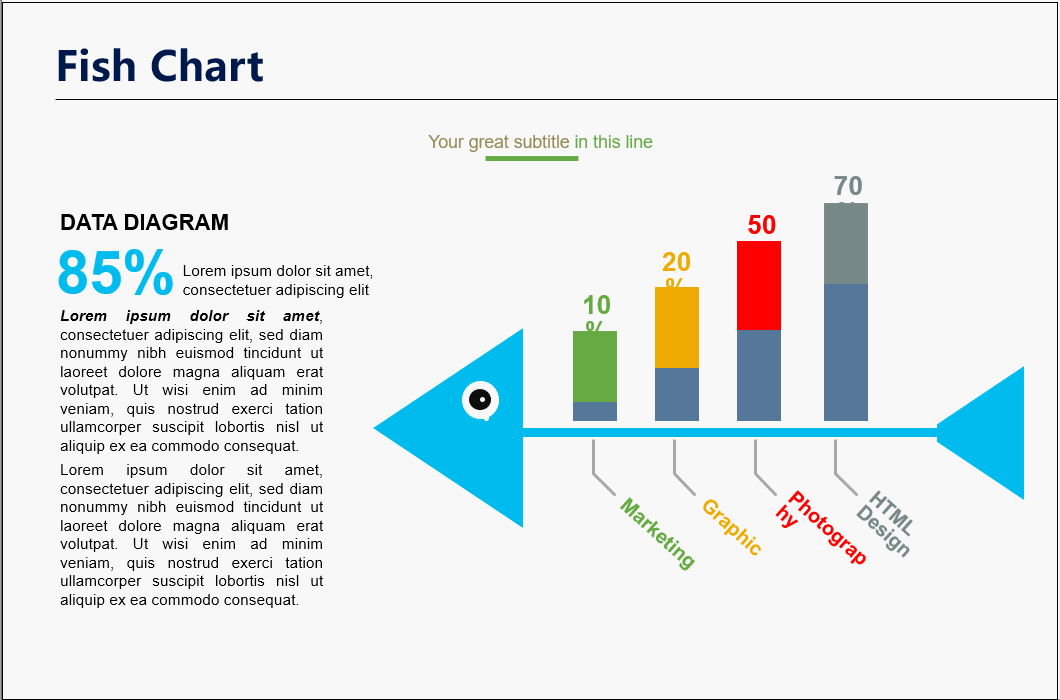
Fishbone diagram: used for root cause analysis and other scenarios
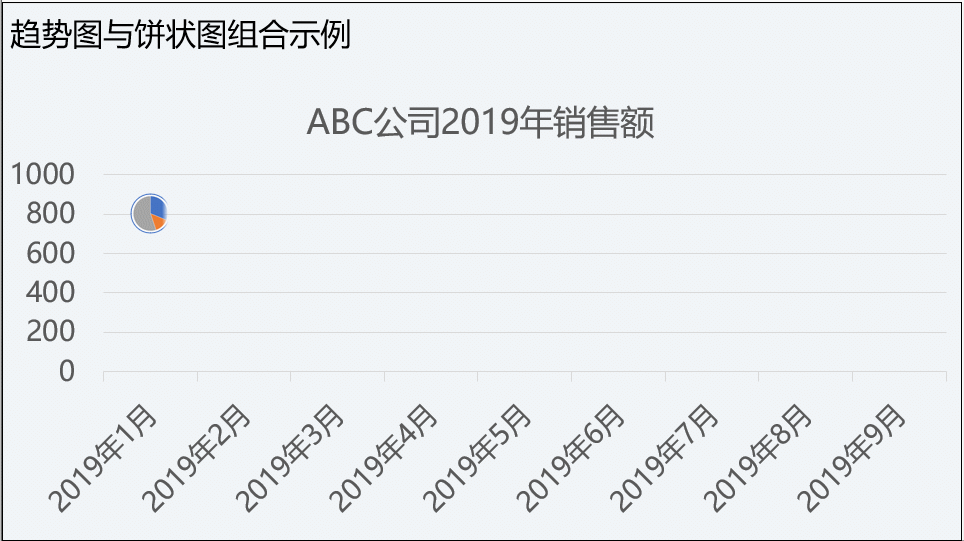
Combined chart, used to show trends, and superimpose proportions and other scenarios at the same time
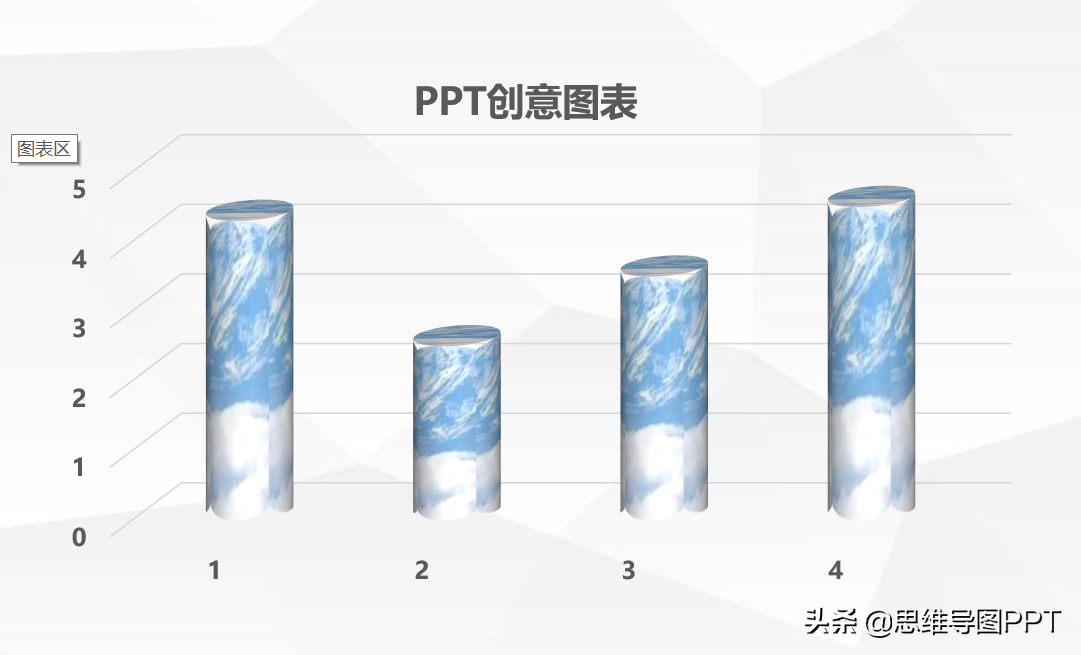
(11) Use some creative charts to avoid the mediocre PPT.
(12) Brush effect.
4. Collect templates and materials
(1) Template 1
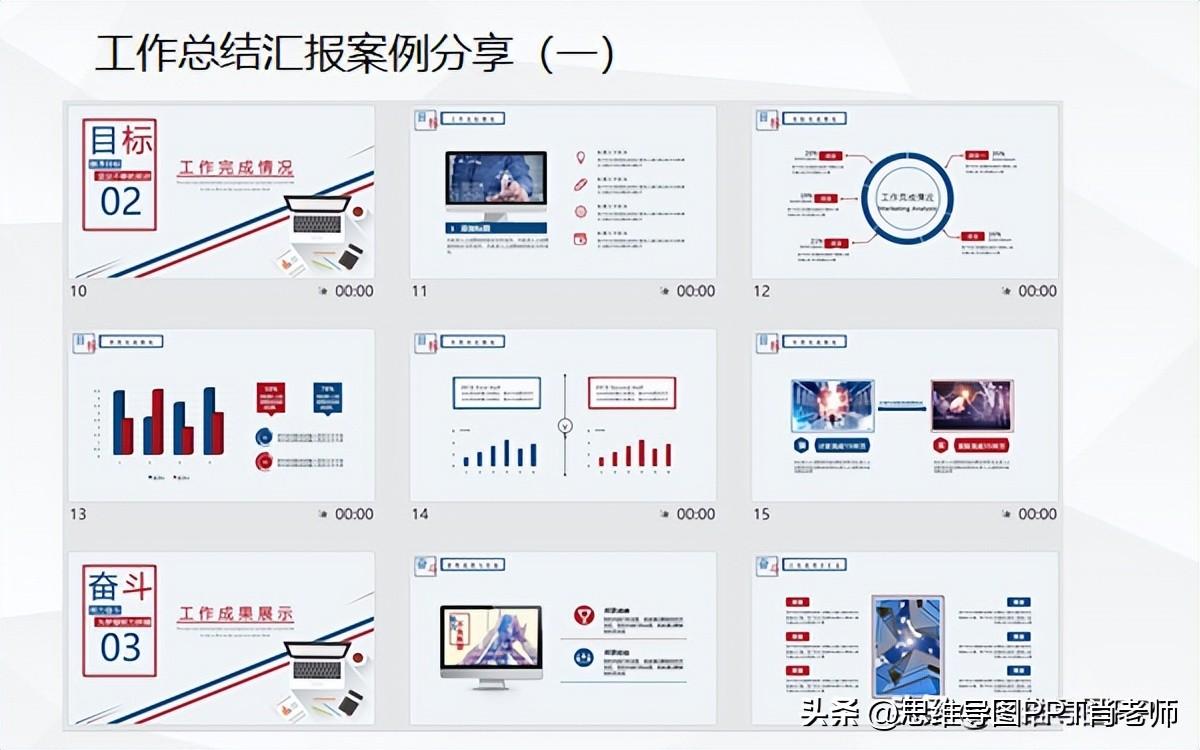
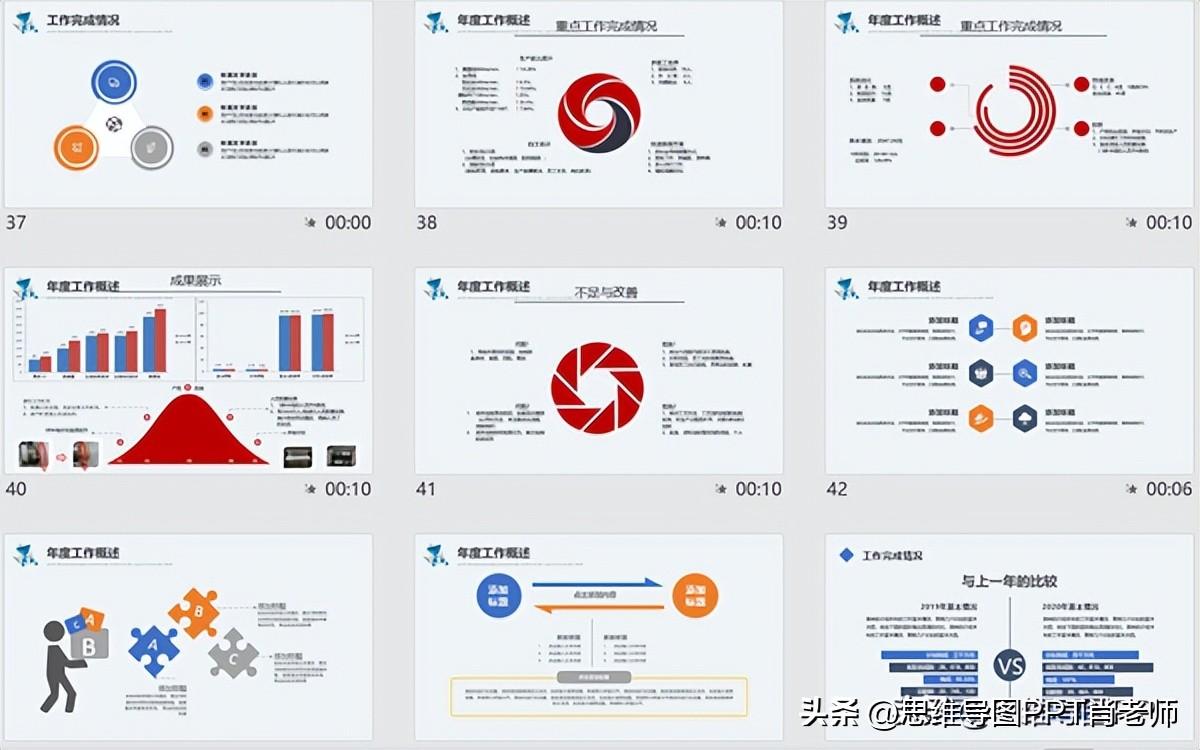
(2) Template two:
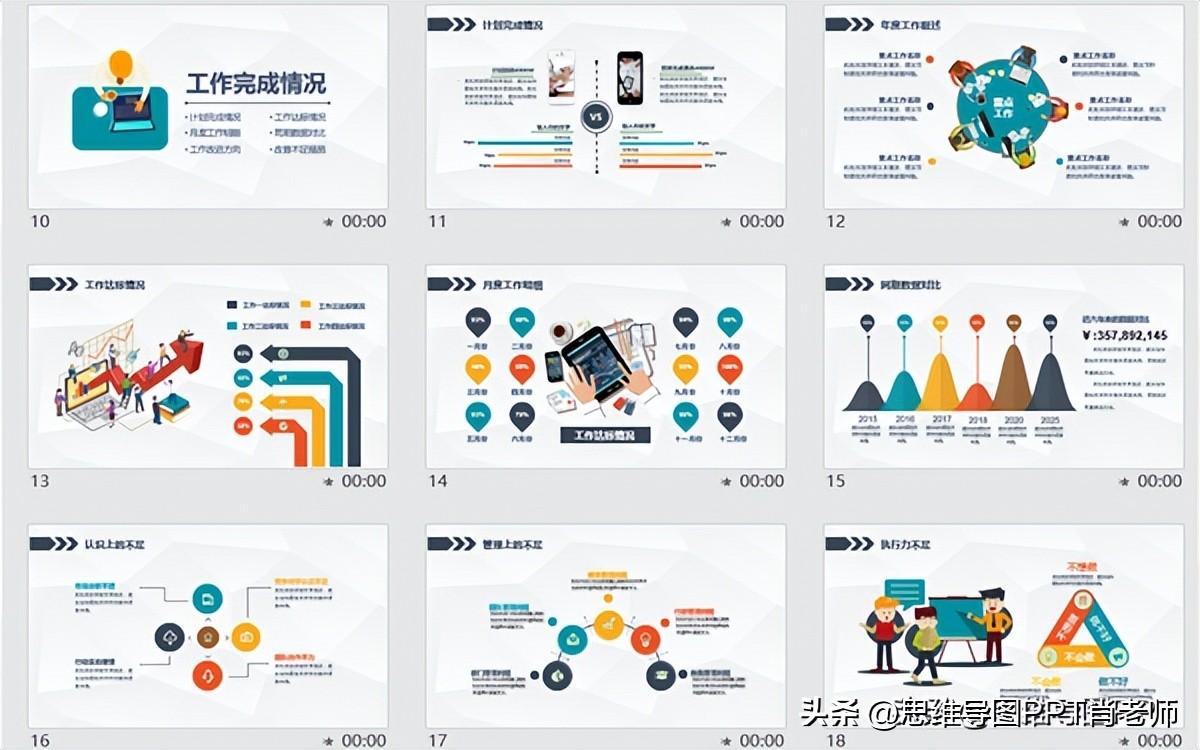
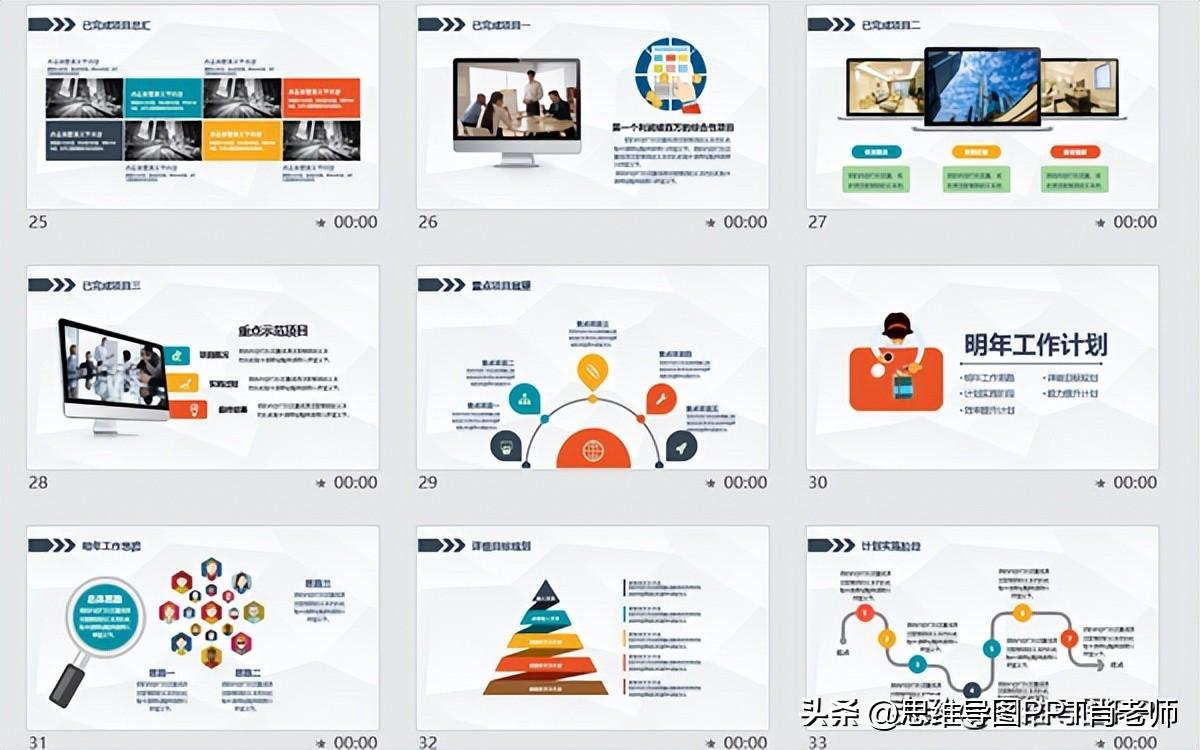
(3) Collect as many templates and materials as possible

For more dry goods in the workplace, welcome to subscribe to the card below, which includes a large number of jobsField methodology, actual combat cases, template materials, use doctrine, get twice the result with half the effort~
More sharing, more gains, welcome to forward and share!

Articles are uploaded by users and are for non-commercial browsing only. Posted by: Lomu, please indicate the source: https://www.daogebangong.com/en/articles/detail/Report%20three%20tricks%20What%20to%20report%20How%20to%20report%20How%20to%20make%20a%20PPT%20to%20be%20tall%20Forward%20and%20share.html
 支付宝扫一扫
评论列表(196条)
测试