PowerPoint2010 realizes dynamic display of line chart
We often make line charts to express the trend changes of a process, and if we make the line chart move, it will be more vivid. Next we will complete this method step by step through diagrams
Now let's do it:
Start PPT and create a new blank slide
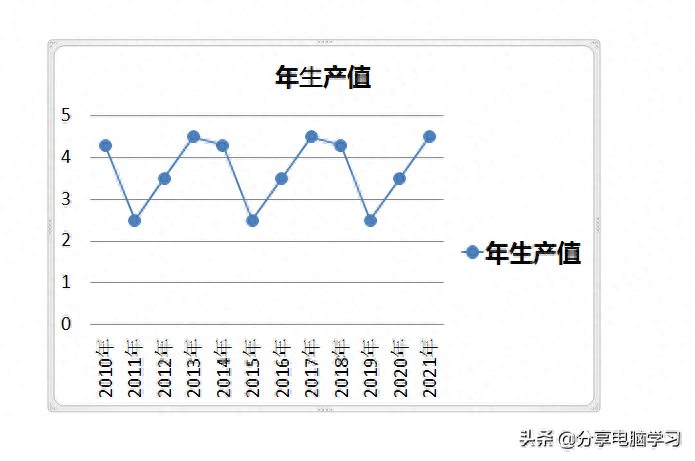
Insert a line chart
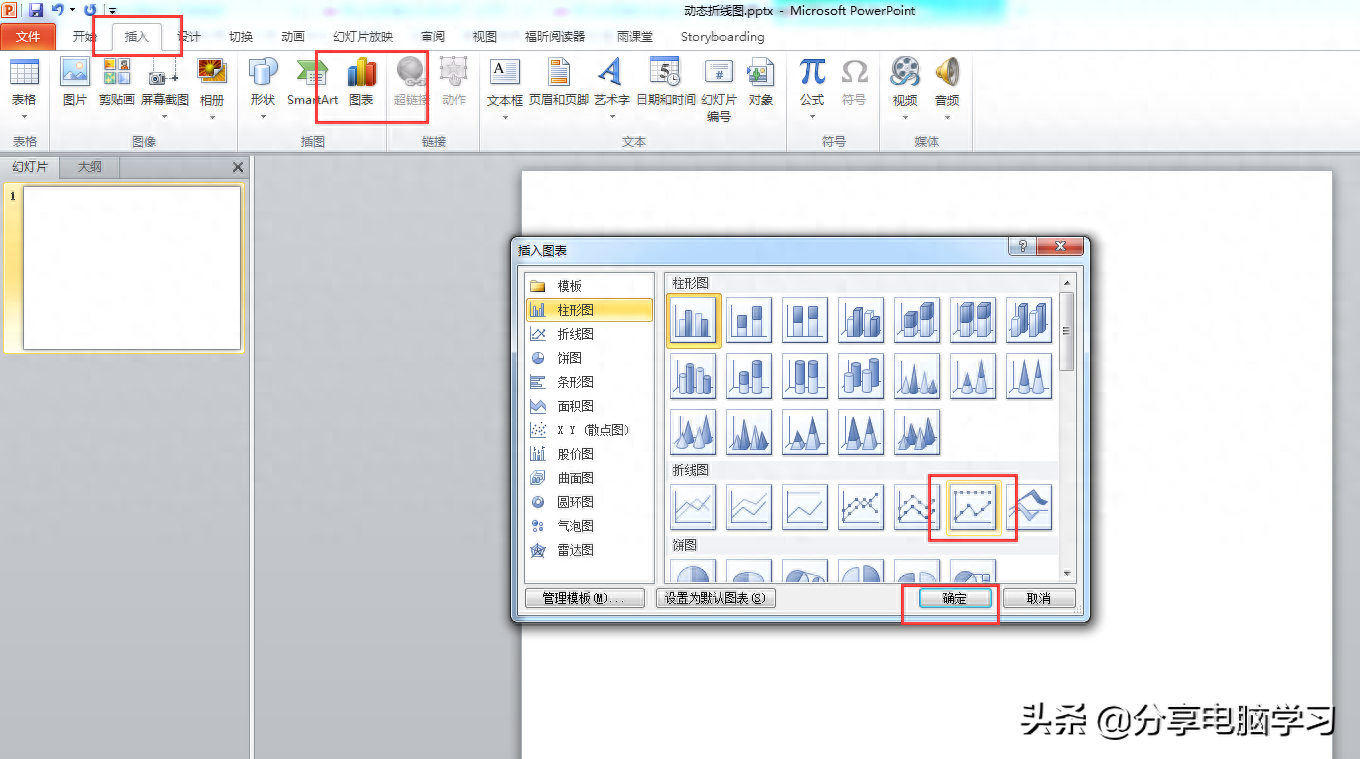
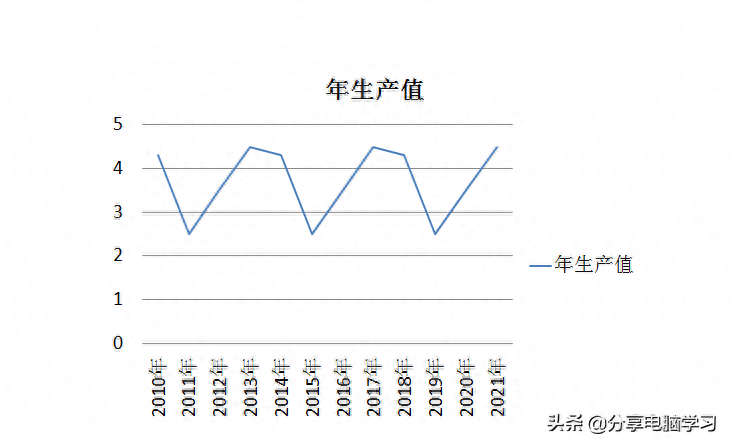
The following interface appears
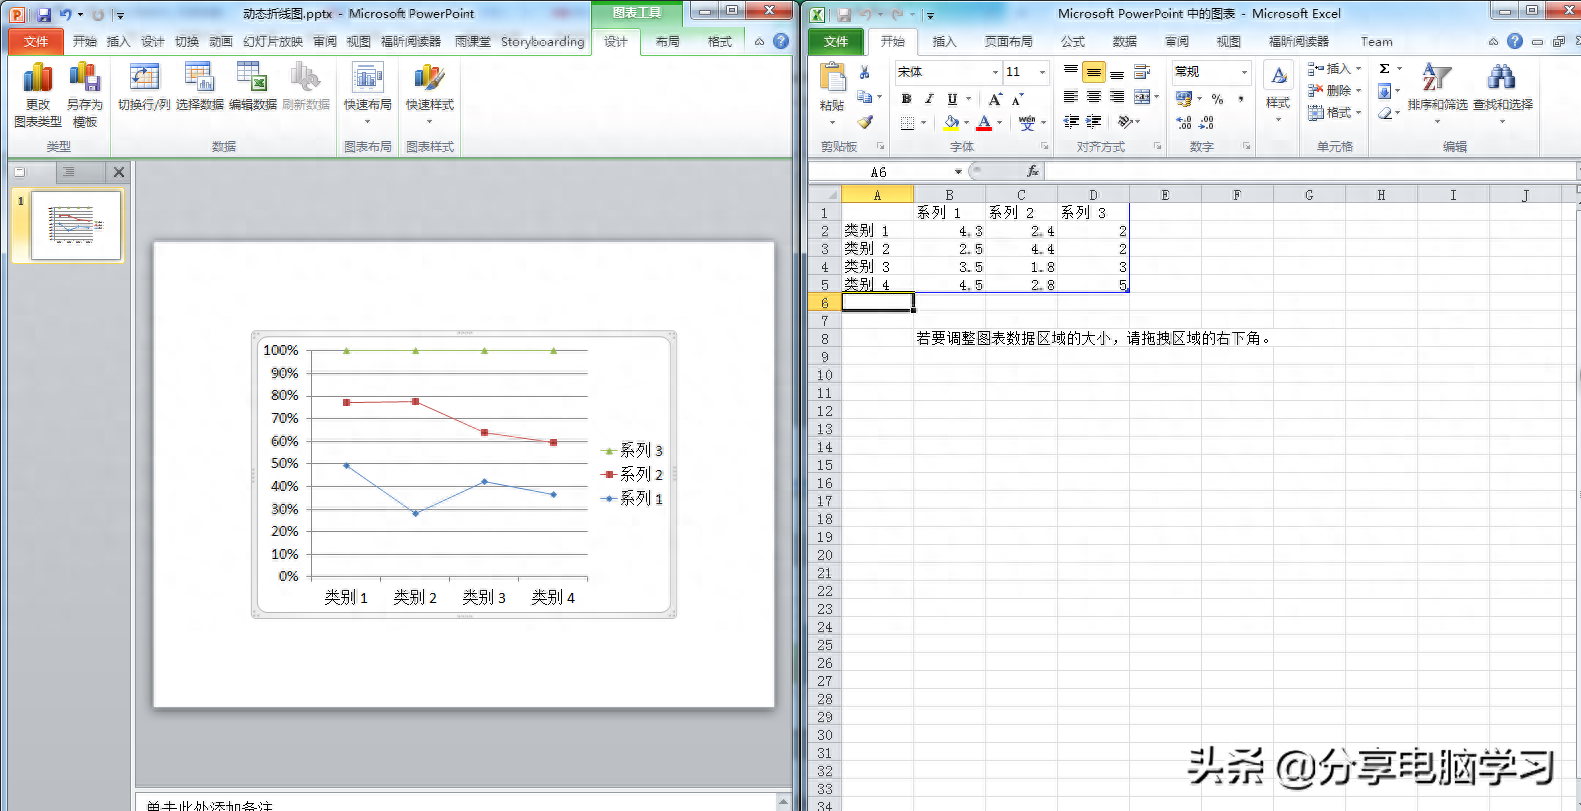
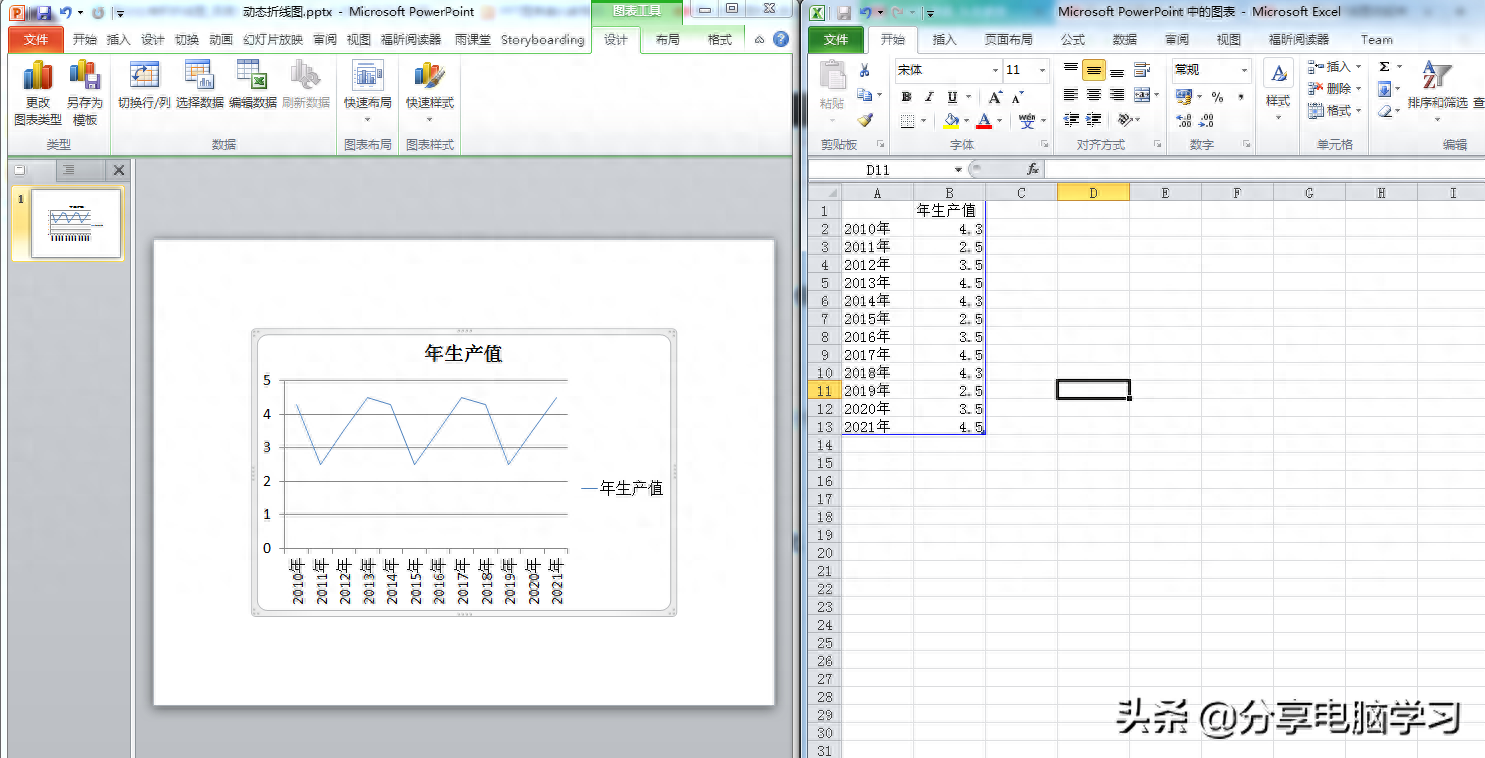
Modify the data. In order to display it better, try to have more data in the X-axis direction
Let’s do some beautification first
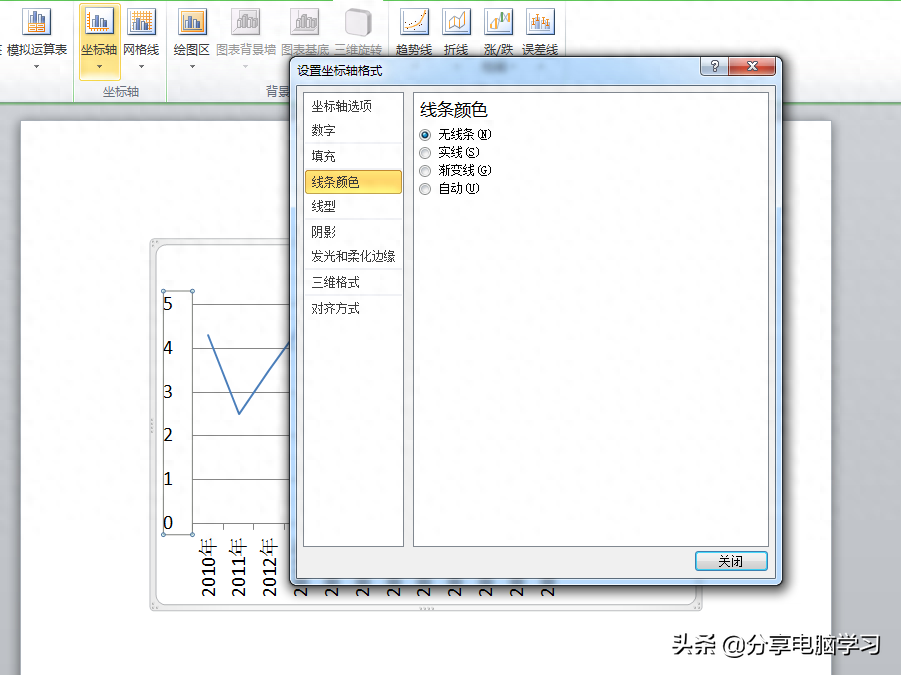
Hide the vertical axis and hide the horizontal axis tick marks
For evenly distributed line chart data points, the horizontal distribution position of each data point is relatively easy to identify, so the visual guidance of vertical grid lines is not completely necessary, so the line chart can choose to use the background area of vertical and horizontal grid lines. You can also hide the vertical grid lines and vertical axis, and only display the horizontal grid lines to identify the data height.
Select the vertical axis, set the axis format, and select [No Line] in the filled lines.
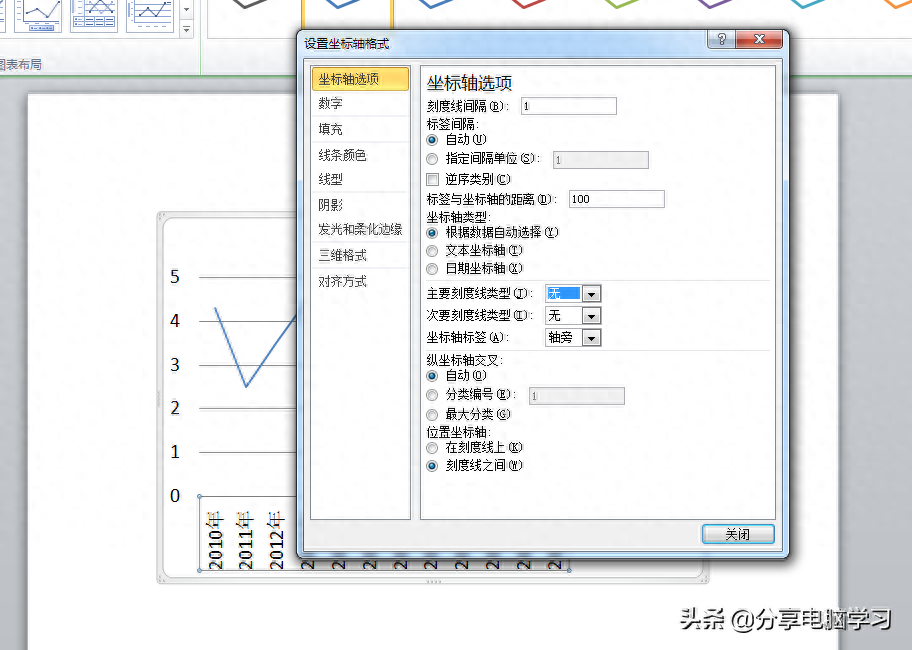
Select the abscissa axis, set the axis format, and set the tick mark type to [None]
Simplify horizontal axis labels
Since there are relatively more data points distributed on the horizontal axis of the line chart, the distribution density of the data labels is relatively high, and therefore the content of the labels is required to be as simple as possible. This can be simplified by modifying the numerical format of the data labels ( If it is a text label, it is recommended to change the source data directly). You can also consider reducing the number of labels displayed by enlarging the coordinate interval unit.
Select the abscissa axis, set the axis format, and change the number format type, for example, change the date to m/d format.
We don't handle it here
Other element settings
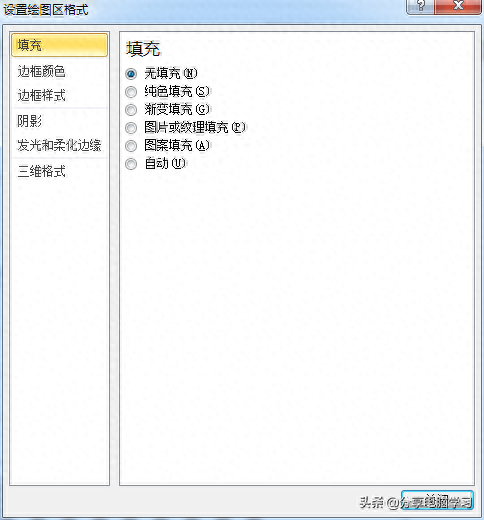
The grid line background plays a supporting role in the chart. The horizontal grid lines can be diluted as much as possible without affecting the positioning of the values. In addition, the background fill color of the chart area and drawing area can also be set to colorless and transparent to reduce the display of the foreground. Influence
Select the grid lines and set the shape outline color to light gray. Select the drawing area and chart area respectively, and set the fill color to [no color]
Font optimization
Set the font. In this example, the English font is Candara and the Chinese font is Microsoft Yahei.
Optimize shape
Highlight the display of data points in the line chart while harmoniously matching the data lines. A common way is to choose to use circular data markers, enlarge the shape, and set a certain contrasting fill and border color.
Select the data series, set the format of the data series, select the built-in circular shape in the data mark options, and adjust the size, for example, set to 11
Set the fill color and border line of data markers
You can consider setting the fill color of the data mark to white, setting the border line color to be consistent with the data point connection, and increasing the border line width to be consistent with the data point connection line.
Select the data series, set the format of the data series, set the fill color of the data mark, and set the border color and line width of the data mark.
Not processed yet
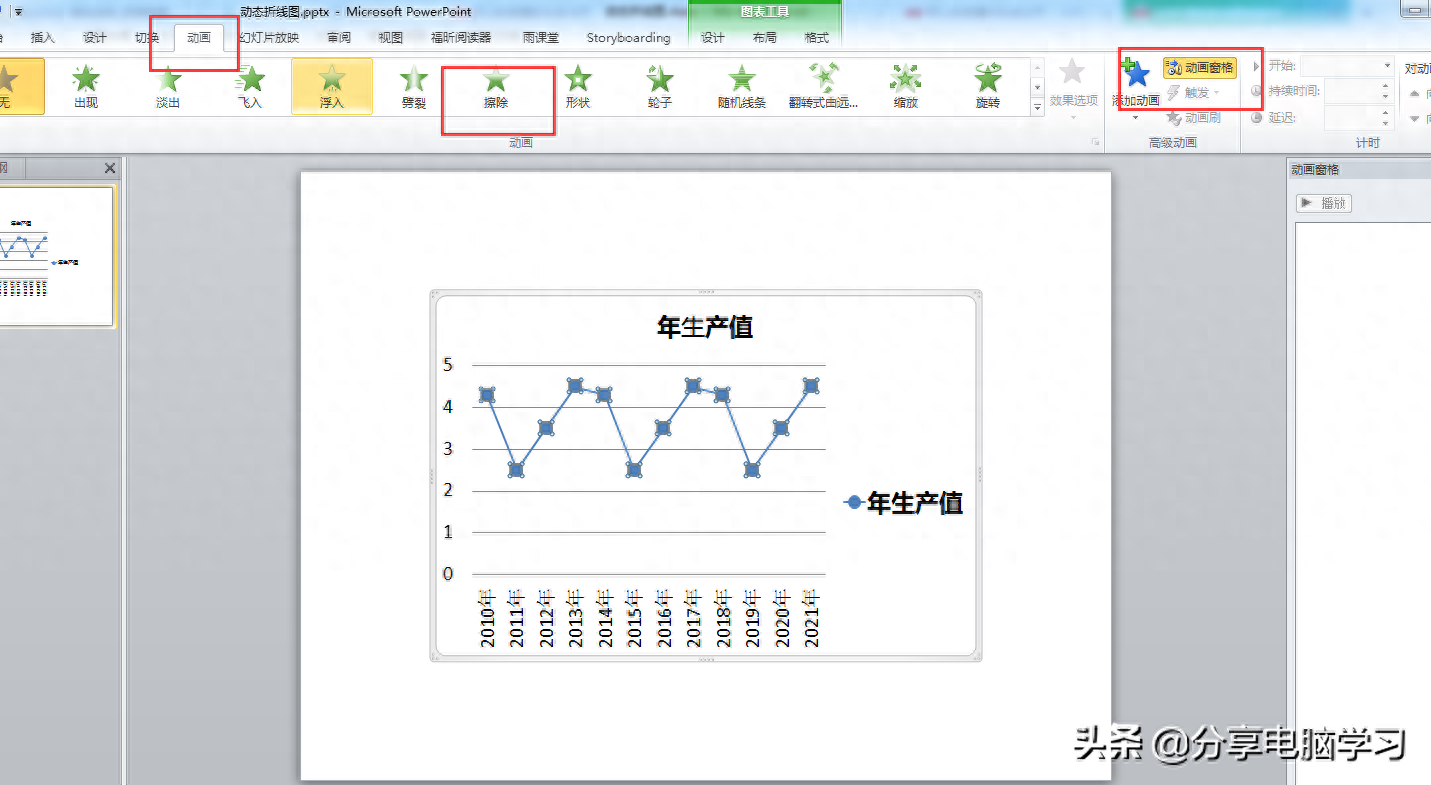
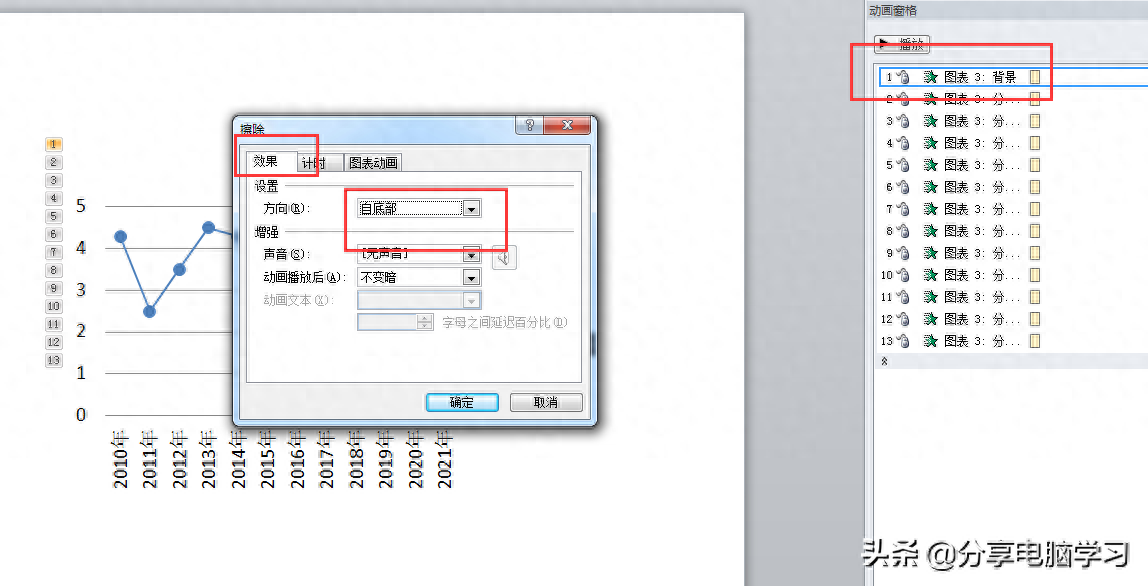
Add wipe animation
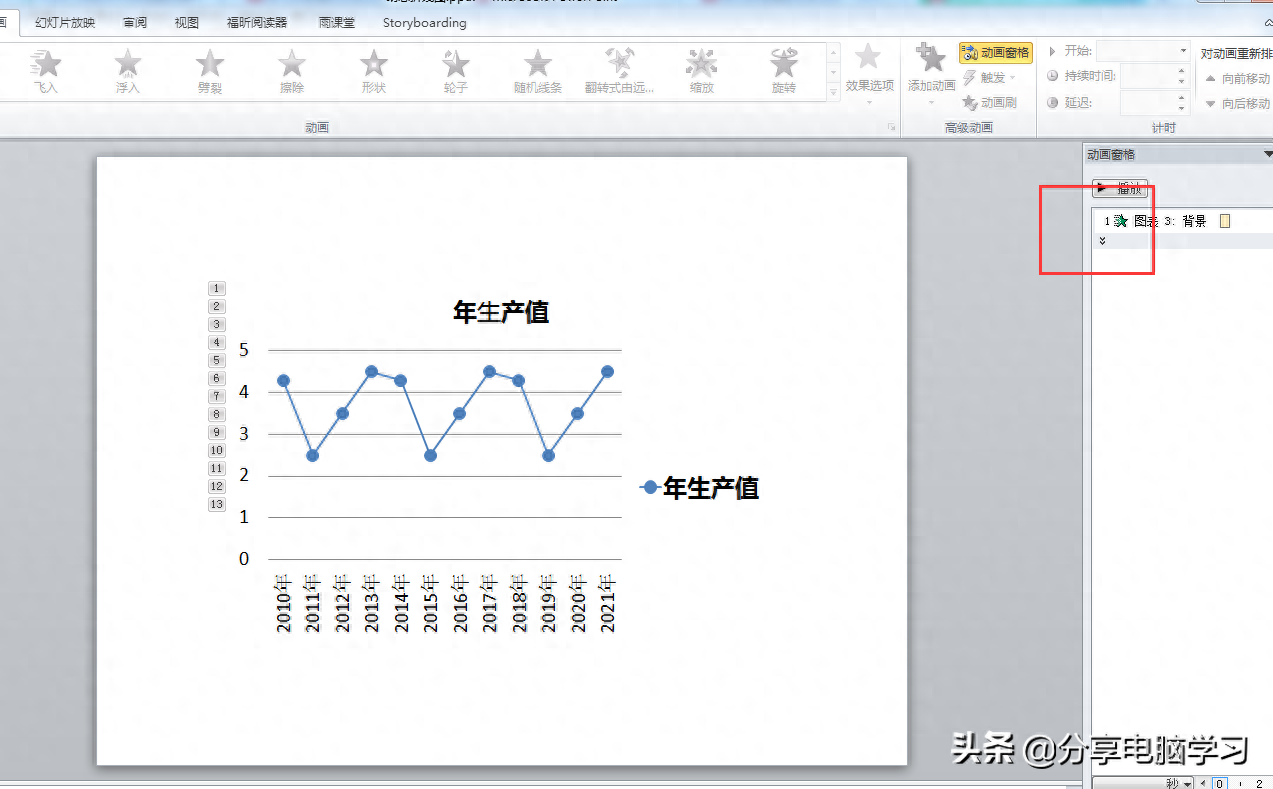
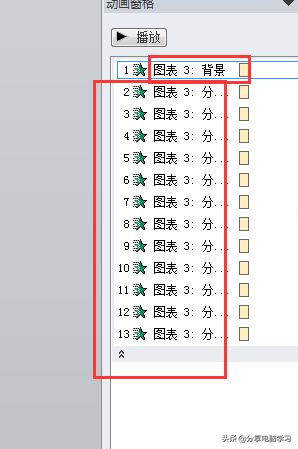
Right-click the animation again, set the [Chart Animation] in [Effect Options], and select [By Category] (appears one by one, [By Series] appears as a whole line)
Adjust the direction, set the background to [from bottom], and set categories 1 to 12 to [from left] (select category 1, hold down [Shift], and select category 12 to select all). In addition, you need to Playback is adjusted to [start after the previous item]
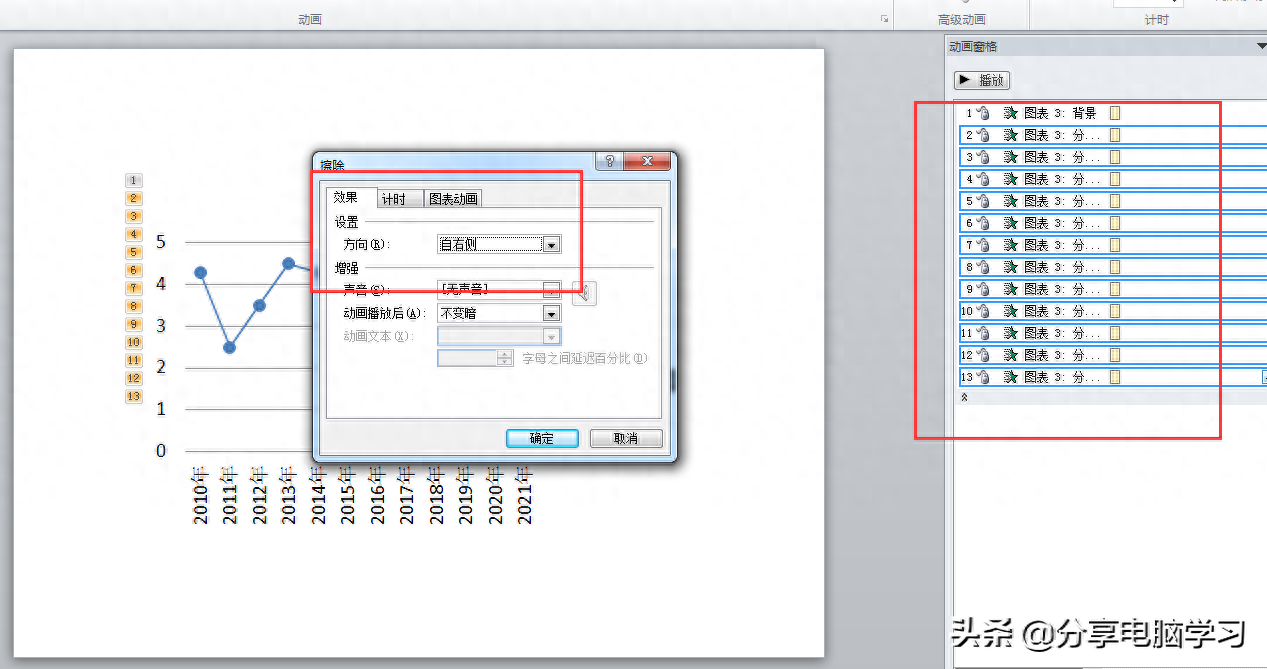
Finally, just adjust the time speed appropriately
Articles are uploaded by users and are for non-commercial browsing only. Posted by: Lomu, please indicate the source: https://www.daogebangong.com/en/articles/detail/PPT2010-shi-xian-dong-tai-zhe-xian-tu.html
 支付宝扫一扫
评论列表(196条)
测试