- Graphic skills
In our daily work, we often need to use PPT to display information and data. In order to make the report more intuitive, sometimes it is necessary to add charts to the PPT. So, how to insert and edit charts in PPT?

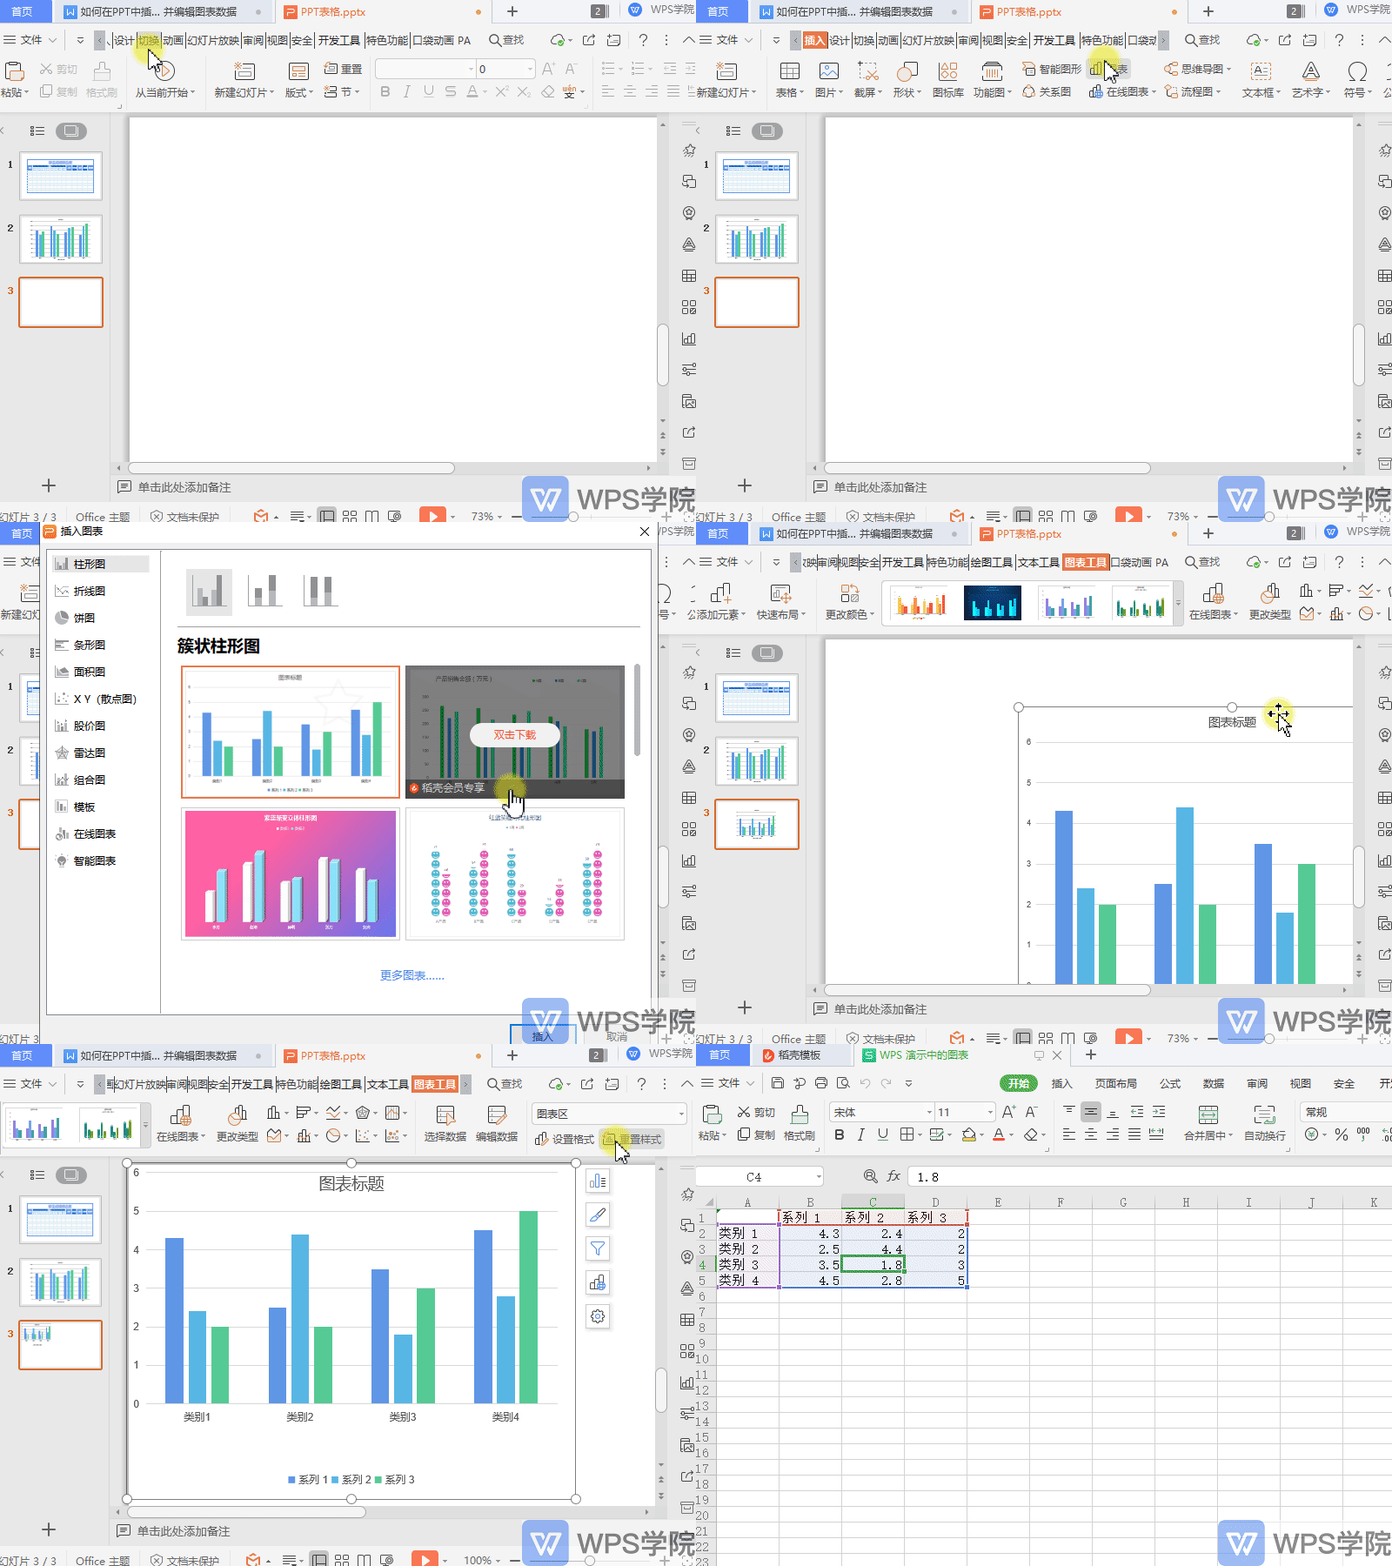
First, take a PPT file as an example, click "Insert" - "Chart" in the top menu bar, and select a suitable chart type from the list to insert.
Here, we choose to insert a column chart to display the data. When you click OK, the column chart will be embedded in the PPT page.

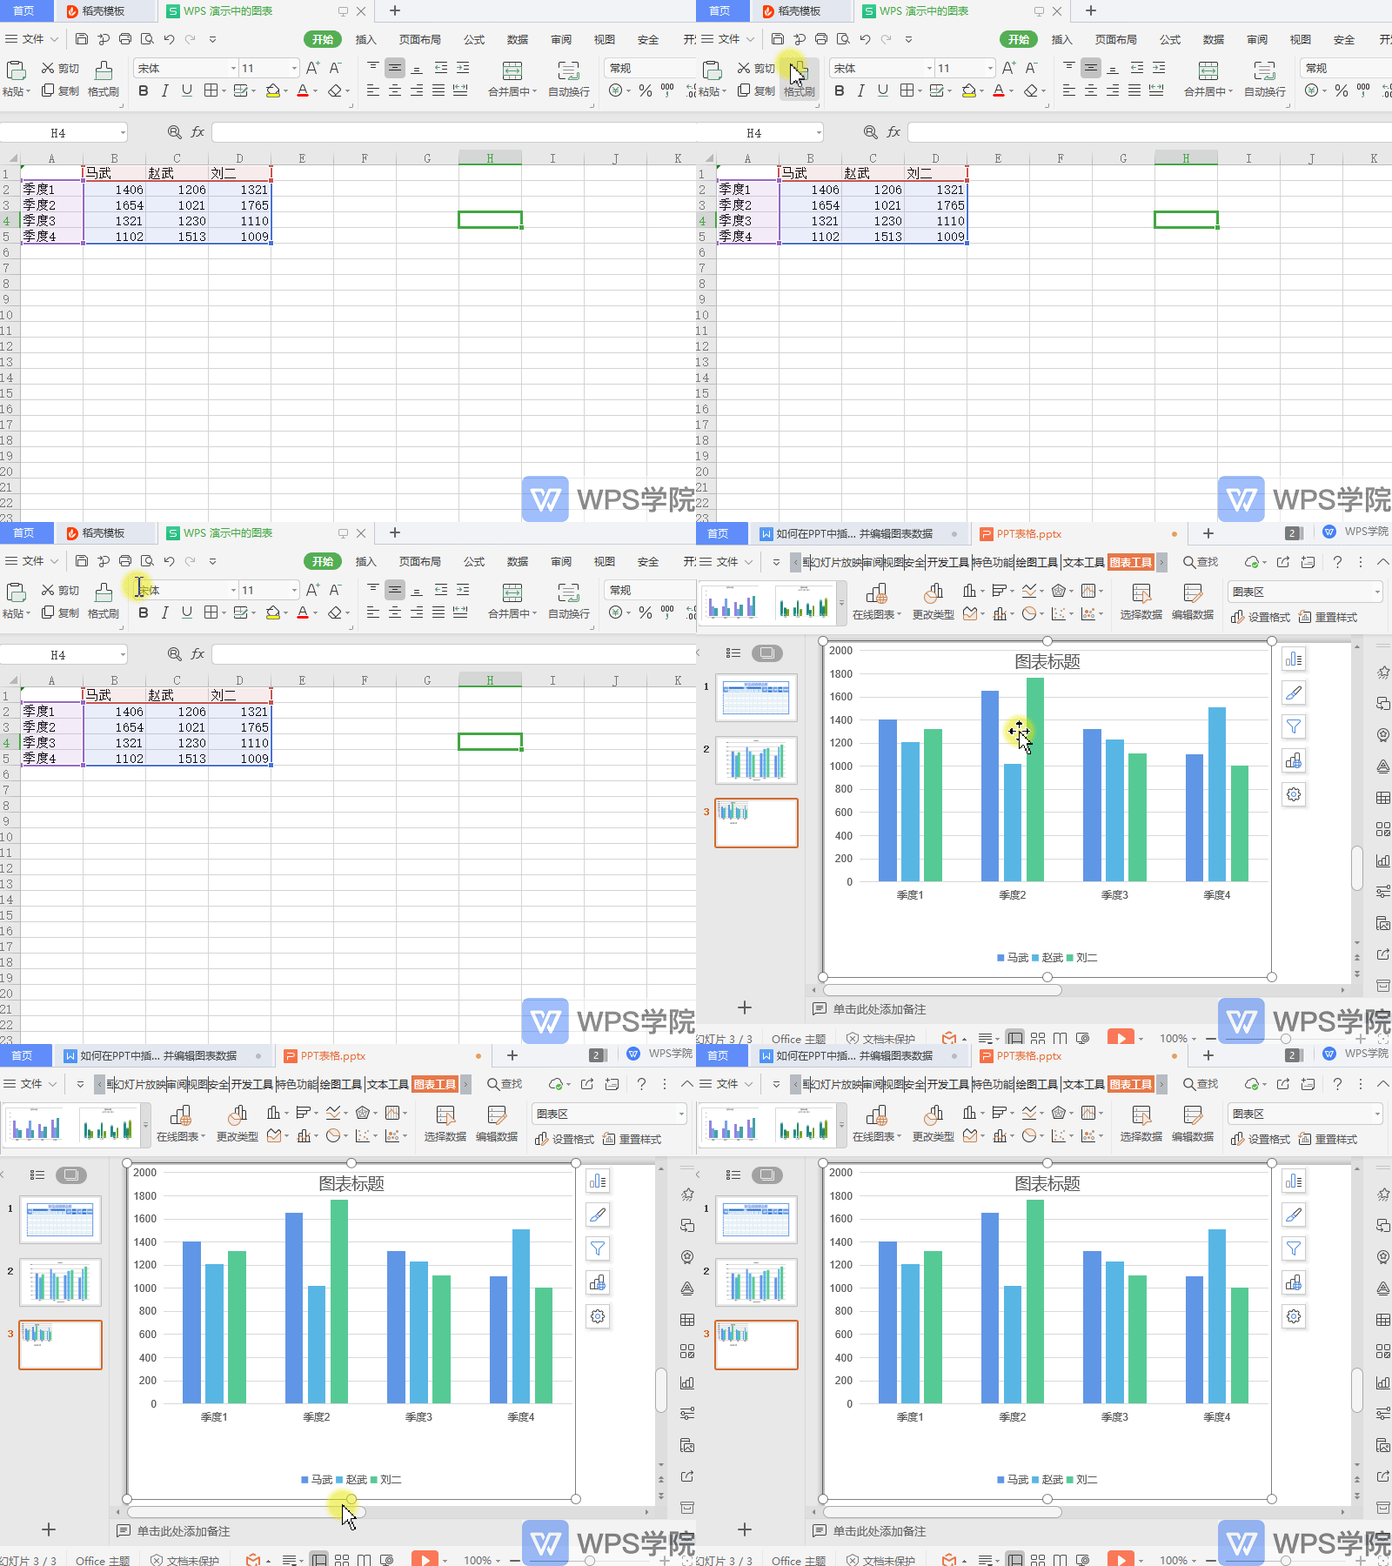
Next, we want to edit the data in the chart. Click the "Chart Tools" menu at the top and select "Edit Data." The system will automatically open a dialog box containing the data table of the current chart.
In the data table, you can modify the data. After the modification is completed, click the save button, and the chart in the PPT will be updated according to the new data table content.

Articles are uploaded by users and are for non-commercial browsing only. Posted by: Lomu, please indicate the source: https://www.daogebangong.com/en/articles/detail/PPT-tu-biao-cha-ru-yu-shu-ju-bian-ji-xin-shou-zhi-nan.html

 支付宝扫一扫
评论列表(196条)
测试