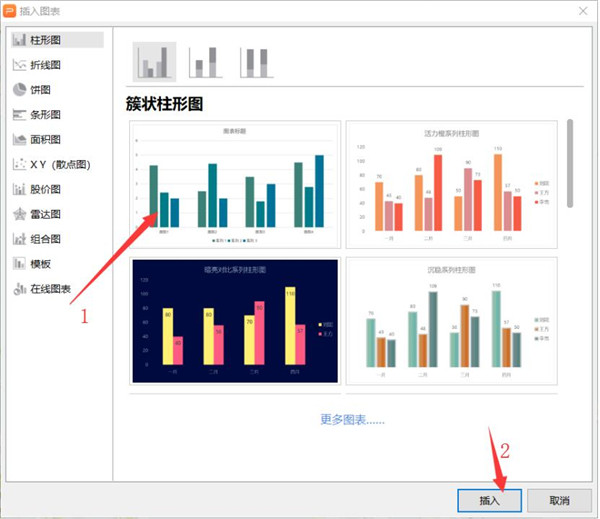
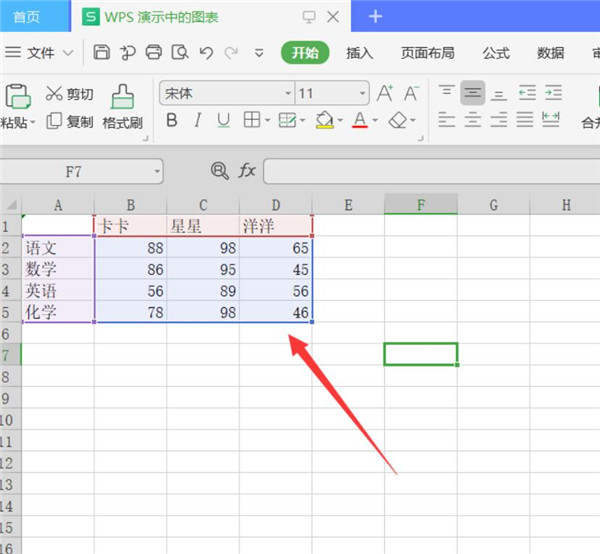
 3. After that, right-click on the chart and select "Edit Data". 4. An Excel form of the chart in the WPS demo will pop up. Enter the required data here.
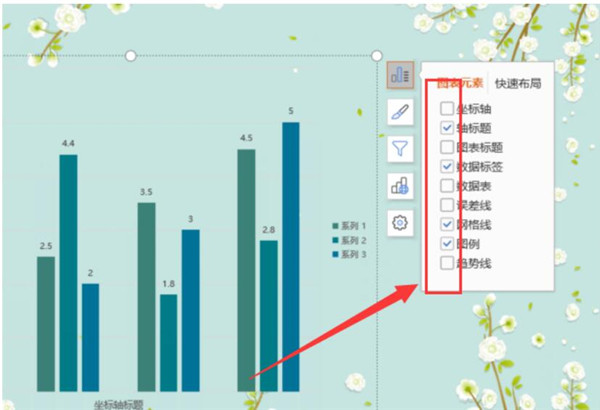
 5. After the chart is created, select the chart, click "Icon Elements", and uncheck unnecessary elements.
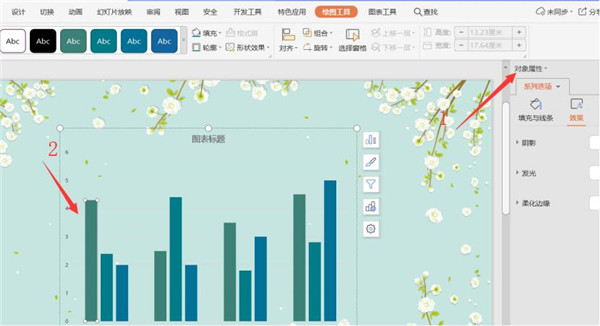
 6. Then double-click the chart and click "Object Properties" in the menu that appears on the right.
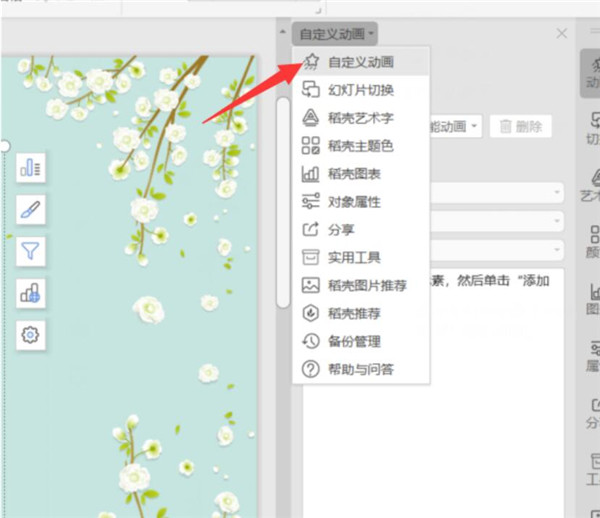
 7. Select Custom Animation from the drop-down list.
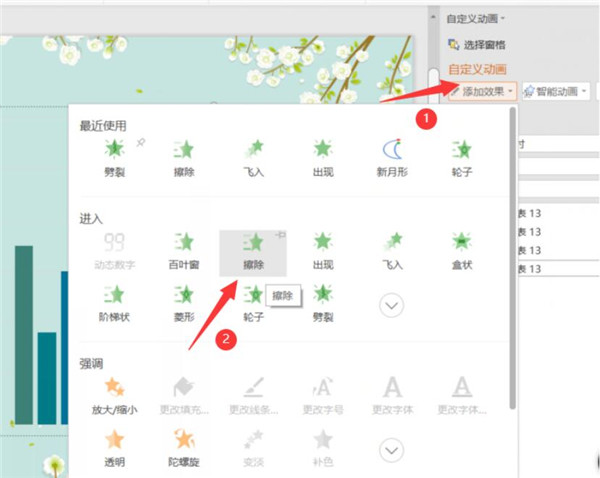
 8. To add effects, select "Wipe Animation".
 9. Finally, modify the format content of the animation and select it as needed.
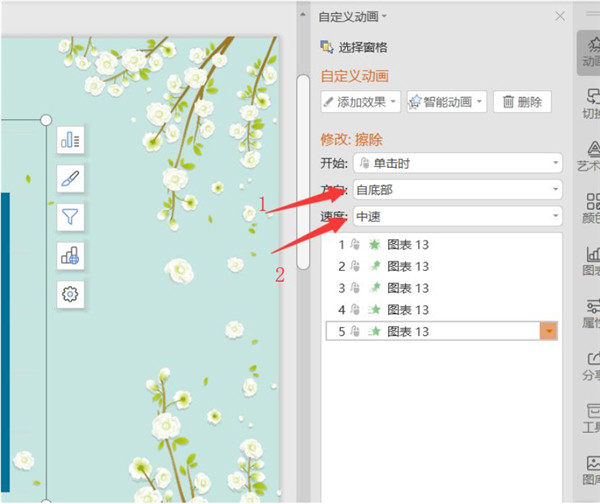 After completing the above steps, your dynamic chart is ready.
Articles are uploaded by users and are for non-commercial browsing only. Posted by: Lomu, please indicate the source: https://www.daogebangong.com/en/articles/detail/PPT-dong-tai-tu-biao-zhi-zuo-ji-qiao.html

 支付宝扫一扫
评论列表(196条)
测试