If you want to make data into icons in ppt, how should you make them? Let’s take a look at the introduction of icon styles in ppt. For more downloads, please click ppt home.
ppt template article recommendation:
PPT drawing list style tutorial
How to make a picture book style effect in ppt
How to make PPT into Polaroid photo style
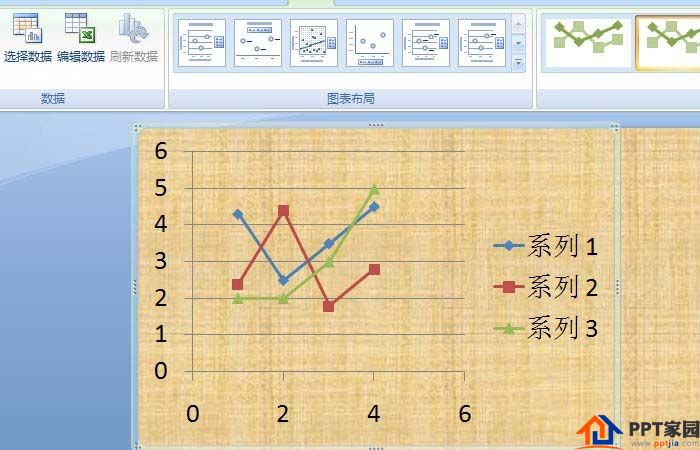
1. To use the scatter chart, click [Change Chart Type] with the left mouse button, and select various types of scatter charts on the (Change Chart Type) window. After selection, a scatter chart will be displayed on the PPT page. Click the chart, as shown in the figure below.
2. To use the surface chart, click [Change Chart Type] with the left mouse button, and select various types of surface charts on the (Change Chart Type) window. After selection, a surface chart will be displayed on the PPT page. As shown below.

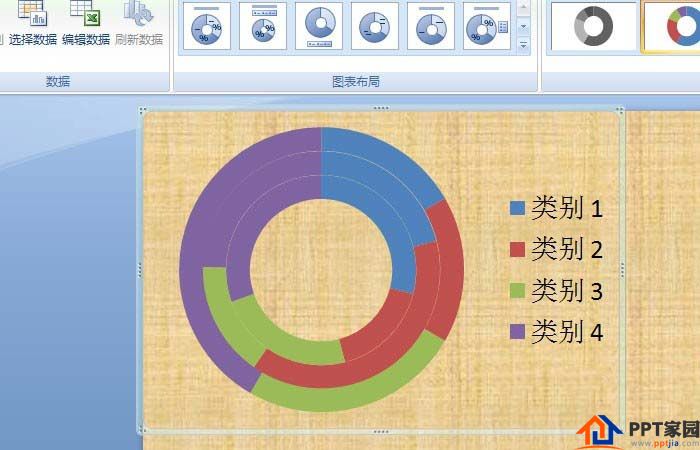
3. To use the donut chart, click [Change Chart Type] with the left mouse button, and select various types of donut charts on the (Change Chart Type) window. After selection, a circle will be displayed on the PPT page Ring chart, as shown in the figure below.
4. To use the bubble chart, click [Change Chart Type] with the left mouse button, and select various types of bubble charts on the (Change Chart Type) window. After selection, there is no bubble chart displayed because the data does not match. As shown below.

5. To use the radar chart, click [Change Chart Type] with the left mouse button, and select various types of radar charts on the (Change Chart Type) window. After selection, a radar chart will be displayed on the PPT page. As shown below.

6. To use the stock chart, click [Change Chart Type] with the left mouse button, and select various types of stock charts on the (Change Chart Type) window. After selection, a prompt window will pop up on the PPT page. Data needs to be modified to display a stock price chart, as shown in the figure below.

Articles are uploaded by users and are for non-commercial browsing only. Posted by: Lomu, please indicate the source: https://www.daogebangong.com/en/articles/detail/PPT%20special%20chart%20tool%20tutorial.html
 支付宝扫一扫
评论列表(196条)
测试