When we use Excel to make charts, we are used to making dynamic charts, which not only avoids chart stacking, but also improves the interactive experience!
In Excel, there are two common methods of dynamic charts:①slicer + perspective ②Control + common chart, method ① is simple and fast, method ② has flexible personality. We recommend that when making an analysis template, preferably use method ②, in order to achieve moreflexible and business-oriented display requirements, such as the dynamic chart of the Excel control in the figure below:

20 stores, you don't need to make 20 charts, a combo box control + a picture will solve the problem! This is a very practical and cool way to deal with it!
Then such a practical and cool dynamic chart, if it can be demonstrated in PPT, it will be shown in a meetingshowOne click, it will be perfect~
Of course this is possible! The following picture is the demonstration effect:
When you report your work in the meeting, demonstrate the above effects, and 20 stores can be perfectly presented in only one page of PPT! Thinking about the stunned eyes of your boss and colleagues will definitely give you a sense of accomplishment!
If you use a slicer to make a dynamic perspective, there is no way to demonstrate it in PPT; if you use a control to make a dynamic chart, you can demonstrate it in PPT!
The following explains the implementation steps:
1. Make dynamic charts in Excel first
This is a common practice and will not be explained here. The user's selection results are recorded in the Q2 cell of the dashboard worksheet, which is the driving engine of the dynamic chart.
2. Embed Excel files containing dynamic charts into PPT
Copy the cell area where the chart is placed in the Excel file (note that it is the cell area behind the chart, not the chart itself), in Open a new page in PPT, paste special>
3. Insert a combo box in PPT
In PPT, develop tools-controls, insert a combo box. If your PPT does not have a development tool, please call it in the file-option-custom ribbon first.
But this drop-down box, PPT does not provide a place for you to specify the drop-down selection and save the selection result, what should I do? Here is the difficult point. Next, we need to use VBA code to read the selection list from Excel and assign it to the drop-down box.
4. Write code in PPT
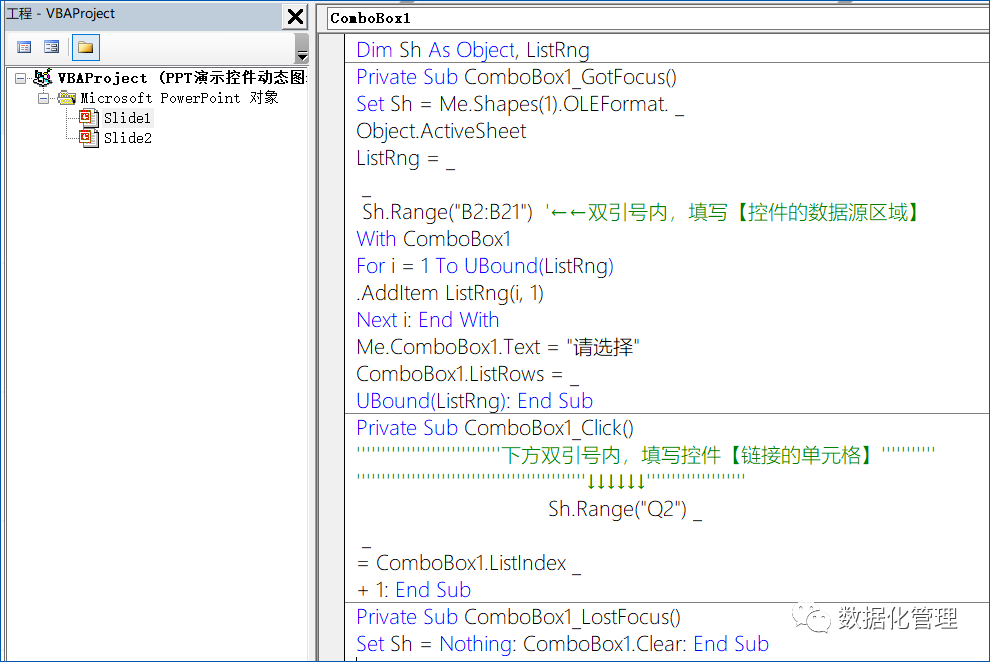
This needs to use VBA code to achieve subsequent things. Press Alt+F11 in PPT to come to the VBE window, which is the same as in Excel. Select an object such as slide1 or slide2 on the left (there is a small PPT icon in front of it), and enter the following code in the code area on the right: (The code is provided at the end of the article, you can copy it directly Yes)
The position pointed by the green arrow needs to be configured according to the configuration content of the Excel dynamic chart control in step 1, and the data source and link cell configuration.
What this code does is to open that every timePPT is shown and the drop-down box is selected The Excel file embedded in the PPT reads the B2:B21 range of the worksheet and assigns these options to the drop-down box. When you make a drop-down selection, the code will execute and write the result of your selection into the Q2 cell of the worksheet to drive the chart change.
5. Show PPT test dynamic chart
Now, exciting times are coming! Show the PPT, click the drop-down box with the mouse, and you may see a flash of the assigned value. At this time, the drop-down box may only have 1 line, and then click the drop-down box to fully expand it (this should be a small bug). Select an option, and the chart on the right can be switched dynamically! That's right, it is the effect as shown below:
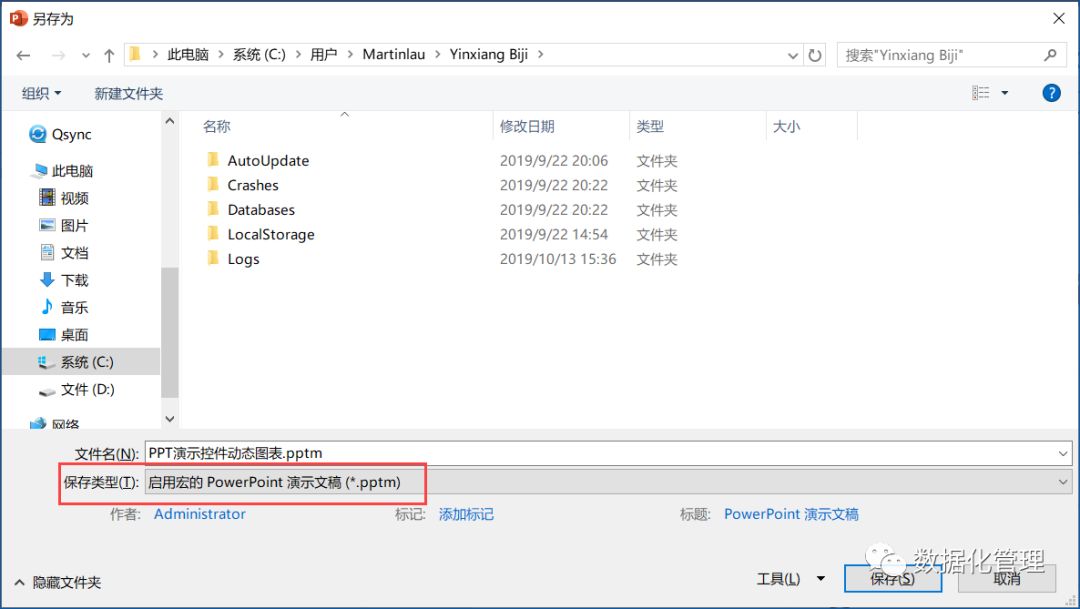
6. Save the PPT file
When saving the file, it will prompt that it contains macros, and choose to save it as a file with a suffix of .pptm with macros. There will be a macro prompt the next time you open it, just choose to enable macros.

7. Future data updates
After Excel is embedded in the PPT, the separate Excel file is not needed, so you should make sure to embed it after the Excel model is complete. When the data needs to be updated in the future, the embedded object in the PPT should be updated. Do not directly double-click to open, as the window is too small and inconvenient to operate. Right-click on the embedded object-sheet object-open, which will open a large Excel window for you to edit, which will be more convenient.
Summary
Some students may think it is too complicated, there are 7 steps, but in fact, as long as you make a dynamic chart in Excel, the following actions will be operated proficientlyless than 1 minute strong>It can be completed, because I have written the code for everyone, just copy and paste it and modify it to use~
PPT can perfectly support the presentation of all Excel charts, and even dynamic charts can be made directly in PPT. Of course, it is still necessary to use VBA code to achieve it, but it is not difficult. If you are interested in learning more advanced Excel dynamic chart, PPT dynamic chart knowledge, welcome to join "Shu Shuo" members, you can learn all the following content!
The course content is rich, close to the actual work scene, and the price is super high. It is suitable for all professionals to learn to improve their data analysis ability (click the picture below to enter the course introduction, click "read the original text" at the end of the article "coupons available):
Finally, the code of the PPT dynamic chart is attached, which can be copied directly. I wish you all a good time~
DimShAs< /span>PrivateSetSh=Me.Shapes(1).OLEFormat .>Object.ActiveSheetListRng=>>Sh.Range("B2:B21")'←←In the double quotation marks, fill in [control data source area]WithComboBox1Fori=1ToUBound(ListRng).AddItemListRng(i,1)Nexti:EndWithMe.ComboBox1.Text="Please choose"ComboBox1.ListRows=>UBound(ListRng):EndSubPrivateSubComboBox1_Click()< code>'''''''''< span>'''''''''' below the double quotes, fill in Control【Linked cell】'''''''''''''''''''''' span>'''''' '''''''''''↓ ↓↓↓↓↓'''''''''' ''''''''''< /span>Sh.Range("Q2") >=ComboBox1.ListIndex>+1:EndSubPrivateSubComboBox1_LostFocus()Set Sh = Nothing: ComboBox1. Clear: End Sub
Articles are uploaded by users and are for non-commercial browsing only. Posted by: Lomu, please indicate the source: https://www.daogebangong.com/en/articles/detail/PPT%20report%20visualization%20also%20come%20to%20play%20with%20dynamic%20chartsTutorial%20attached.html
 支付宝扫一扫
评论列表(196条)
测试