How to quickly convert PPT histogram charts to graphics? If you want to edit the charts made in PPT, you need to convert them into graphics for easy operation. Let's take a look at the tutorial of converting PPT icons to graphics.
ppt template article recommendation:
How to use ppt to make a matrix diagram with title
How to use PPT to make a beating love animation effect
How to use ppt to make picture edge softening effect
How to use ppt to set the picture as a three-dimensional effect
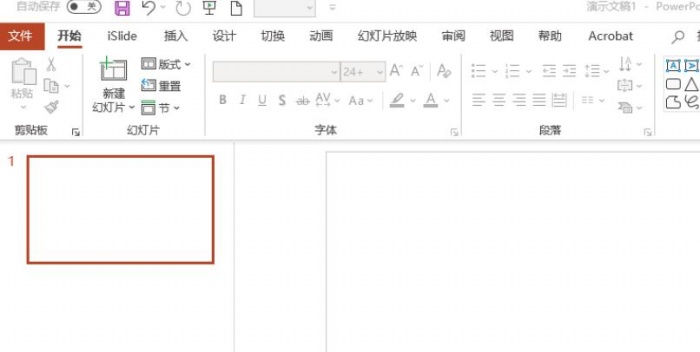
1. Open the PPT. As shown in the picture:
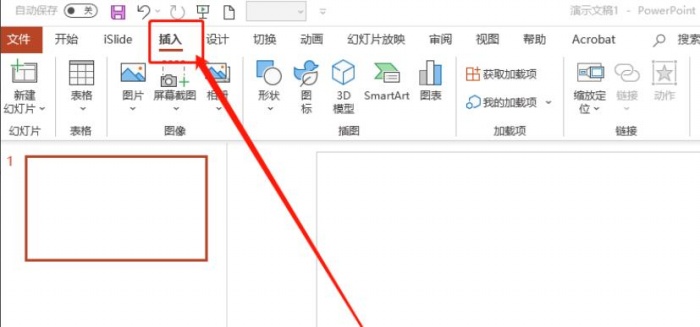
2. Select Insert. As shown in the picture:
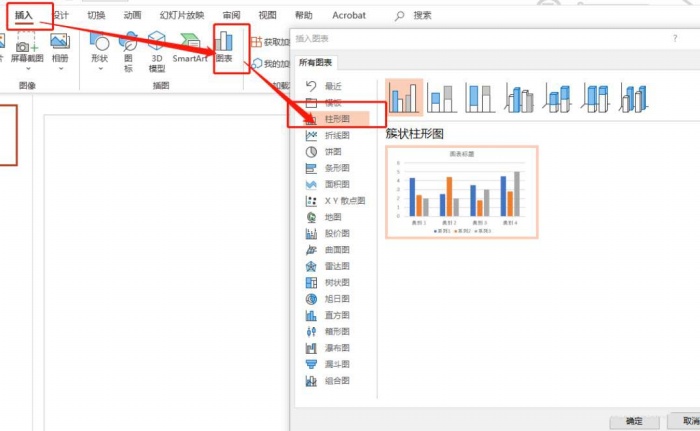
3. Insert a histogram. As shown in the picture:
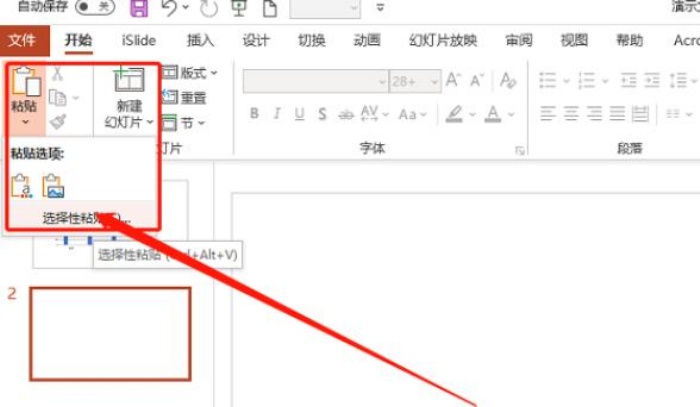
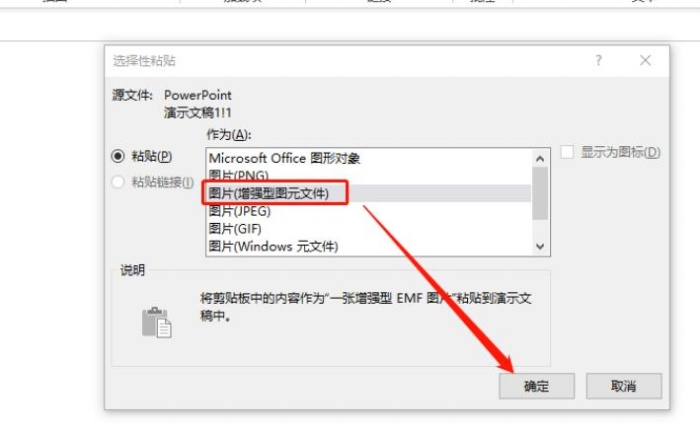
4. Copy the histogram, and then paste it selectively. As shown in the picture:
5. Select the Enhanced Metafile. As shown in the picture:
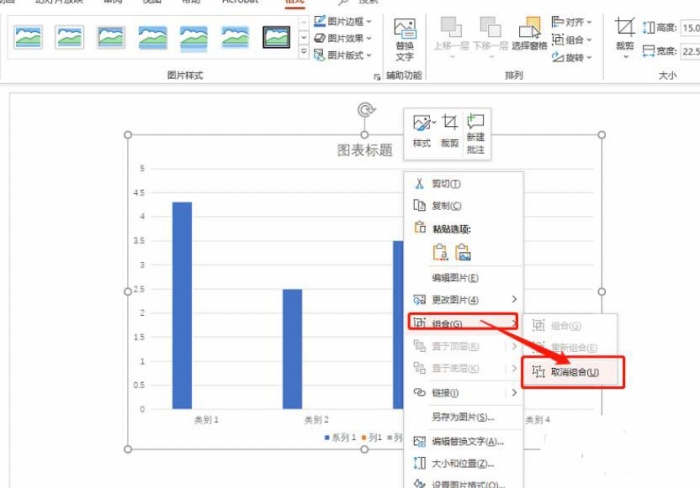
6. Ungroup (Ctrl + Shift + G). As shown in the picture:
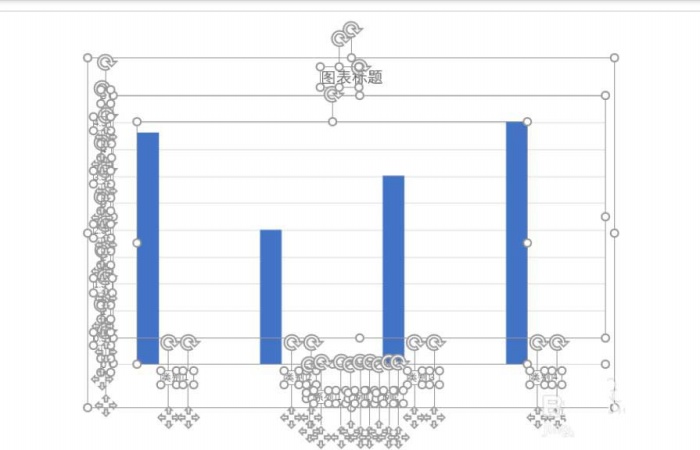
7. If there is another time, cancel the combination, and the graphics have been completely split at this time. As shown in the picture:
Articles are uploaded by users and are for non-commercial browsing only. Posted by: Lomu, please indicate the source: https://www.daogebangong.com/en/articles/detail/PPT%20histogram%20chart%20and%20then%20quickly%20converted%20to%20graphics.html
 支付宝扫一扫
评论列表(196条)
测试