No matter in life or work, solving problems is always from small to large, From simple to complex, it is often divided into four steps: first determine your current position (understand the problem), second determine the final place you want to go (determine the goal), then start specific execution (implementation plan), and finally check the execution when it is completed effect (validation result). In this article, let us graphically display the four-step process (4-Step Process) in PPT.
Directed four-step flowchart
The directed graph we are talking about here refers to the graph with arrows indicating the direction. Let's first look at the final effect of this example (Figure 1). The main difficulty is to make a circle with a gap, because by merging or splitting through ordinary methods, a circle with a "gap" can be obtained in the end, but It is automatically closed, so some other processing needs to be added during the production process.

Figure 1 Directed four-step flowchart
First start PowerPoint (this article takes the 2016 version as an example), create a new blank presentation document, draw a perfect circle in it and set it to no fill color, and set the bold outline to 3 pounds or so.
Next, draw a rectangle at random, making its height similar to the size of the gap to be opened by the circle, and superimpose the two graphics together. Double-select the circle and rectangle (select the circle first and then the rectangle), switch to the "Format" tab, and click "Merge Shapes → Cut" on the toolbar to get a concave circle.
Right-click the concave circle, select "Edit Vertex", and multiple black anchor points will be displayed on the graph. Right-click the anchor point on the concave shape and select "Open Path" to disconnect the originally closed shape (Figure 2).

Figure 2 Change closed graphics to open graphics
Right-click the anchor point on the concave shape and select "Delete Vertex" to delete a line. Drag and drop the remaining two straight lines to the left and the other horizontally to the outside of the circle, and draw a single arrow line to coincide with it, and a basic circular shape with a gap is completed (Figure 3). Add serial numbers and icons on this basis, then copy three copies and make corresponding modifications, and finally add other content, and you can get the PPT effect shown above.

Figure 3 Draw a circle with a gap
curved four-step flowchart
Next, let's make a four-step flow chart with a curve forward, and let's take a look at the final effect first (Figure 4).

Figure 4 The effect of the four-step flow chart of the curve forward
The basic shape of this graphic is actually a semicircle, and we can use two arcs to stitch it together. First draw a square, choose no fill color, as a reference shape. Next, select the "arc" shape, hold down the Shift key, press the left mouse button and drag from the vertex of one corner of the square to its opposite corner, and a quarter of a positive arc will appear ( Figure 5).

Figure 5 Draw a quarter arc
Copy the arc you just drew, and flip it horizontally. Put the two arcs together and combine them to complete an open semicircle. Next, make another copy of the open semicircle and turn it into a white dotted line. The line of the previous semicircle becomes thicker, for example, the author set it to 36 points. Overlap the two semicircles to unite them again (pictured).

Figure 6 Drawing an open semicircle
After the basic shape is made, the next step is very simple. Make several copies of the open semicircle, flip two of them vertically, and then stitch them together to form a curve. For the arrow part of the curve, just draw a triangle, rotate it at the appropriate angle, and snap it together. Finally, add other graphics and corresponding text to get the effect shown in the previous article.
Tips: In the second example, the reason why we use arcs to form a semicircle is because if we use the method of graphic combination and cutting, redundant closed lines will appear. For a closed semicircle, if the method of deleting vertices in the above example is applied, the semicircle will be deformed.
Step-by-step four-step flowchart
Now let's make a four-step flow chart of the "step up" effect. This figure looks complicated, but it is actually a combination of circles and straight lines, and it is very simple to make (Figure 7).

Figure 7 Effect of step-by-step four-step flowchart
First draw a perfect circle, set it as no fill color, and set the contour line to 36 points (the thickness depends on the specific situation), and then set the shadow effect to enhance the three-dimensional effect. Next, draw two straight lines directly, the line width is equal to the outline of the circle (36 points in this example), and also set the shadow effect, and place them under the circle. After they are arranged, the basic shape can be completed (Figure 8).

Figure 8 The combination of circles and straight lines into basic shapes
The next step is very simple, copy a few more copies of the basic shape, arrange them from low to high, and then add appropriate graphic decoration and content.
In short, dividing a complete process into different steps allows us to understand the problem more clearly, thus simplifying complex tasks. So our purpose is not to make complex graphics, but to express ideas clearly. For example, we can simply import a graphic, add the serial number and content, and quickly create a tabular four-step flow chart (Figure 9). Although it looks simple, it is also very practical.
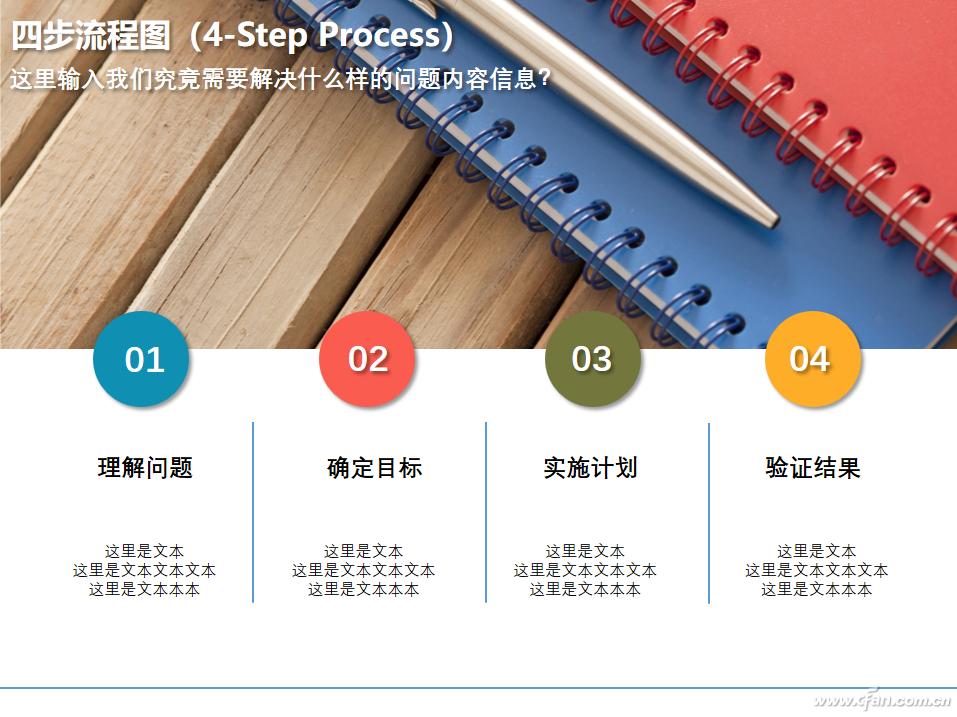
Figure 9 four-step flowchart

Articles are uploaded by users and are for non-commercial browsing only. Posted by: Lomu, please indicate the source: https://www.daogebangong.com/en/articles/detail/Office%20tips%20fourstep%20flow%20chart%20for%20PPT%20production.html
 支付宝扫一扫
评论列表(196条)
测试