There is no gap without comparison. In PPT, in order to highlight the changes of certain things, we often change them before and after The effects are compared together, such as the comparison of spring and winter scenery in a certain place, the construction comparison of a certain place after an earthquake, etc. However, if you just arrange two pictures together mechanically, sometimes the effect is not very good, and with the help of the tools that come with PowerPoint (this article uses the 2016 version as an example), we can create a cooler comparison effect picture.
Animation plus screenshots to create winter-spring effect comparison
If you need to compare some things in the PPT, such as to highlight the white snow in winter and the gloomy spring in spring, we You can use PowerPoint's animation components + screenshots to make a winter and spring scenery comparison effect map.
First, prepare two pictures with similar themes. Here we take the winter and spring background picture of the church as an example. After starting PowerPoint, create a new slide, insert the prepared two pictures into the same slide, adjust their size to be consistent, and place them overlapping (Figure 1). It can be seen that if the two photos are only placed together mechanically, there will be a lack of transition between the photos, which cannot express the theme we need very well.
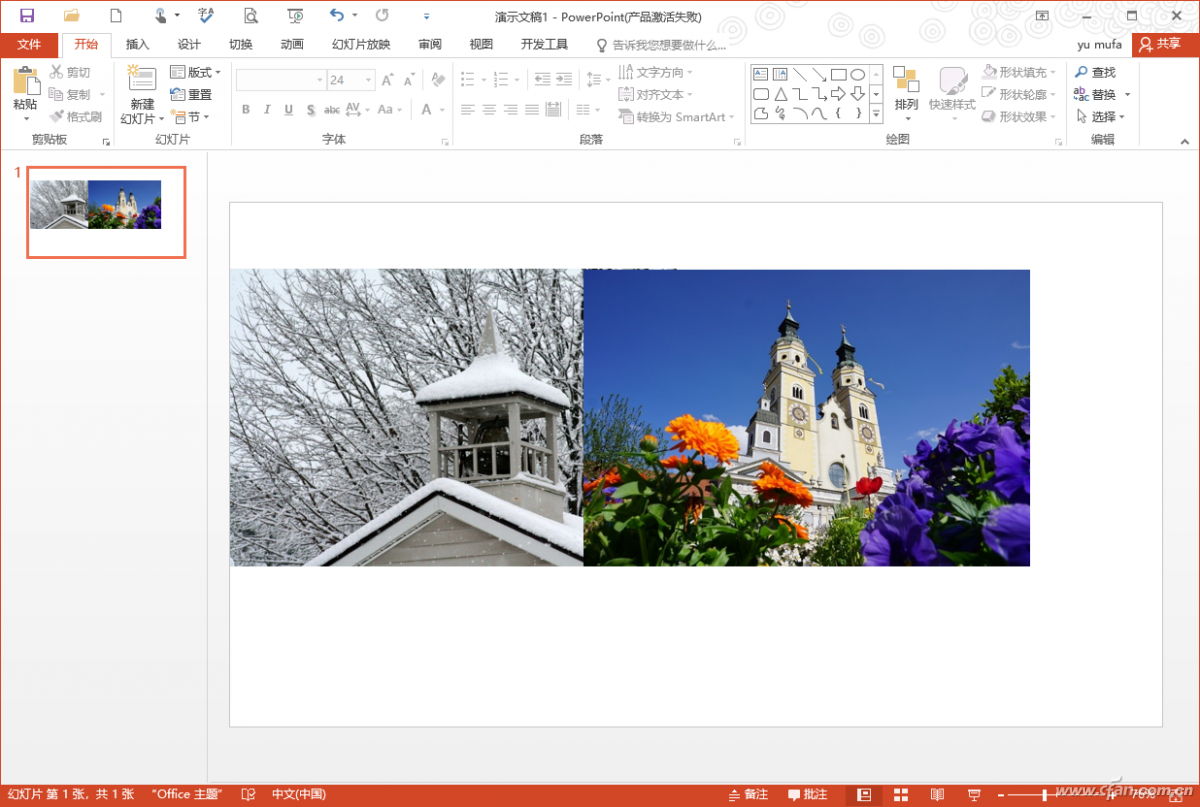
Figure 1 Adjustment picture
Now let's animate the photo. First select photo 1, switch to "Animation", select the "Erase" effect, and then set the direction to "From Left" in the "Effect Options", set the start playback to "When clicked", and set the duration It is "5.5s" (the longer the time, the more convenient for subsequent screenshots), and the others keep the default settings (Figure 2).

Figure 2 Add animation effects
Continue to select photo 2, and add the "erase" effect to it as above, and set the direction in the "Effect Options" Set it to "From the Right", set the start playback to "Simultaneous with the previous animation", and set the duration to "5.5s", and keep the default settings for others. After completing the above settings, click "Preview", and you can see that the two photos will use the erasing animation effect in opposite directions, and the erasing effect will be superimposed on the overlapping area. What we need is the transition effect of the overlapping part. After previewing the transition effect you are satisfied with, press the PrintScreen key on the keyboard to take a screenshot, then open the "Paint" program to paste the screenshot, and copy and save the comparison effect picture you need (Figure 3).
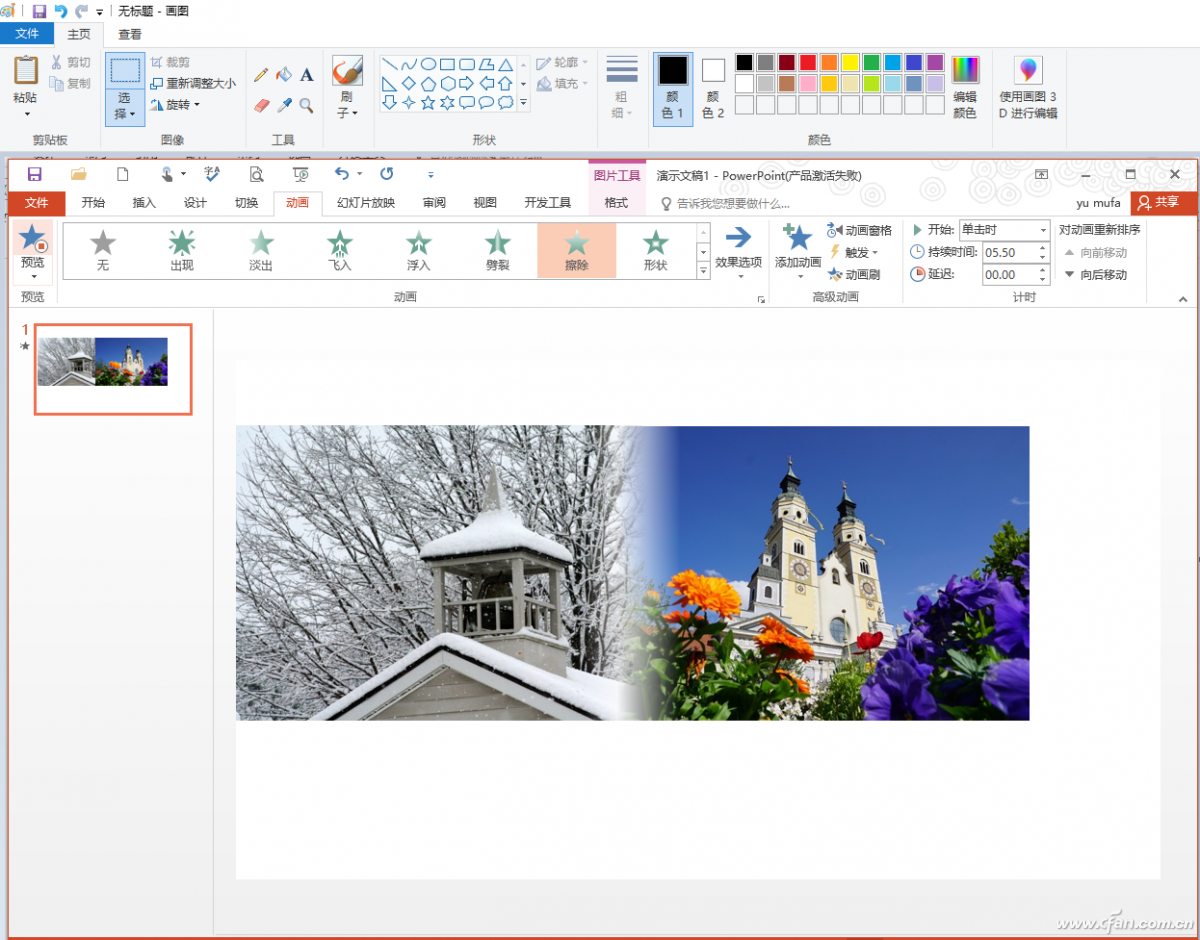
Figure 3 screenshot extraction image
Return to the PowerPoint window, and insert the copied picture above into the slide again. The transition is natural, and the effect of the whole photo transitions from the snow-covered winter to the desolate green early spring. Is this comparison better than the simple side-by-side of two pictures (Figure 4).
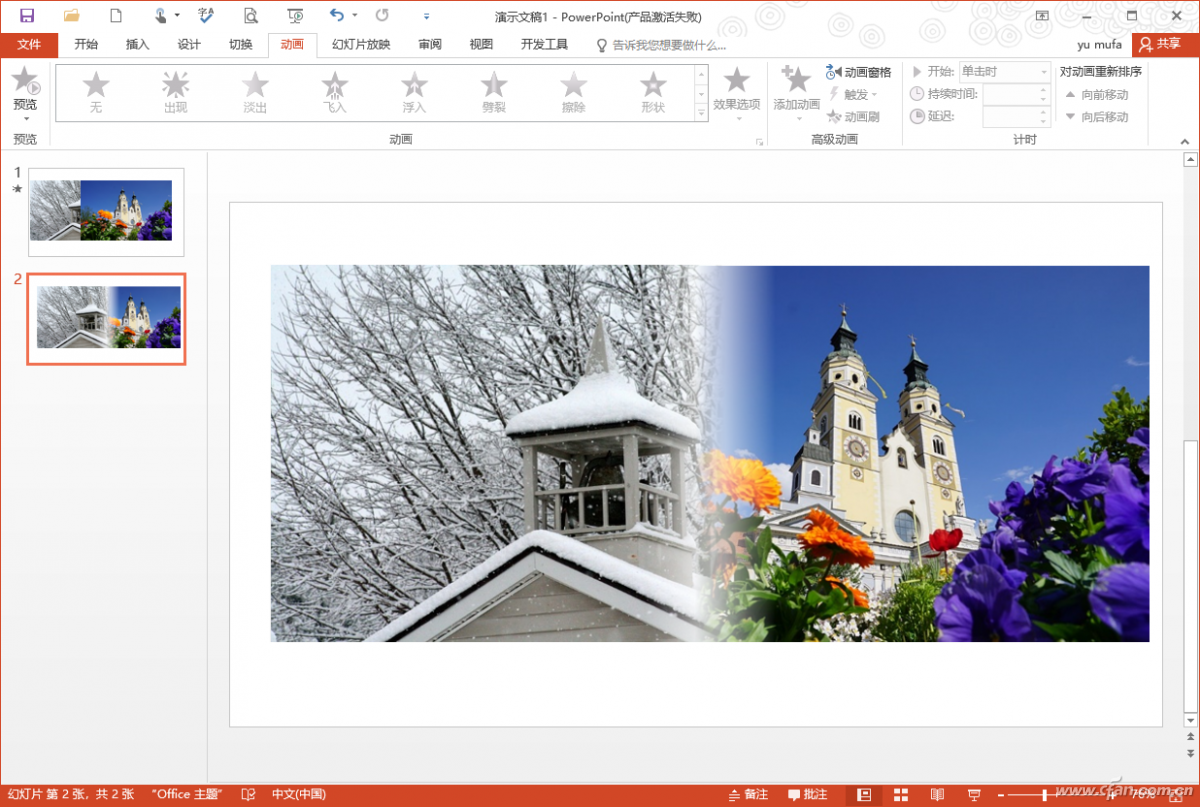
Figure 4 before and after comparison
Finally, you can add text descriptions on the effect diagram. In order to better highlight the text effect, you can insert a rectangle Add a layer mask over it. Click "Insert→Shape→Rectangle", insert a rectangle with the same size as the picture on the picture, fill the rectangle with gray and set appropriate transparency, then add theme text on it and modify it a little, such as "Winter" Paste the word "spring" as a picture and set it to white and green, so that a slideshow showing the contrast between winter and spring is completed (Figure 5).
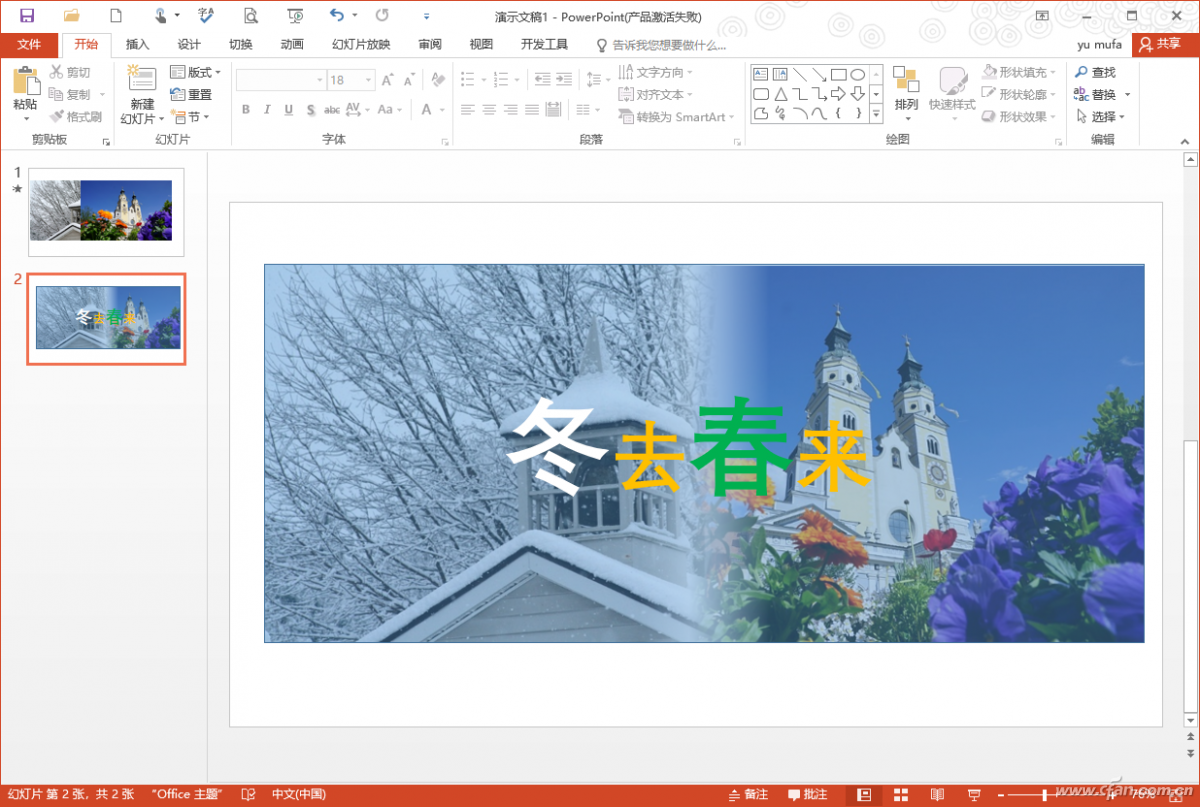
Figure 5 final rendering
Shape and mask to combine past and present
If you want to express the before and after effects of a certain place in PPT, you can use PowerPoint's shape fill + mask Combination to achieve, for example, we want to make a comparison map reflecting the construction of a certain place after the earthquake.
First prepare two pictures of the ruins after the earthquake and the picture after the construction at the same place, and then insert the ruins after the earthquake in the slide For the picture, in order to better highlight the effect of the ruins, it is recommended to adjust the photo to black and white display, select the photo and click "Picture Tools → Format → Recolor → Grayscale" (Figure 6).
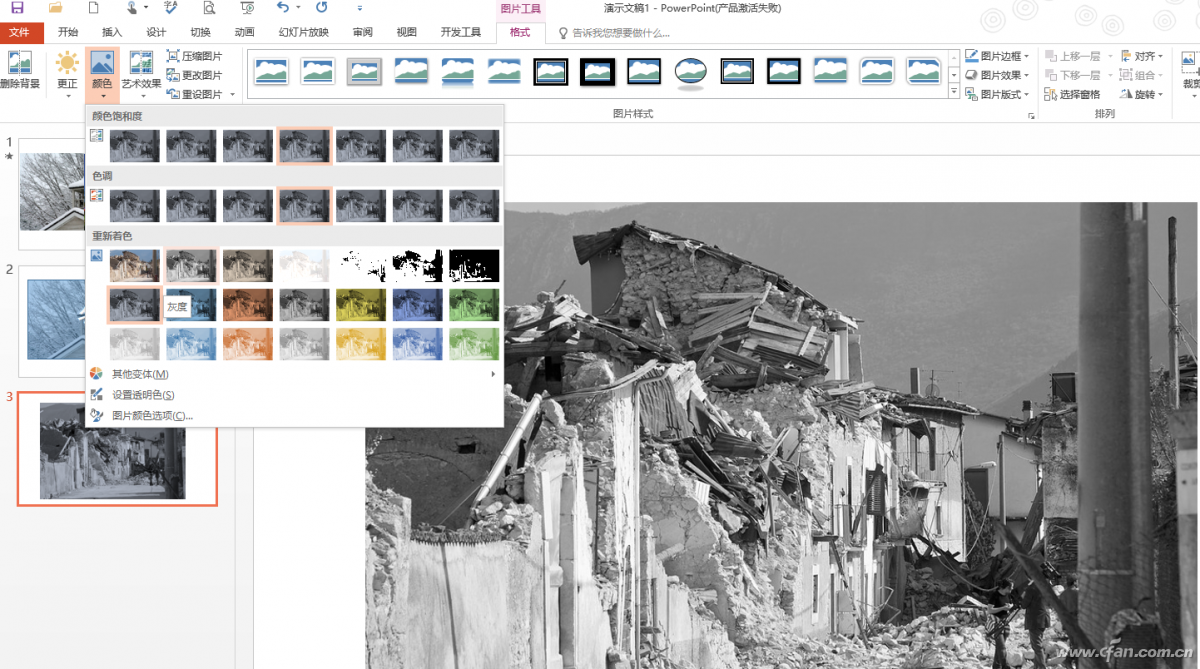
Figure 6 image processing
Continue to insert a picture of reconstruction after the earthquake in another slide, click "Insert→Shape→Free Curve" , and then draw an irregular curve according to your actual needs, where the free curve range needs to include the common area of the two pictures (such as the road in the example picture).
Then copy the picture rebuilt after the earthquake, right click on the curve and select "Set Image Format", in the right pane Switch to "Shape and Options → Fill and Line", select "Picture or Texture Fill → Clipboard", and fill it with the picture reconstructed after the earthquake (Figure 7).
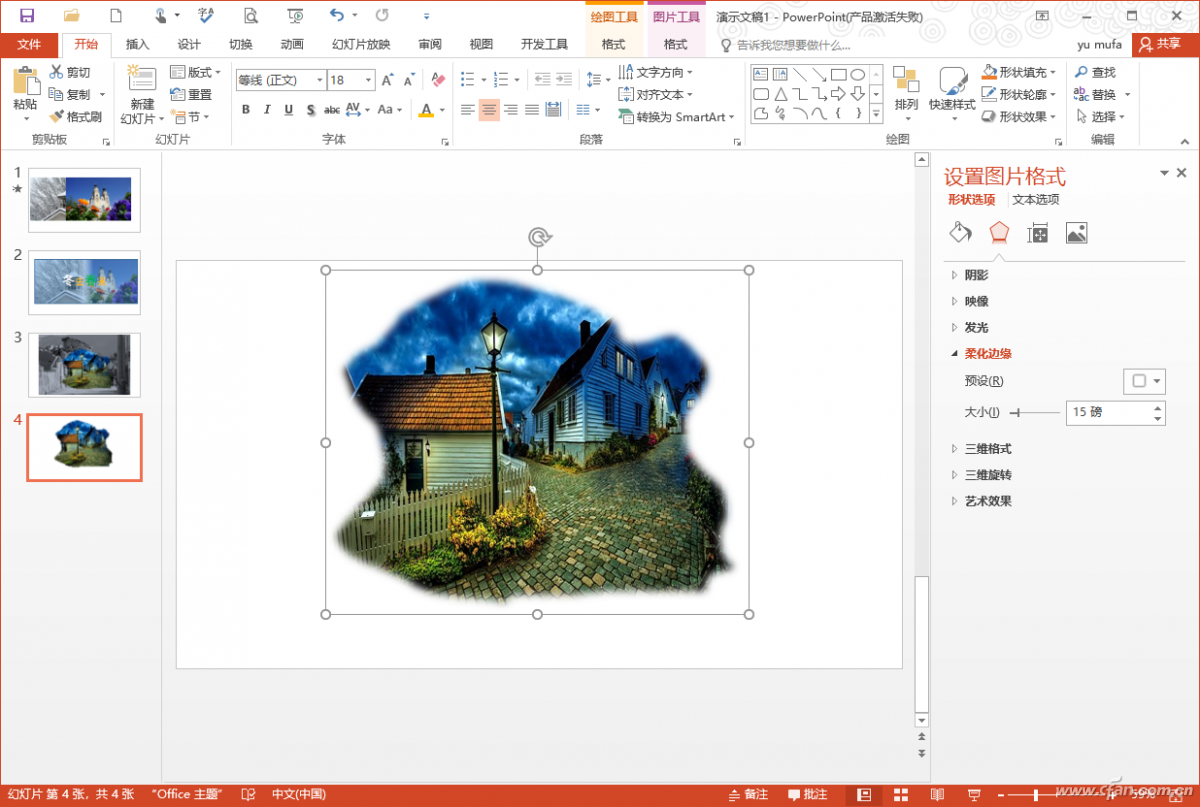
Figure 7 fill picture
Copy this shape and paste it on the ruins picture, adjust the size and position at the same time, try to make the two pictures have the same feature points coincident with each other (such as the road in the example). Select the inserted shape, right-click and select "Format Picture", switch to "Effect → Soften Edges" in the right pane, and set its softening to 15 points, so that the transition between pictures will appear more natural ( Figure 8).
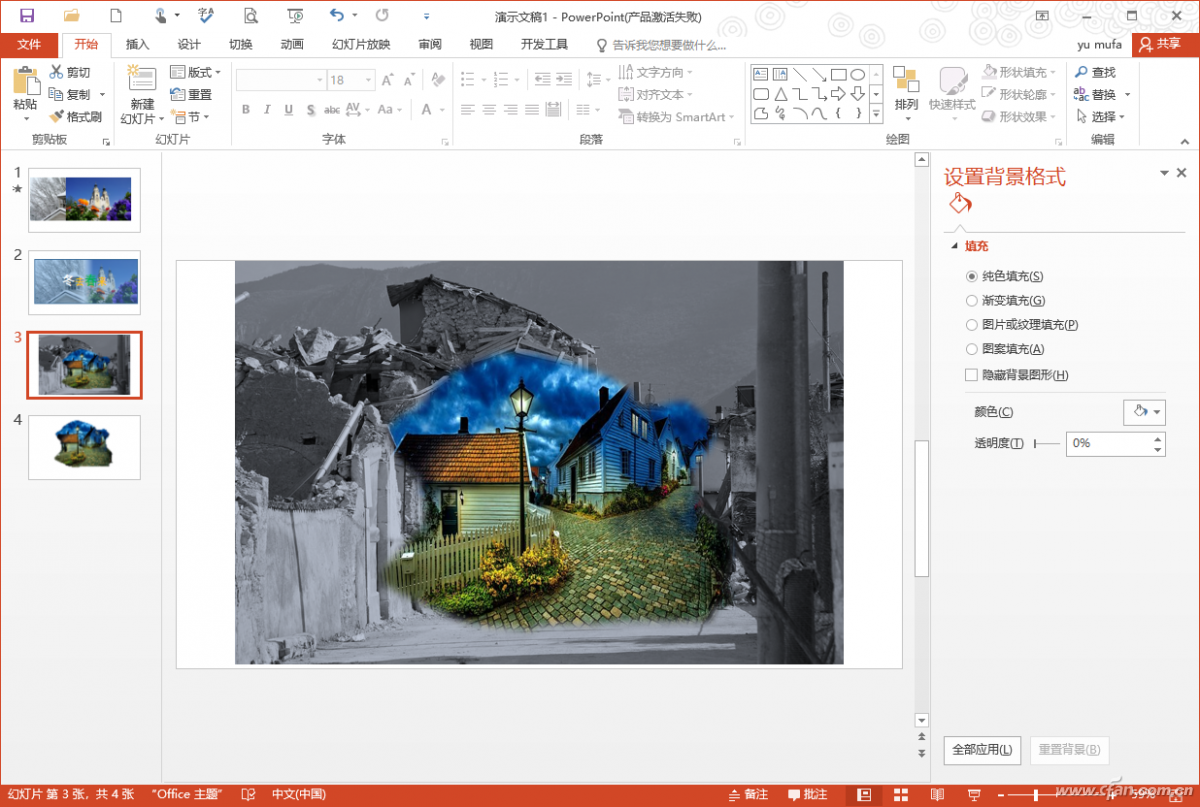
Figure 8 Soften edges
Finally, add and insert a rectangular mask for the picture, set the fill to "gradient", insert the theme text on the picture as above , so that a slideshow of the contrast effect of the earthquake ruins and the post-earthquake construction is completed. Of course, we can also do more splicing and comparison according to our actual needs, such as left-right comparison, up-down comparison, as long as the front and back of the same landmark (such as a certain road, a certain building) are connected together (Figure 9).
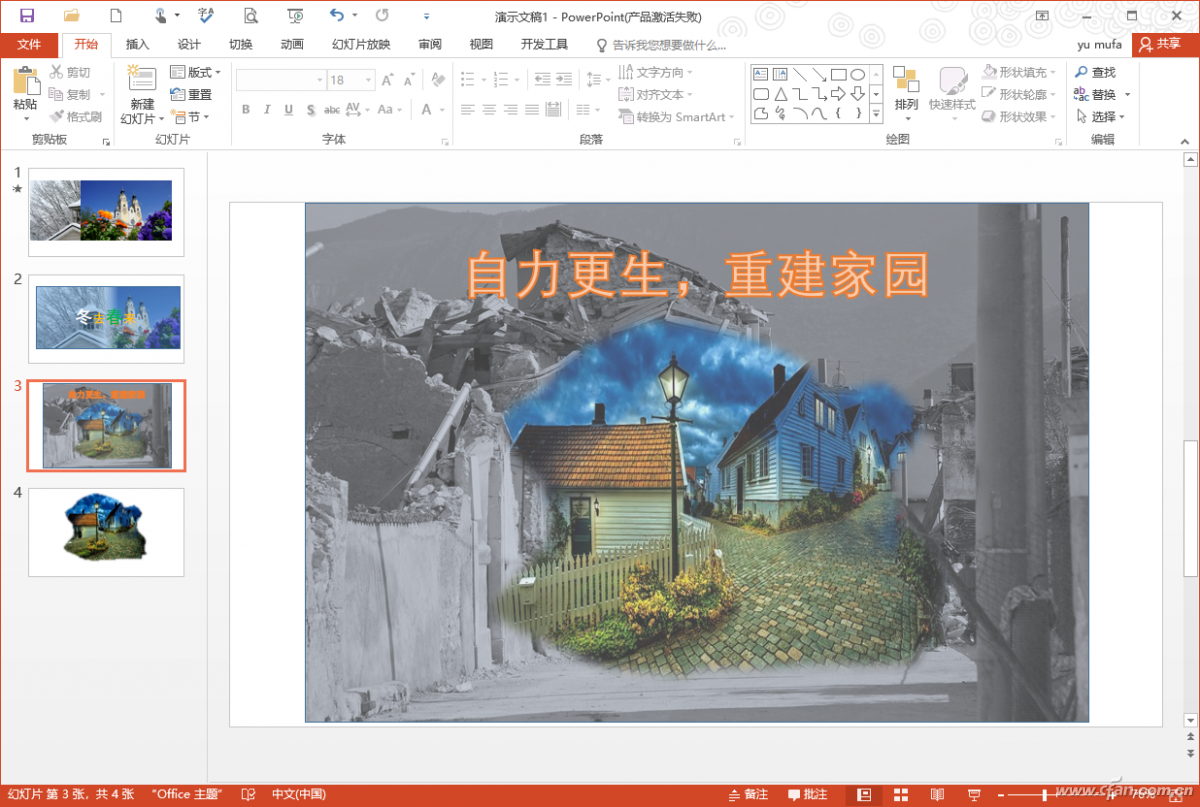
Figure 9 Final comparison

Articles are uploaded by users and are for non-commercial browsing only. Posted by: Lomu, please indicate the source: https://www.daogebangong.com/en/articles/detail/Office%20tips%20combine%20two%20into%20one%20PPT%20to%20make%20a%20cool%20comparison%20chart.html
 支付宝扫一扫
评论列表(196条)
测试