? Shared Sharing · Tweet Navigation | www.lianxh.cn

? Stata: Stata Basics | Stata Drawing< /span> | Stata Programs | Stata New Commands ? Paper: Data Processing | Result output | Thesis writing | Data sharing ? Measurement: Regression Analysis | Interproductive Item-Adjustment | IV-GMM | Time Series | Panel Data | Spatial Measurement | Probit-Logit | Quantile Regression ⛳ Topics: SFA-DEA | Survival Analysis | Crawler | Machine Learning | Text Analysis< /section> ? Causality: DID | RDD | causal inference | synthetic control method | PSM-Matching ? Tool: tool software | Markdown | Python-R-Stata ? Course: Open Class-Live | Measurement Topic | About Lianxianghui

Theory + Demonstration: From "reading the model" to "tossing the model"
? Theoretical model construction topic
? April 23-24, 2022 (Saturday-Sunday)
? Associate Professor Guo Kaiming (Sun Yat-Sen University)
? Course Homepage:< span >https://gitee.com/lianxh/emodel

Author: Chen Zhuoran (Sun Yat-sen University Lingnan College)
Email: chenzhr25@mail2.sysu. edu.cn
Editor's note: This article mainly refers to "Paul Goldsmith-Pinkham: beamer-tips", thanks!
Directory
1. Readability
2. Color
3. Font Size, Typeface, and Readability
4. Graphics
5. Form
6. Some other tips
7. Appendix
8. Related tweets
Reminder: The link in the article will not work in WeChat. Please click 「Read the original text」 at the bottom. Or long press/scan the following QR code directly to the original text:

Professor Paul Goldsmith-Pinkham published some tips on using Latex to make Beamer on his "homepage". A standard academic paper slide. For the download and installation of Latex, you can refer to the tweet "LaTeX Xiaobai Getting Started: TeXLive Installation and Use". For the introduction of Beamer, you can refer to the tweet "Sharing Club Tools: Beamer Slideshow Maker".
1. Readability
In this Section, we introduced how to effectively make transition slides and improve the spacing between lines to enhance the readability of slides. First of all, the author suggests that we use transitionframe instead of frame for better section-to-section separation. In order to use this command, we first need to format transitionframe in the preamble. For example, the author sets transitionframe to the following format:
ewenvironment{transitionframe}{
 setbeamercolor{background canvas}{bg=yellow}
 egin{frame}}{
 end{frame}
}
Afterwards we simply use egin{transitionframe} and end{transitionframe} are enough.
 egin{transitionframe}
 egin{center}
 {Huge extcolor{black}{Spacing and Words}}
 end{center}
end{transitionframe}
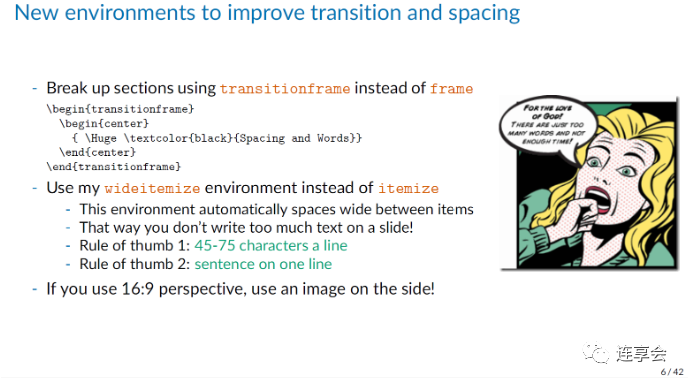
Secondly, in order to enhance the readability of each slide, the author suggests that we use wideitemize instead of simple itemize< /code>. Because this automatically increases the spacing between lines, it makes it very easy for the audience to understand what the slide is trying to convey. Specifically, you can first use wideitemize to divide several large points in a slide, and then if you want to insert several small points in each large point, you can use itemize , so that the entire slide will be well organized. If you don't believe me, you can compare the two slides below.

In order to use wideitemize, you need to set the wideitemize environment in the introduction part, as follows:
ewenvironment{wideitemize}{itemizeaddtolength{itemsep}{10pt}}{enditemize}
AtBeginSection[]{%
 egin{frame}%
frametitle{Roadmap of Talk}% This is the roadmap page You can modify the title as appropriate.
 ableofcontents[currentsection] %
end{frame}%
}
then add before each section section{name}, so that each section can be preceded by a table of contents, as follows:

2. Color
The author recommends not to use traditional red and blue, because it is not very friendly to people who are colorblind. Instead, the author suggests that we refer to the following colors and design our own colors.
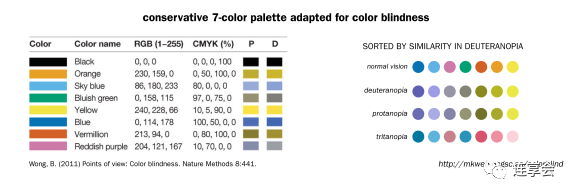
For example, the color used by the author is:
definecolor{blue}{RGB}{0,114,178}
definecolor{red}{RGB}{213,94,0}< br>definecolor{yellow}{RGB}{240,228,66}
definecolor{green}{RGB}{0,158,115}
Of course, if you guys don't like the colors provided by the author, you can make your own colors. As for the background color of the slideshow, it can be said that the beholder has a different opinion. However, in small academic conferences, it is generally better to use black text on a white background. Below is a background color provided by the author (similar to an off-white).
definecolor{MyBackground}{RGB}{255,253,218}
If you are making a report in a large auditorium, for example, in an occasion like an Apple conference, maybe white text on a black background is also a good choice. If you want to use black and white text, you can refer to the following code:
{ setbeamercolor{background canvas}{bg=black}
 egin{frame}
 extcolor{white}{Example for an auditorium -- contrast is much higher}
end{frame}
}
3. Font size, font and readability
First of all, don't change the font size just for the text, because often you have placed too much text at this time. But for the typed text, we can easily notice the font size, and what is often overlooked by us is the font size in the graphics. For example, compare the following two images:
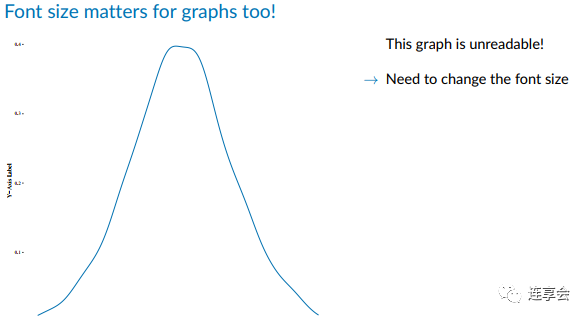
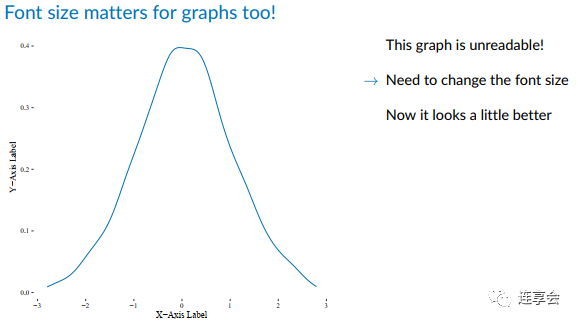
As for how to adjust the font size in the graphics, it depends on the software, so I won't elaborate here. The second thing worth mentioning is the font. You can adjust the font of the slideshow according to your own preferences. You only need to type the following code in the introduction part.
usepackage[default]{lato}
But you need to choose the right package, "
4. Graphics
Adjust graphics in Latex The size of is often a very troublesome problem, the author gave us a little trick, use the following code:
esizebox{0.7linewidth}{!}{
 includegraphics{figure1_effect.pdf}}
wherelinewidth is a pre-defined value, we only need to adjust the previous multiple. Without exception, centering graphics is always a good choice. But in some cases, we may prefer to show the change of a graph, and at this time we need the same effect as the animation in PPT. It is not difficult to achieve such an animation effect in the slideshow, just use the following line of code:
only<slidenum>
in The numbers in <> are actually the order in which you want the graphics to appear. Of course, in addition to only, there are many similar animation commands, such as uncover, onslide, visible, invisible, you can refer to this blog for details.
5. Form
The form is indeed a very For difficult questions, I recommend you to use the "Table Generator" website first. But this website can only make standard forms, and it can't do anything about the three-line forms that are often used in academics. Let me introduce in detail how to make a three-wire table. First, in order to adjust the position and size of the table, we use the following code. NOTE: Instead of using the table environment, use tabular.
makebox[linewidth][c]{
 egin{tabular}{l cc ddd}
 results...
end{tabular}
Next, to create a three-line table, we need to use booktabs, of course The usepackage{booktabs} package needs to be introduced in the preamble. The so-called three-line table, as the name implies, requires three lines: the top line, the middle line, and the bottom line. These three lines are often thicker than the rest of the lines in the table. The booktabs package provides three commands to draw these three lines, namely oprule, midrule, ottomrule. Also, to draw horizontal lines spanning only a few columns in a table, the cmidrule command is needed.
Although it is not necessary, in order to make the three-line table more beautiful, we'd better introduce another package dcolumn in the introduction part. This package can characterize the characteristics of the column more finely, such as the width of the column. Friends who are interested in specific content can refer to "The dcolumn package". In short, we should type the following code in the preamble:
usepackage{dcolumn}
ewcolumntype{d}[0]{D{.}{.}{5}}
One thing to mention is that if a small partner wants to display some content across columns, there is no need to load multirow< /code> package. But if you want to be able to display across rows, you need to load the multirow package in the preamble, that is, usepackage{multirow}. Then how to use multirow or multicolumn? The basic syntax format is:
%multi-column
multicolumn{number of cols}{align}{text} % align: l(left),c (middle),r(right)
%multi-row
usepackage{multirow}
multirow{number of rows}{width}{text}
Pay attention to the width option in the brackets between multirow, we usually set it to *, Indicates the natural width using the third text parameter. For a more detailed explanation, you can refer to "Multi-column and multi-row cells in LaTeX tables". In order for the three-line diagram to compile smoothly, we need to type the following lines of code in the introduction part:
usepackage{booktabs}
% usepackage{multirow}
usepackage{dcolumn}
ewcolumntype{d}[0 ]{D{.}{.}{5}}
I will use an example provided by the author to give you a detailed introduction. For example, everyone hopes to draw the following exquisite three-line table:
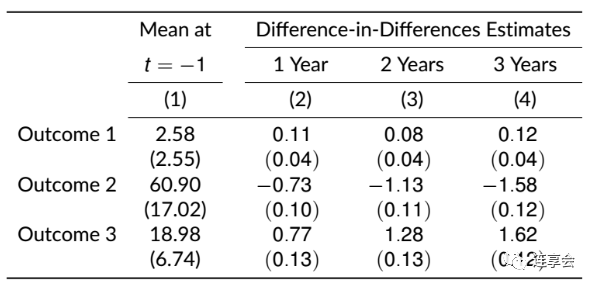
makebox[linewidth][c]{
 egin{tabular}{lccddd} % Note here d It is set when setting up the dcolumn package according to the first part
 oprule % online
 & Mean at && multicolumn{3}{c}{Difference-in-Differences Estimates} \
 cmidrule{4-6 } % here means to draw a horizontal line spanning 4 to 6 columns
 & $ t=-1 $ &&multicolumn{1}{c}{1 Year} & multicolumn{1}{c}{2 Years} & multicolumn {1}{c}{3 Years} \
 cmidrule{2-2} cmidrule{4-6} % Draw horizontal lines of 2 columns and 4-6 columns respectively
 & multicolumn{1}{c }{(1)} &&multicolumn{1}{c}{(2)} & multicolumn{1}{c}{(3)} & multicolumn{1}{c}{(4)} \
 cmidrule{ 2-6} % Draw a horizontal line spanning columns 2-6
 Outcome 1 & 2.58 && 0.11 &0.08 & 0.12\
 & (2.55) && (0.04) & (0.04) & (0.04)\ < br> Outcome 2 & 60.90 && -0.73 &-1.13 & -1.58\
 & (17.02) && (0.10) & (0.11) & (0.12) \
 Outcome 3 & 18.98 && 0.77 &1.28 & 1.62 \
 & (6.74) && (0.13) & (0.13) & (0.12)\
 ottomrule % offline
end{tabular}
}
In general, it is not enough to have the above-mentioned exquisite three-line diagram in academic conferences, and you may not want teachers or judges to read all the contents of the entire table. But at this time, if only two or three cells are listed, it will look awkward. Therefore, some cells need to be framed at this time, so that teachers can focus on the key points. For example, the following form:
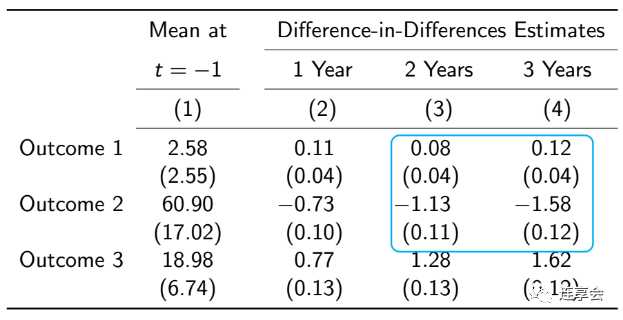
To implement such a function in Latex, it is necessary to introduce the tikz drawing package in the introduction part and make corresponding settings.
usepackage{tikz}
usetikzlibrary{matrix,shapes,arrows,fit,tikzmark}
%%% TIKZ STUFF< br> ikzset{
 every picture/.style={remember picture,baseline},
 every node/.style={anchor=base,align=center,outer sep=1.5pt},
 every path /.style={thick},
 }
ewcommandmarktopleft[1]{%
 ikz[overlay,remember picture]
 ode (marker-#1-a) at (-.3em,. 3em) {};%
}
ewcommandmarkbottomright[2]{%
 ikz[overlay,remember picture]
 ode (marker-#1-b) at (0em,0em) {}; %
}
 ikzstyle{every picture}+=[remember picture]
 ikzstyle{mybox} =[draw=black, very thick, rectangle, inner sep=10pt, inner ysep=20pt]
 ikzstyle{fancytitle} =[draw=black,fill=red, text=white]
%%%% END TIKZ STUFF
Then, when drawing a three-line table according to the previous introduction, add marktopleft before the number in the upper left corner of the numbers you want to frame, and add markbottomright after the number in the lower right corner code>. Finally, after drawing the three-line table, add the following setting command:
{ ikz[overlay,remember picture,inner sep=1pt]
ode[draw=cyan,rounded corners,fit=( marker-a1-a.north west) (marker-a1-b.south east)] {};}
where you can Adjust the color of the frame according to your favorite color, just change the option of draw. It can be seen that in order to frame certain cells in the table, it is still a bit cumbersome, but it is recommended that you use it as a template, after all, the settings of many of the parameters do not need to be adjusted too much. Next, I will paste all the codes needed to draw the above table below for the reference of friends in need.
% preamble
usepackage{booktabs}
usepackage{dcolumn}
ewcolumntype{d}[0]{D {.}{.}{5}}
% usepackage{multirow} Only use if you want to cross lines
usepackage{tikz}
usetikzlibrary{matrix,shapes,arrows,fit,tikzmark}
% %% tikz settings
 ikzset{
 every picture/.style={remember picture,baseline},
 every node/.style={anchor=base,align=center,outer sep=1.5pt },
 every path/.style={thick},
 }
ewcommandmarktopleft[1]{%
 ikz[overlay,remember picture]
 ode (marker-#1-a) at (-.3em,.3em) {};%
}
ewcommandmarkbottomright[2]{%
 ikz[overlay,remember picture]
 ode (marker-#1-b) at ( 0em,0em) {};%
}
 ikzstyle{every picture}+=[remember picture]
 ikzstyle{mybox} =[draw=black, very thick, rectangle, inner sep=10pt, inner ysep=20pt]
 ikzstyle{fancytitle} =[draw=black,fill=red, text=white]
%%%% Tikz is set up
% tabulation required
makebox[linewidth ][c]{
 egin{tabular}{l cc ddd}
 oprule
 & Mean at && multicolumn{3}{c}{Difference-in-Differences Estimates} \
 cmidrule{ 4-6}
 & $ t=-1 $ &&multicolumn{1}{c}{1 Year} & multicolumn{1}{c}{2 Years} & multicolumn{1}{c}{3 Years} \
 cmidrule{2-2} cmidrule{4-6}
 & multicolumn{1}{c}{(1)} &&multicolumn{1}{c}{(2)} & multicolumn{1}{c }{(3)} & multicolumn{1}{c}{(4)} \
 cmidrule{2-6}
 Outcome 1 & 2.58 && 0.11 &marktopleft{a1}0.08 & 0.12\
 & (2.55) && (0.04) & (0.04) & (0.04)\
 Outcome 2 & 60.90 && -0.73 &-1.13 & -1.58\
 & (17.02) && (0.10) & (0.11) & ( 0.12)markbottomright{a1}{red} \
 Outcome 3 & 18.98 && 0.77 &1.28 & 1.62\
 & (6.74) && (0.13) & (0.13) & (0.12)\
 ottomrule
end{tabular}
}
{ ikz[overlay,remember picture,inner sep=1pt]
ode[draw=cyan,rounded corners,fit=(marker-a1-a.north west ) (marker-a1-b.south east)] {};}
end{frame}
6. Some other tips
For For very long mathematical formulas, we'd better use different colors and add some notes to make it easier for readers to understand the meaning behind the formulas. For example, if you use extcolor{}, you need to load graphicx in the preamble before using this command, that is, usepackage{graphics}.
The annotation function can also be used in Latex, just add ote command. Of course, the pgfpages package also needs to be called in the preamble.
usepackage{pgfpages}
setbeameroption{hide notes} % Only slide
%setbeameroption{show only notes} % Only notes
%setbeameroption{show notes on second screen=right} % Both

7. Appendix
You can use commands< code >appendix to start the appendix, after using this command the slides can start counting again. Its use is very simple, that is, first load the appendixnumberbeamer package in the introduction part, and then add the end{frame} and the appendix numberbeamer at the end of the previous slide where you want to start the appendix Just add appendix between egin{frame} at the beginning of a slide. For details about appendixnumberbeamer, you can refer to "appendixnumberbeamer".
The last little suggestion, you may need to make a hyperlink between the two slides in the process of making an academic report, so that you can directly access the Jump to the desired page and back again. In order to realize this function, you need to add the [label = name] option after egin{frame}, that is, egin{frame}[label = name ], and then use the following command where the link needs to be inserted:
hyperlink{name}{object}
The object can be some text, or you can use eamergotobutton{} to draw a small pattern similar to a button, and you can jump after clicking.
8. Related tweets
Note: The Stata command to generate the following list of tweets is:
lianxh latex slides, m
Install the latest version oflianxhcommand:
ssc install lianxh, replace
Special topic: special course Academic slideshow production: Beamer in Rmarkdown Special topic: Result output Stata: output beautiful LaTeX Table-T222 Stata result output: Excel result table turned into LaTeX table -
The perfect combination of Stata and LaTeX Stata result output: use esttab to generate a LaTeX regression table with group names Special topic: Endogenous-causal inference Endogeneity: Sources and Treatments - Slide Download Special Topic: Markdown-LaTeX Convert Markdown and LaTeX links with VScode regular expressions DAG-Directed Acyclic Graph: How to draw quickly with LaTeX? -B017- Getting started with LaTeX Xiaobai: TeXLive installation and use Using Markdown to make slideshows - five minutes to learn Marp (Part 1)-M110a Using Markdown to make slideshows - five minutes to learn Marp (Part 2)-M110b Stata+LaTex: Drawing Flowchart -
Introduction to LaTeX Mathematical Formulas for Markdown Tutorial Common LaTeX Mathematical Formulas for Markdown Introduction to writing LaTeX mathematical formulas in Markdown Special topic: Tool software LaTeX-How to use Overleaf to generate PPT LaTeX-How to use Overleaf to write a paper Connection meeting tool: Beamer slideshow production Word, MathType and LaTeX formula


Connection · Text Analysis | Crawler | Machine Learning


New! Stata search artifacts:
lianxhandsongblGIF animation introduction
Search: Tweets , data sharing, journal articles, reproducing code...
? Installation:
. ssc install lianxh
. ssc install songbl< /code>
? Use:
  .lianxh DID double division method
  .songbl all

? About us
Connection ( www.lianxh.cn, tweet List) was founded by the team of Sun Yat-sen University teacher Lian Yujun, who regularly share empirical analysis experience. Through train: ?【**Baidu:**Connection 】You can go directly to the homepage of the joint sharing club. You can also add keywords such as "Zhihu", "Station B", "Panel Data", "Open Course" to refine your search.
Articles are uploaded by users and are for non-commercial browsing only. Posted by: Lomu, please indicate the source: https://www.daogebangong.com/en/articles/detail/LaTeX%20Tips%20Simple%20and%20Practical%20Beamer%20Templates.html

 支付宝扫一扫
评论列表(196条)
测试