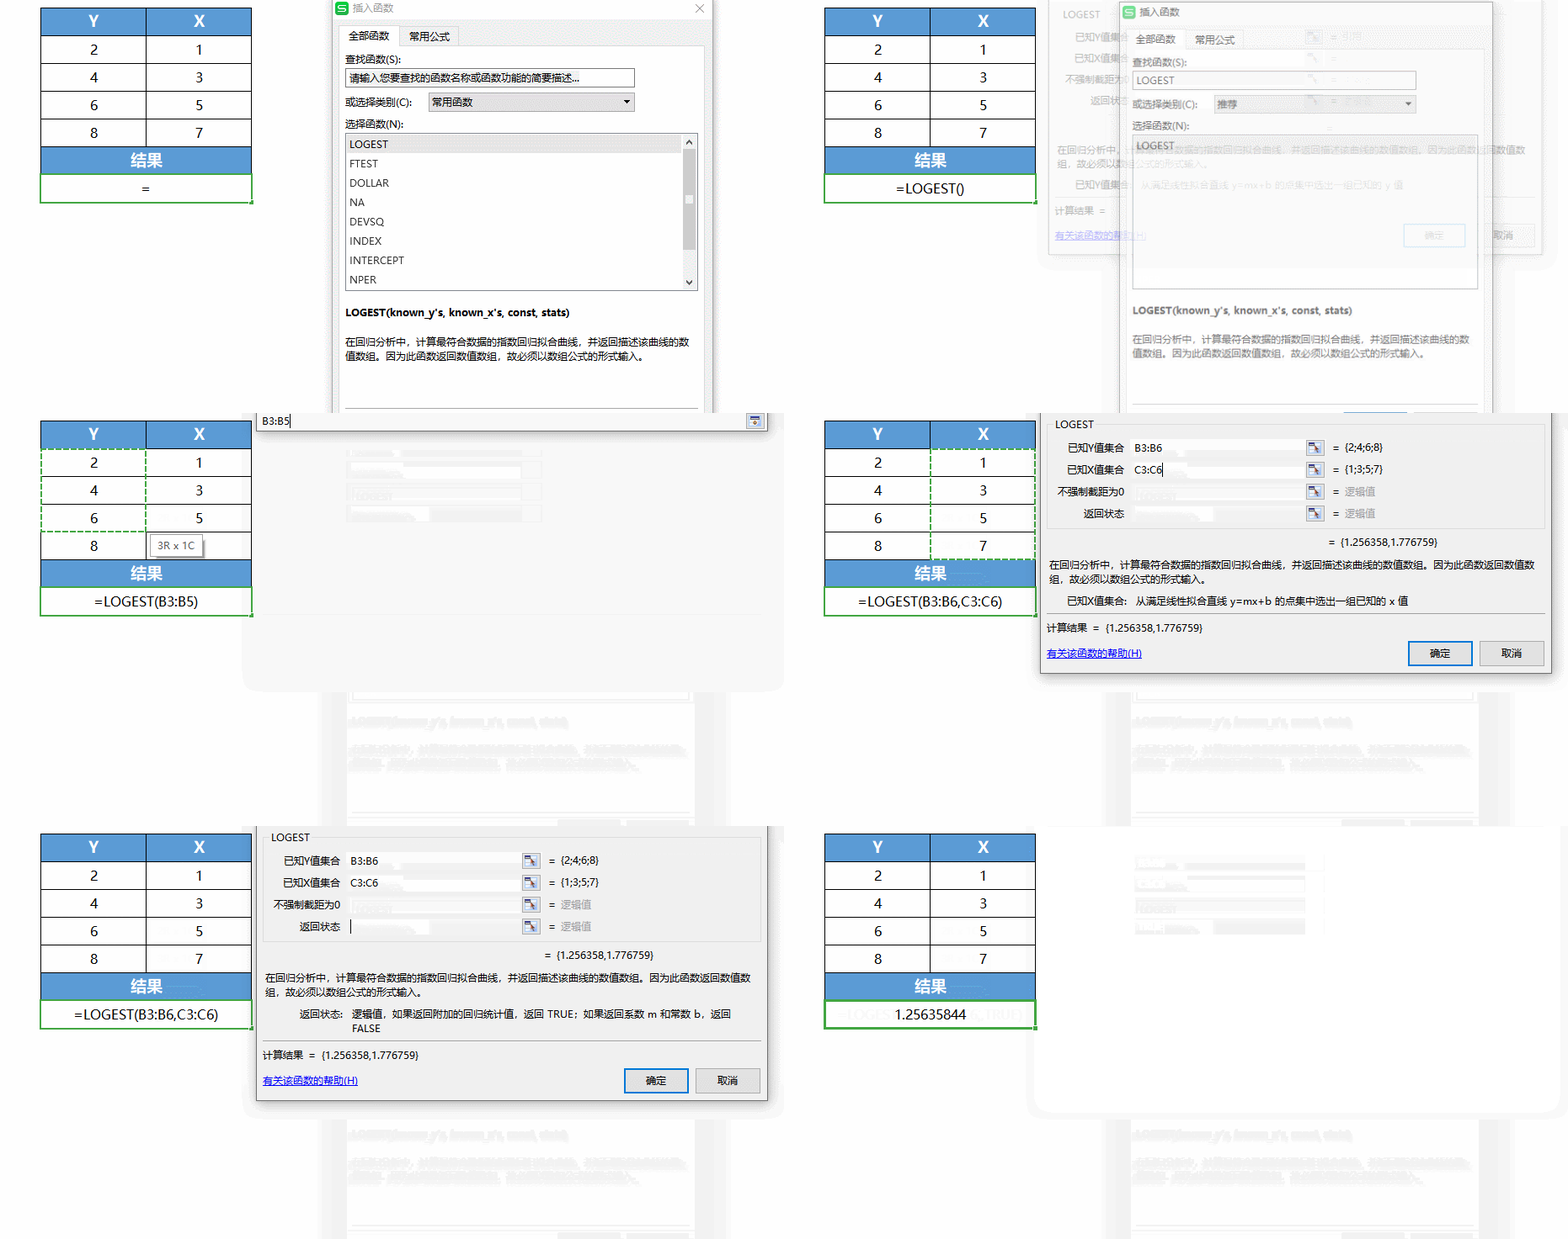
- Picture and text skills
- Case
A function that computes an exponential regression fit curve that best fits the data and returns a numeric array describing the curve.
Grammar
LOGEST(known_y's, [known_x's], [const], [stats])
LOGEST function syntax has the following parameters:
■known_y's Required. The set of known y values in the relational expression y = b*m^x.
If the array known_y's is in a single column, then each column of known_x's is treated as an independent variable.
If the array known_y's is in a single row, then each row of known_x's is treated as a separate variable.
■known_x's Optional. The set of known x values in the relational expression y=b*m^x, as an optional parameter.
The array known_x's can contain one or more sets of variables. If only one variable is used, then as long as known_x's and known_y's have the same
If they have the same dimensions, they can be regions of any shape.
If using multiple variables, known_y's must be a vector (i.e., a range of cells with one column height or one row width).
If known_x's is omitted, the array is assumed to be {1,2,3,...}, which is the same size as known_y's.
■Constant Optional. A logical value that specifies whether to force the constant b to 1.
If const is TRUE or omitted, b will be evaluated normally.
If const is FALSE, the constant b is set to 1 and the value of m satisfies the formula y=m^x.
■Deadline Optional. A logical value that specifies whether to return additional regression statistics.
If stats is TRUE, function LOGEST returns additional regression statistics,
So the returned array is {mn,mn-1,...,m1,b;sen,sen-1,...,se1,seb;r 2,sey; F,df; ssreg,ssresid}.
If stats is FALSE or omitted, the function LOGEST returns only the coefficient m and the constant b.
Description
■The closer the graph drawn from the data is to an exponential curve, the closer the calculated curve is to the original given data.
■Just like the LINEST function, the LOGEST function returns a set of numerical arrays that describe the relationships between values,
But the LINEST function fits the data with a straight line, while the LOGEST function fits the data with an exponential curve.
■When there is only one independent variable x, the value of the y-axis intercept (b) can be directly calculated using the following formula:
INDEX(LOGEST(known_y's,known_x's),2)
You can use the y=b*m^x formula to predict the value of y
■When entering an array constant (such as known_x's) as a parameter, use commas to separate values on the same line and semicolons to separate lines.
The delimiter may vary depending on locale.
■One thing that should be noted is that if the y value predicted by the regression formula exceeds the y value range used to calculate the regression formula, the value May not be valid.
Articles are uploaded by users and are for non-commercial browsing only. Posted by: Lomu, please indicate the source: https://www.daogebangong.com/en/articles/detail/LOGEST-han-shu-ji-suan-hui-gui-ni-he-qu-xian-zhi.html


 支付宝扫一扫
评论列表(196条)
测试