- Picture and text skills
- Case
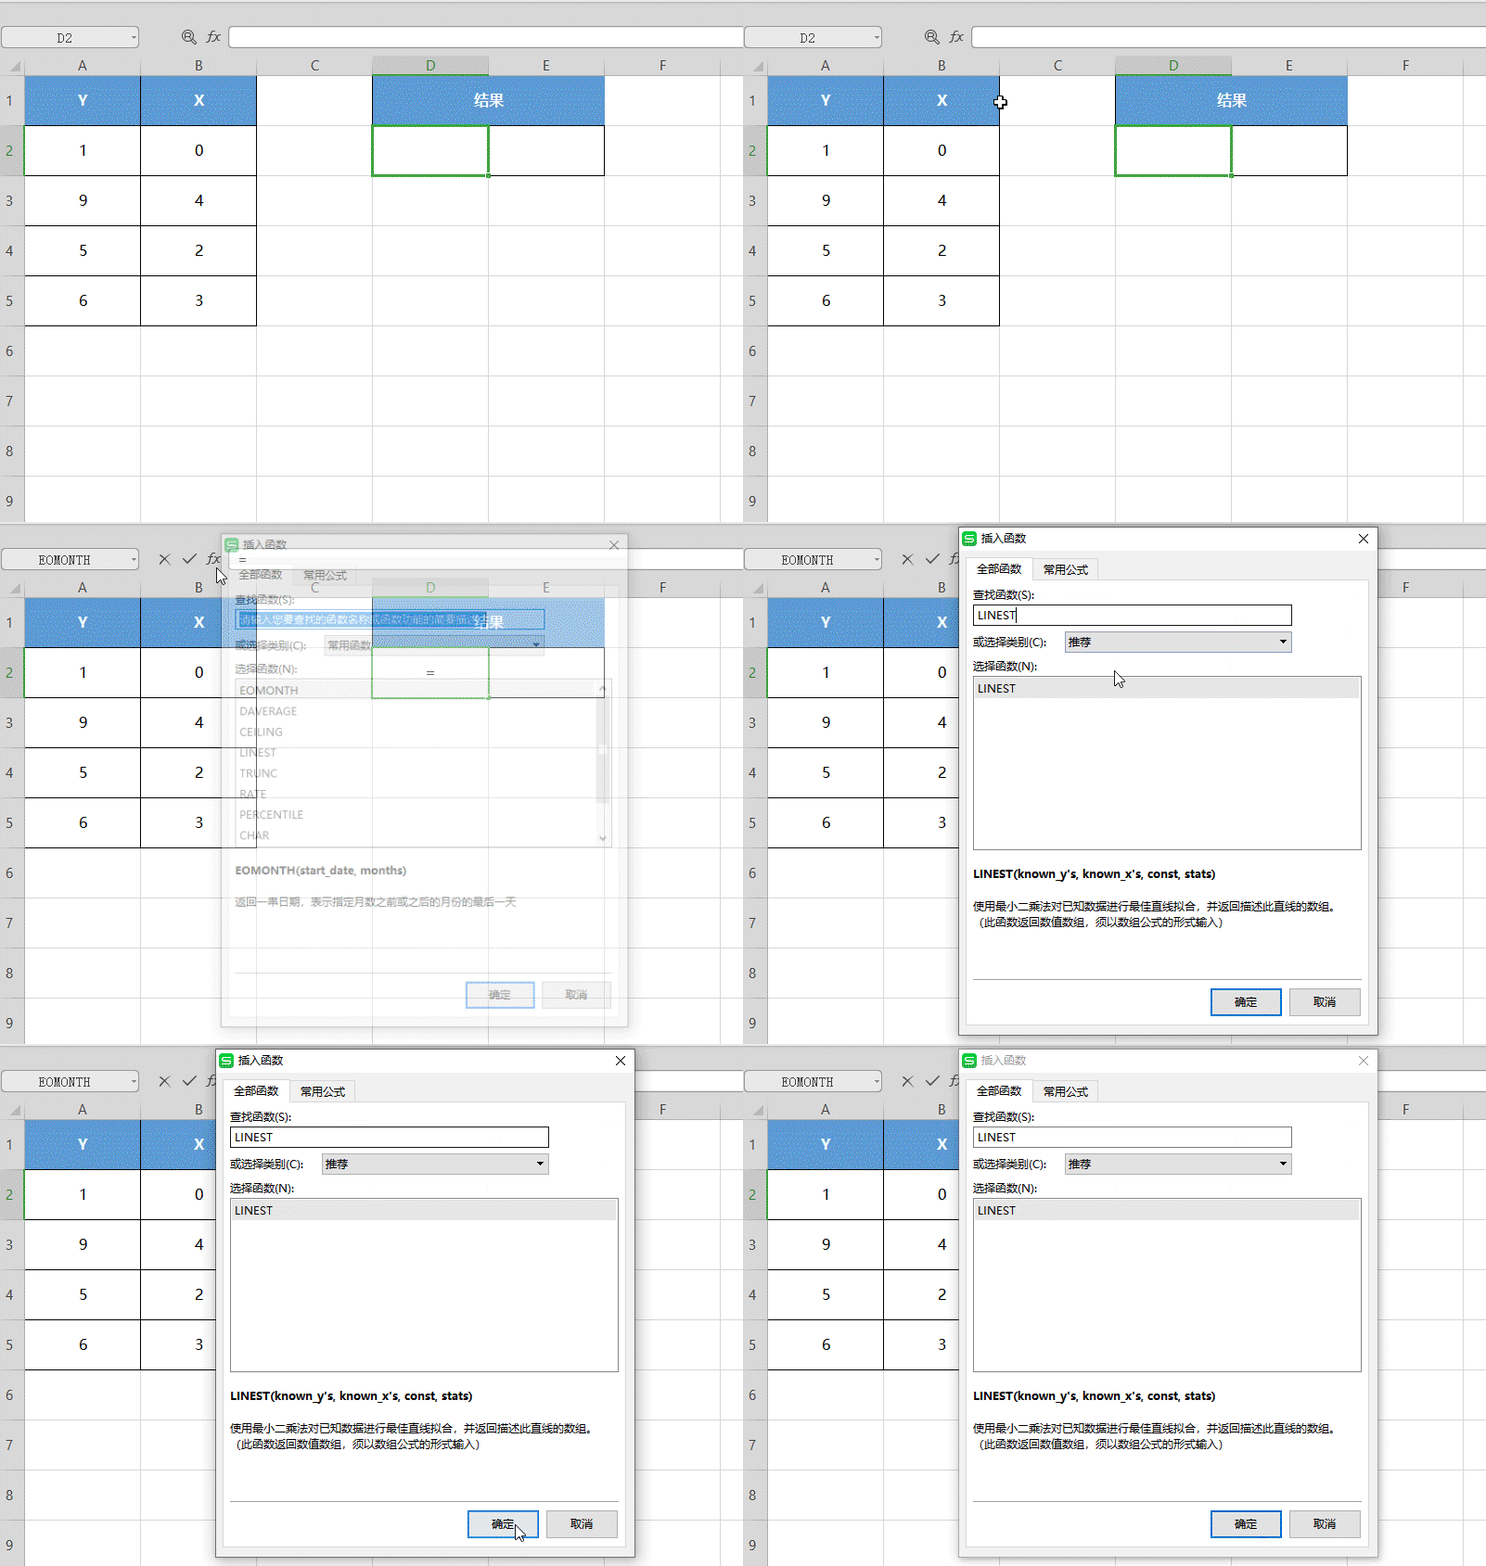
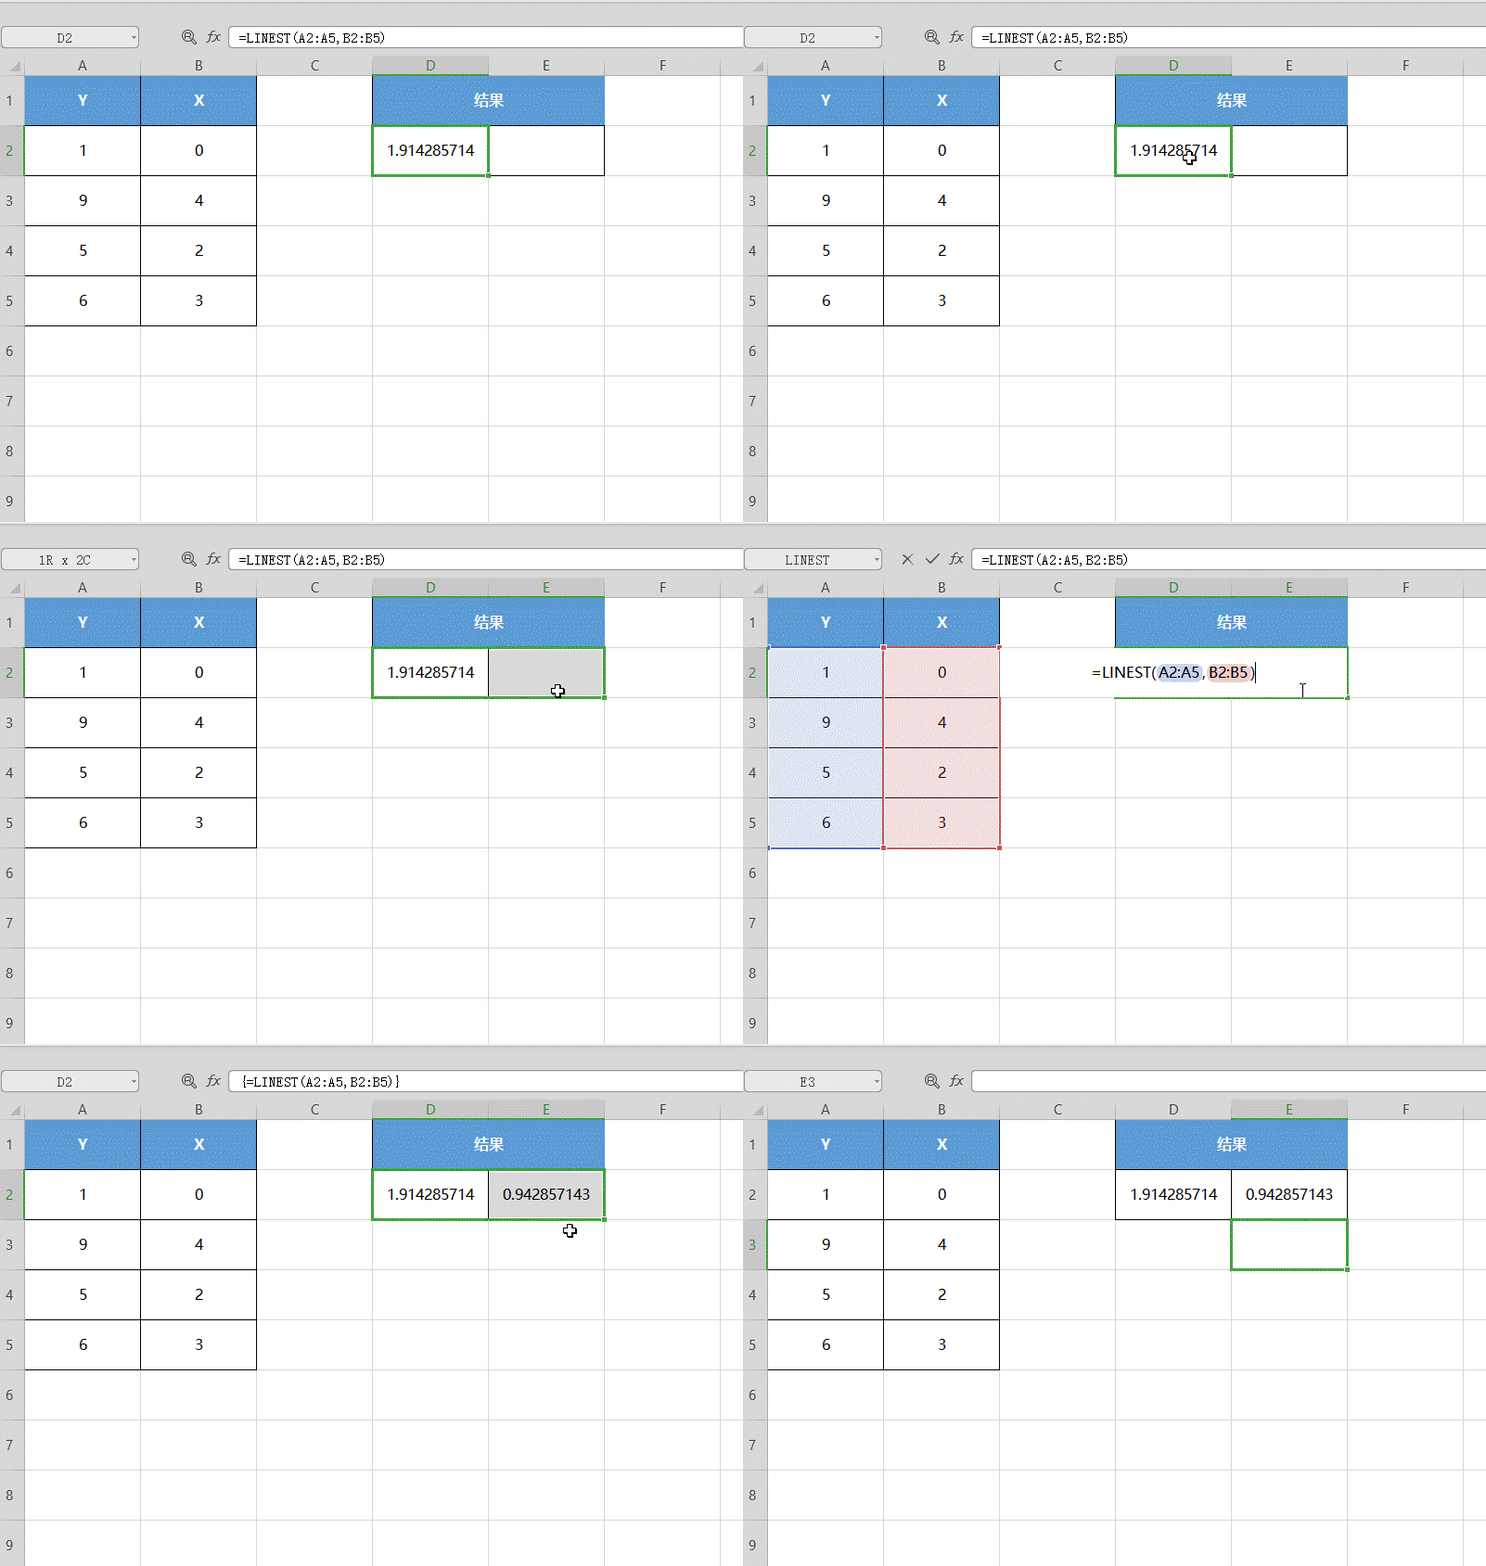
Performs a best straight line fit to the known data using the least squares method and returns an array describing this straight line. Because this function returns a numeric array, it must begin with
Input in the form of array formula.
The formula of a straight line is:
y = mx + b or
y = m1x1 + m2x2 + ... + b (if there are multiple area x values)
In the formula, the dependent variable y is the function value of the independent variable x. The M value is the coefficient corresponding to each x value, and b is a constant. Note that y, x, and m can be vectors.
The array returned by the LINEST function is {mn,mn-1,...,m1,b}. The LINEST function can also return additional regression statistics.
Syntax
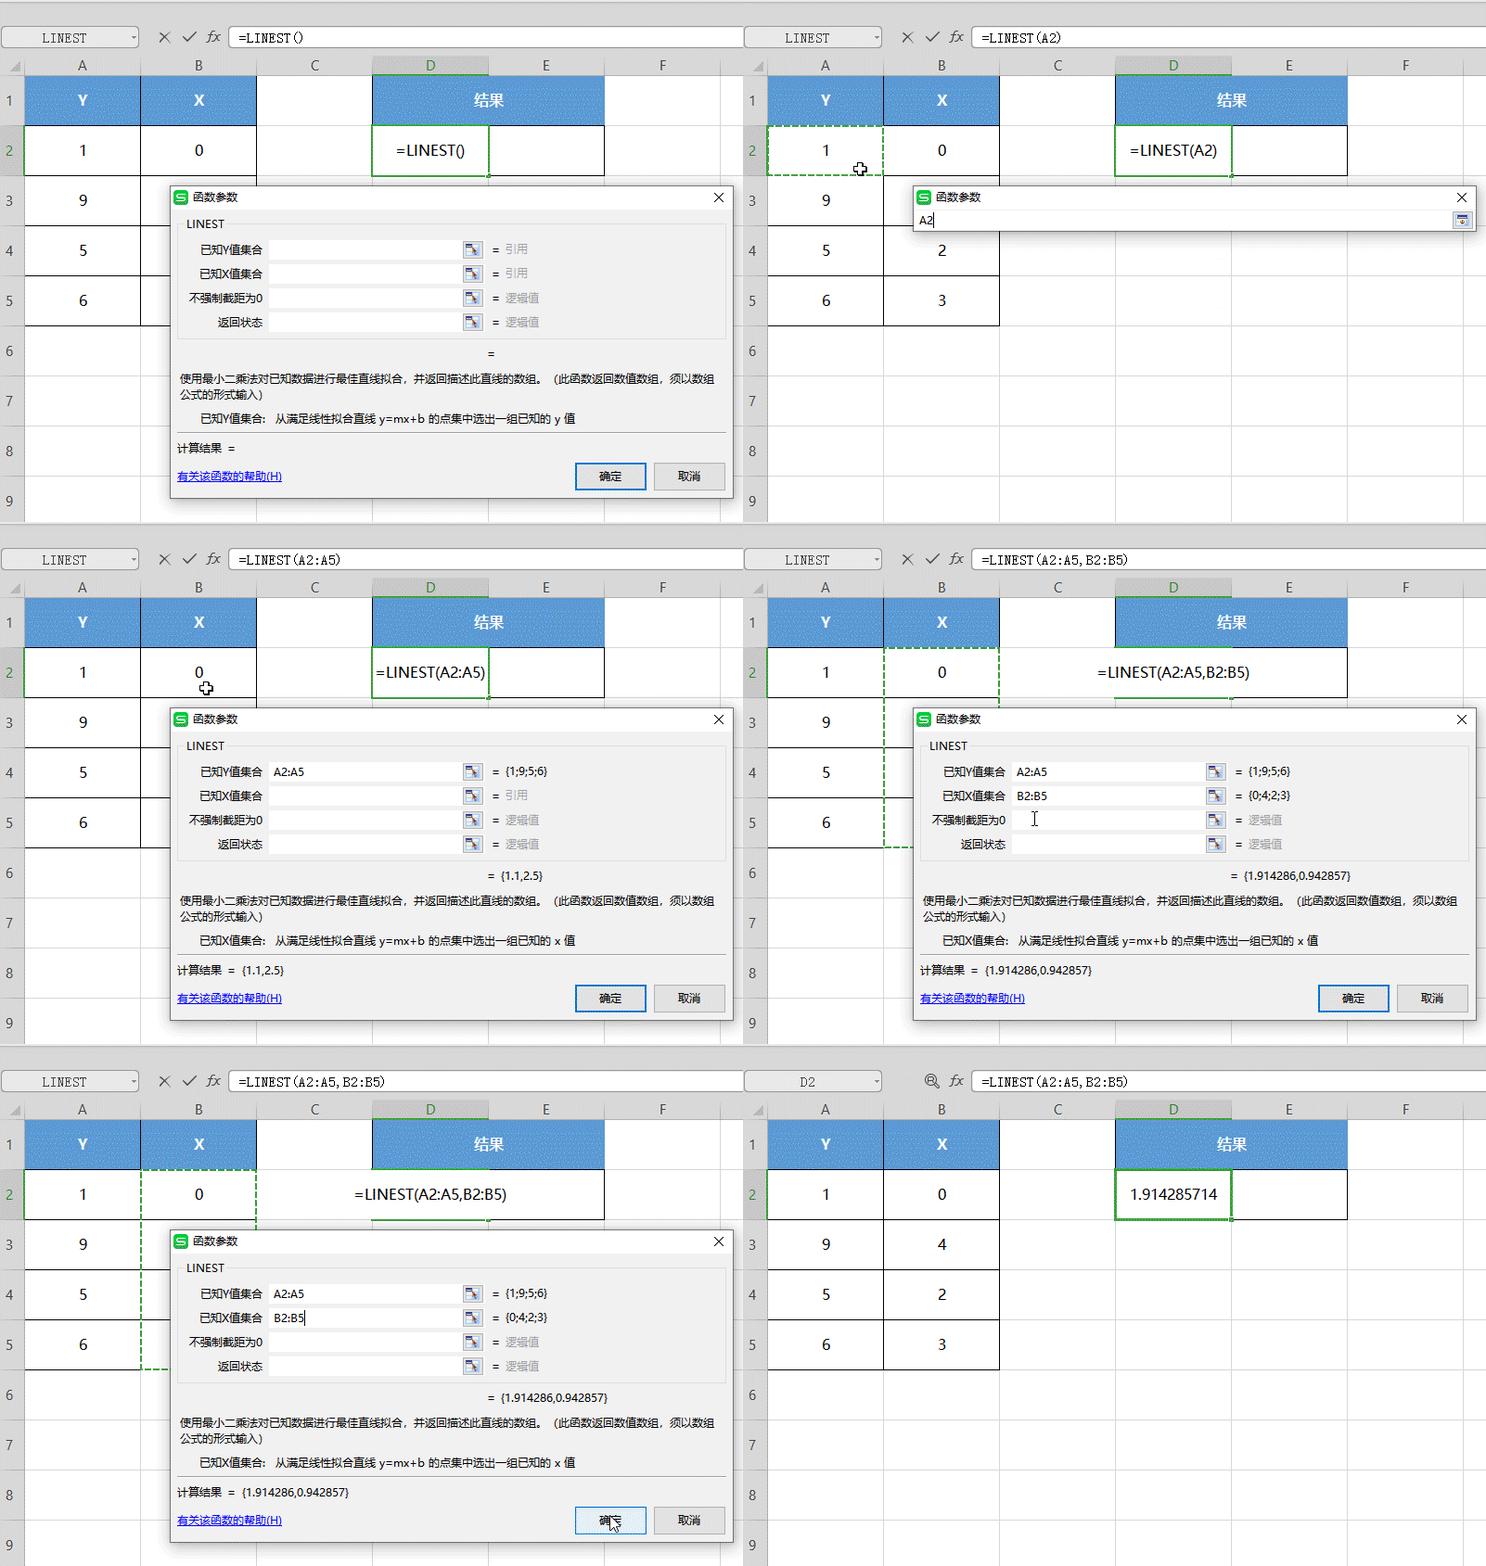
LINEST(known_y's,known_x's,const,stats)
Known_y's is the set of known y values in the relational expression y = mx + b.
• If If the array known_y's is in a single column, each column of known_x's is treated as an independent variable.
• If the array known-y's is in a single row, each row of known-x's is treated as an independent variable.
Known_x's is a known set of optional x values in the relational expression y = mx + b.
• Array known_x's can contain one or more sets of variables. If only one variable is used, as long as known_y's and known_x's have the same dimensions, it
They can be areas of any shape. If multiple variables are used, known_y's must be a vector (that is, it must be a row or column).
• If known_x's is omitted, the array is assumed to be {1,2,3,...}, which is the same size as known_y's.
Const is a logical value used to specify Whether to force the constant b to 0.
• If const is TRUE or omitted, b will be evaluated normally.
• If const is FALSE, b will be set to 0, and the m value will be adjusted so that y = mx.
Stats is a logical value that specifies whether to return additional regression statistics.
• If If stats is TRUE, the LINEST function returns additional regression statistics. The returned array is:
{mn,mn-1,...,m1,b;sen,sen-1,...,se1,seb;r2,sey;F,df; ssreg,ssresid}.
• If stats is FALSE or omitted, the LINEST function returns only the coefficient m and the constant b.
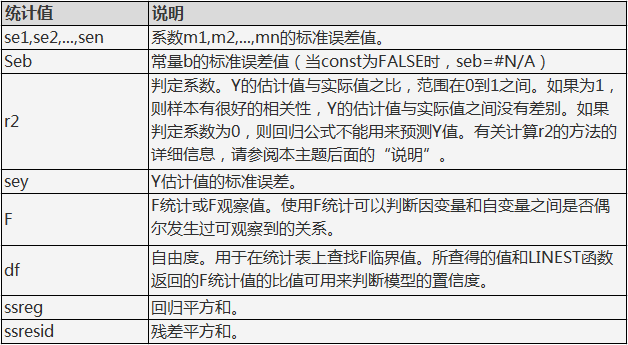
Additional regression statistics are as follows:

The illustration below shows the order in which additional regression statistics are returned .

Description
• Any straight line can be described using slope and y-intercept:
Slope (m):
Usually recorded as m, if you need to calculate the slope, select two points on the straight line, (x1, y1) and (x2, y2); the slope is equal to (y2 - y1) /(x2 - x1).
Y-axis intercept (b): < br style="margin: 0px; padding: 0px; font-size: 14px; white-space: normal; background-color: rgb(250, 253, 255);"/>Usually recorded as b, the y-axis of the straight line The intercept is the value of the intersection point of the straight line passing through the y-axis.
The formula of a straight line is y = mx + b . If the values of m and b are known, any point on the line can be calculated by plugging the value of y or x into the formula.
• When there is only one independent variable x, the slope and y-axis intercept value can be obtained directly by using the following formula:
Slope:
=INDEX(LINEST(known_y's,known_x's),1)
Y-axis intercept:
=INDEX(LINEST(known_y's,known_x's),2)
• Data The degree of discretization determines the accuracy of the LINEST function calculation. The closer the data is to linearity, the more accurate the LINEST model is. The LINEST function uses the most
The small squares method is used to determine the model that best fits the data. When there is only one independent variable x, m and b are based on Calculated by the following formula:


Among them, x and y are the sample average; that is, x = AVERAGE(known x's)and y = AVERAGE(known_y's).
• Line and LINEST can be used to calculate the straight line that best fits the given data.
These functions without argument new_x's return an array of y values based on a straight line at the actual data points, and the predicted values can then be compared to the actual values.
You can also use charts to visually compare the two.
• During regression analysis, WPSThe table calculates the squared difference between the estimated value of y and the actual value of y at each point. The sum of these squared differences is called the residual sum of squares.
Then WPSThe table calculates the sum of squared differences between the actual value of y and the mean value. is called the total sum of squares (regression sum of squares + residual sum of squares).
The smaller the ratio of the residual sum of squares to the total sum of squares, the greater the value of the coefficient of determination r2.
r2 is a symbol indicating the extent to which the results of the regression analysis formula reflect the relationship between variables.
• Formulas that return an array must be entered as an array formula.
• When When you need to enter an array constant (such as known_x's) as a parameter.
Use comma as the separator for data in the same row, and use semicolon as the separator for data in different rows.
The separator may vary depending on the regional settings in Regional Settings or in Regional Options in Control Panel.
•Note that regression analysis predictions for y may be invalid if they are outside the range of y values used to calculate the formula.
Articles are uploaded by users and are for non-commercial browsing only. Posted by: Lomu, please indicate the source: https://www.daogebangong.com/en/articles/detail/LINEST-han-shu-qiu-xie-lyu-he-jie-ju.html


 支付宝扫一扫
评论列表(196条)
测试