Staying at home these days, the first thing I do when I get up every day is to open Weibo and look at the epidemic map. I believe that many friends are like the editor. They are concerned about this epidemic and watching the map turn red little by little. I'm sorry, I hope this epidemic can be overcome as soon as possible! I hope you all can reunite with your family! Hope everything will go in a better direction!
Although the number of going out due to the epidemic has reduced, we can’t stop studying. Now that we’re talking about maps, today I’m going to tell you how to make such a map in PPT:
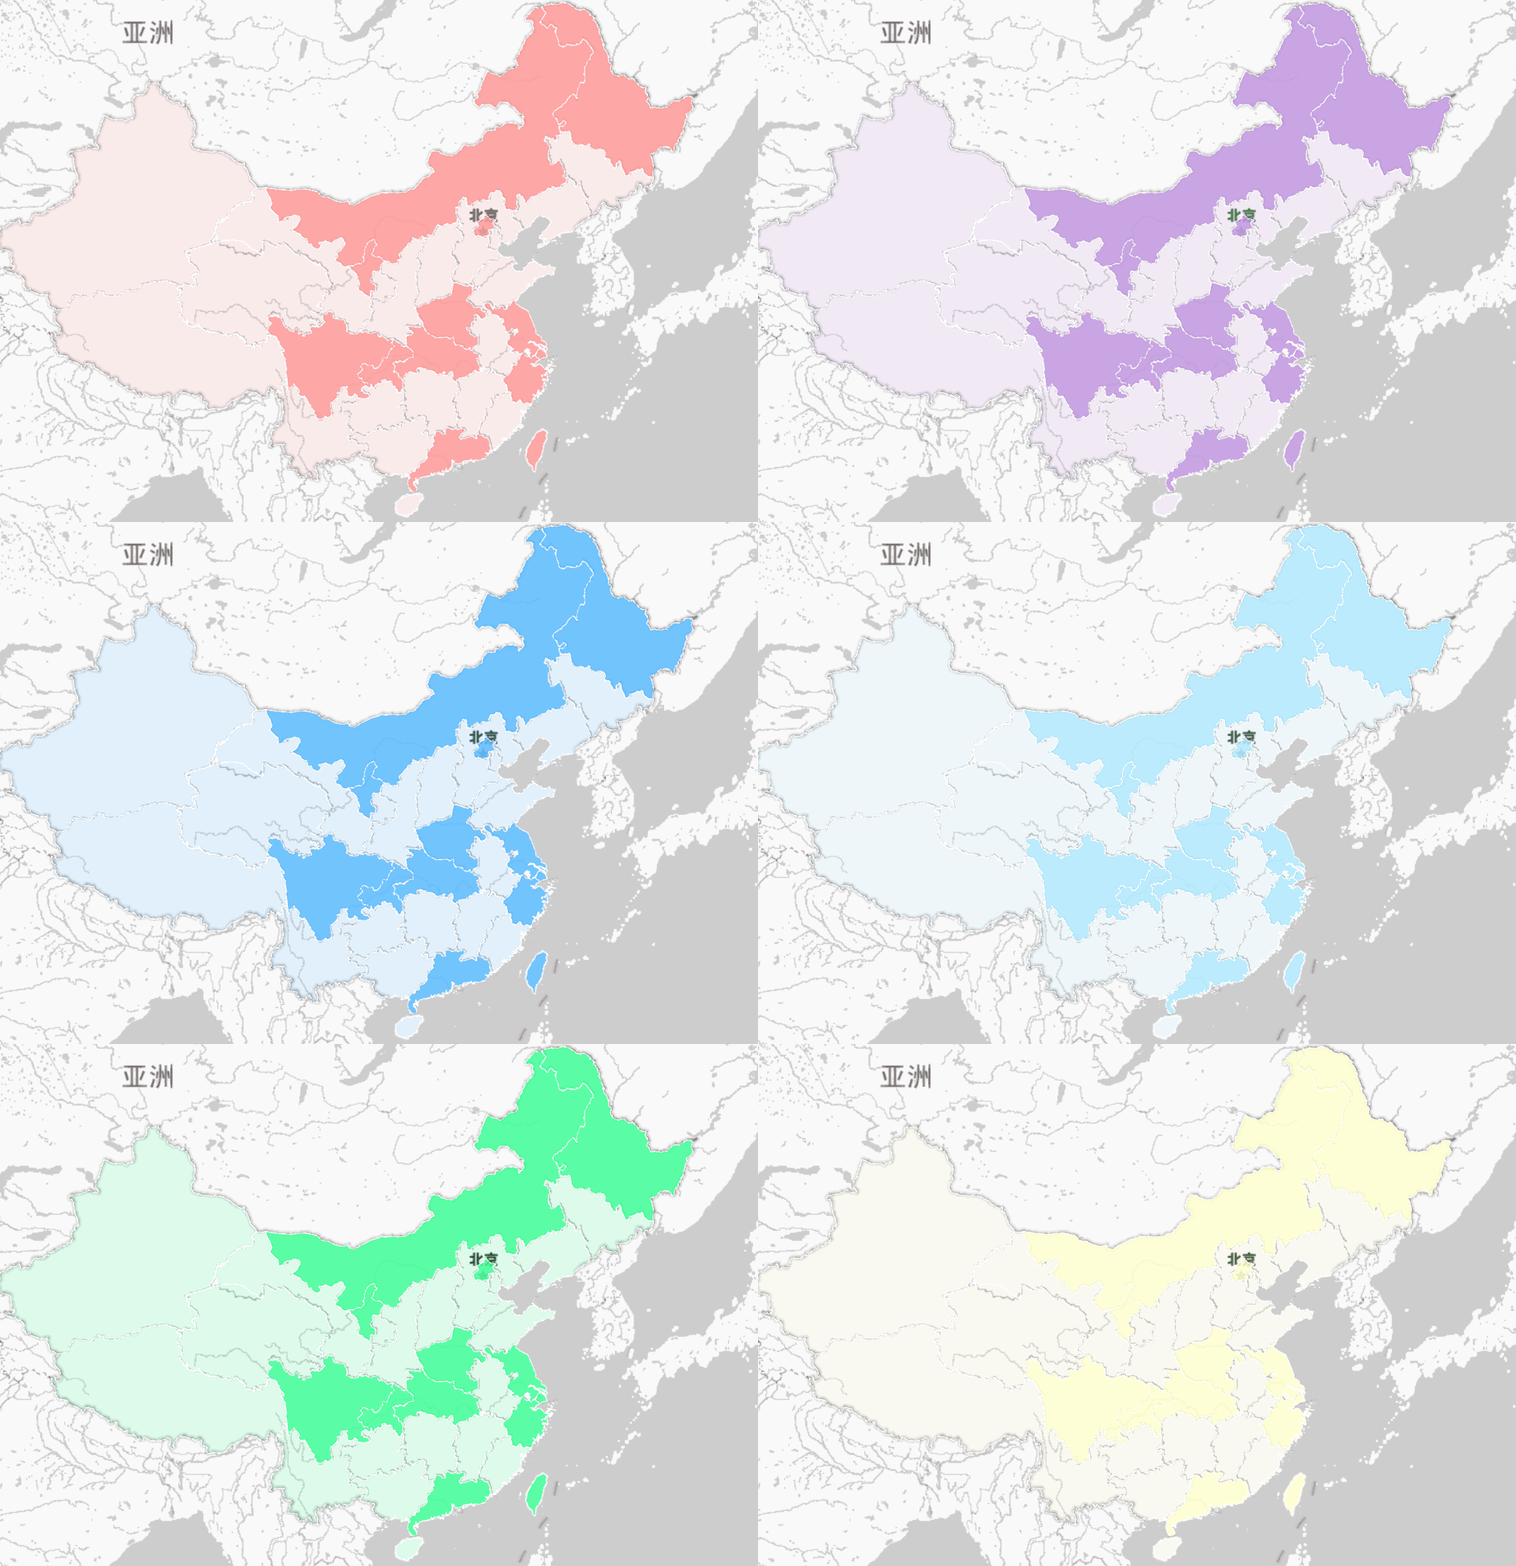
1. Map making
1. Data preparation
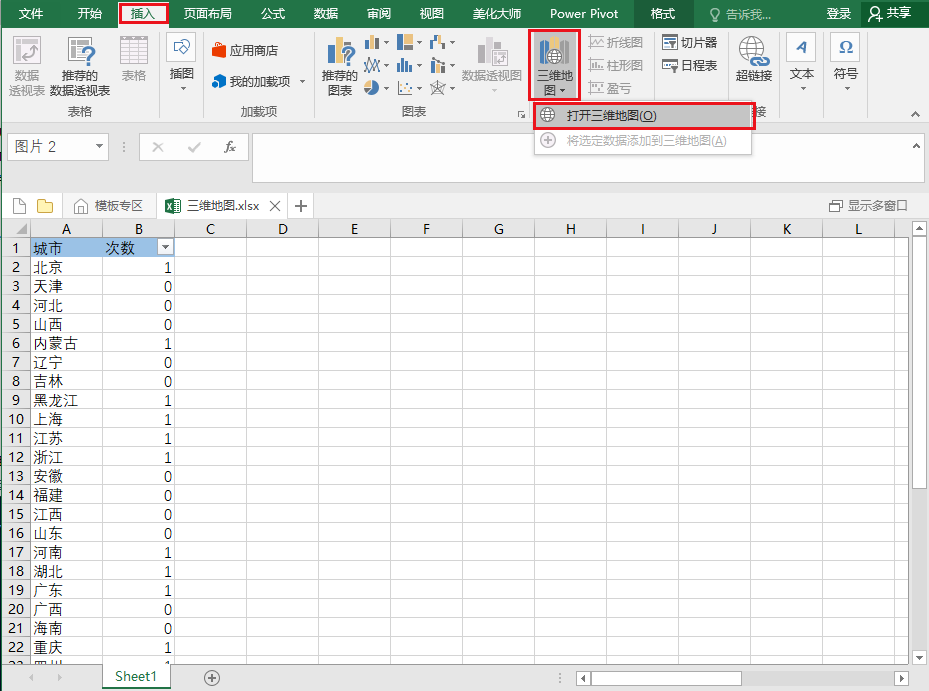
First of all, we need to prepare such a table. The first column contains all provinces in the country, and the second column enters the corresponding data:

2. Insert map
Then click【Insert】-【3D Map】-【Open 3D Map】in the toolbar:
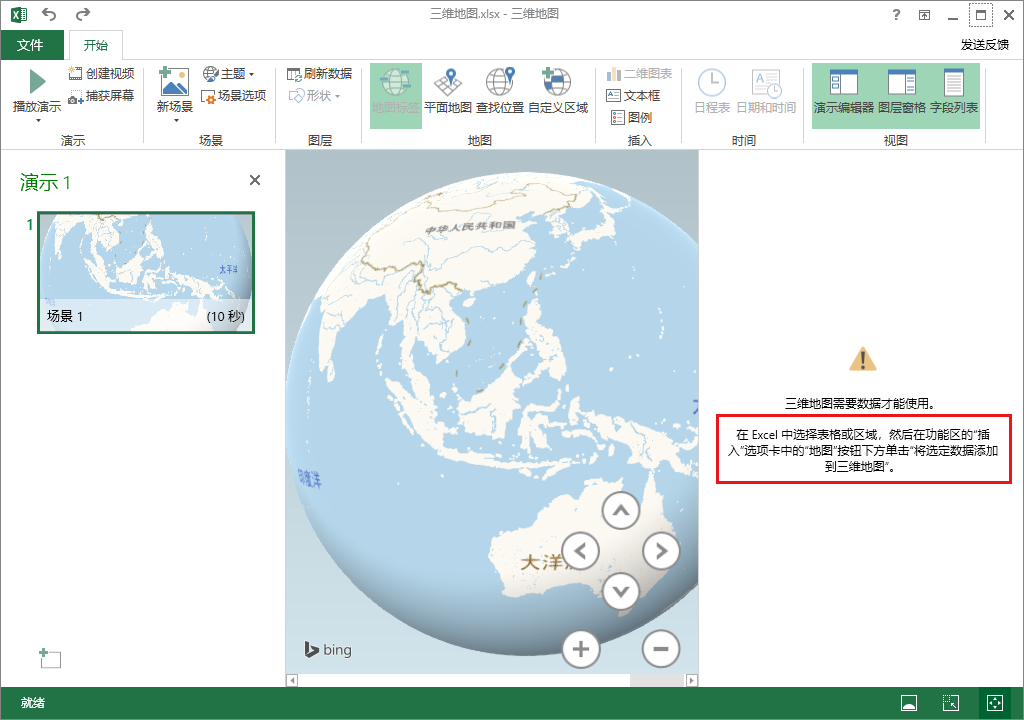
3. Select data
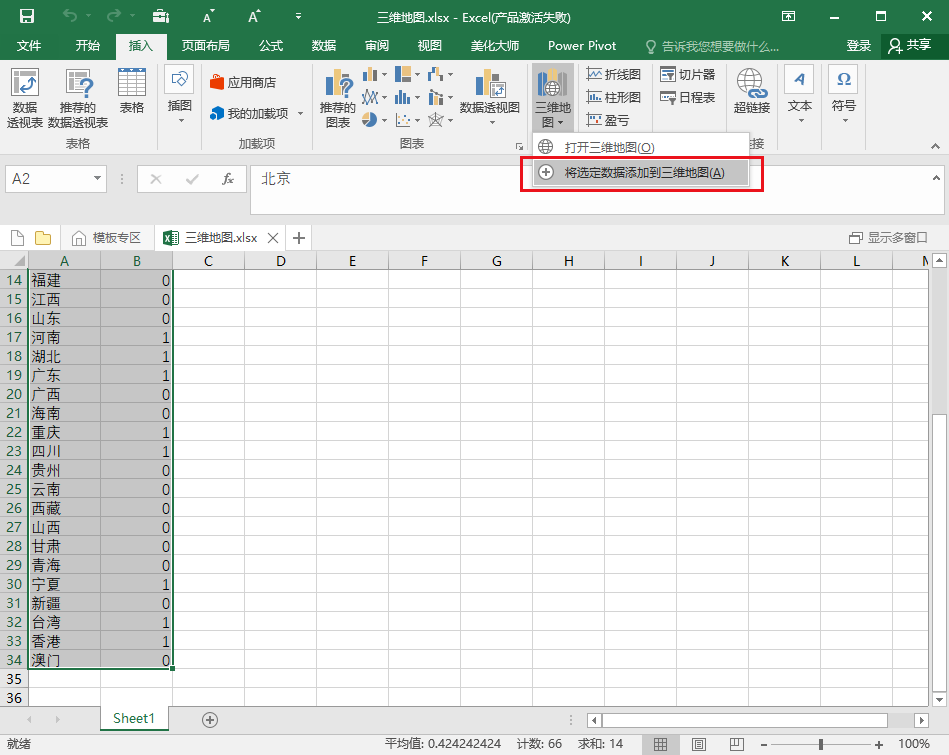
Then go back to the table, select the data in the table, and then click [3D Map]——[Add Selected Data to 3D Map]~
4. Adjust parameters
Then we select the chart type as [Plane Map], and select the data type as [Change visualization to area]:
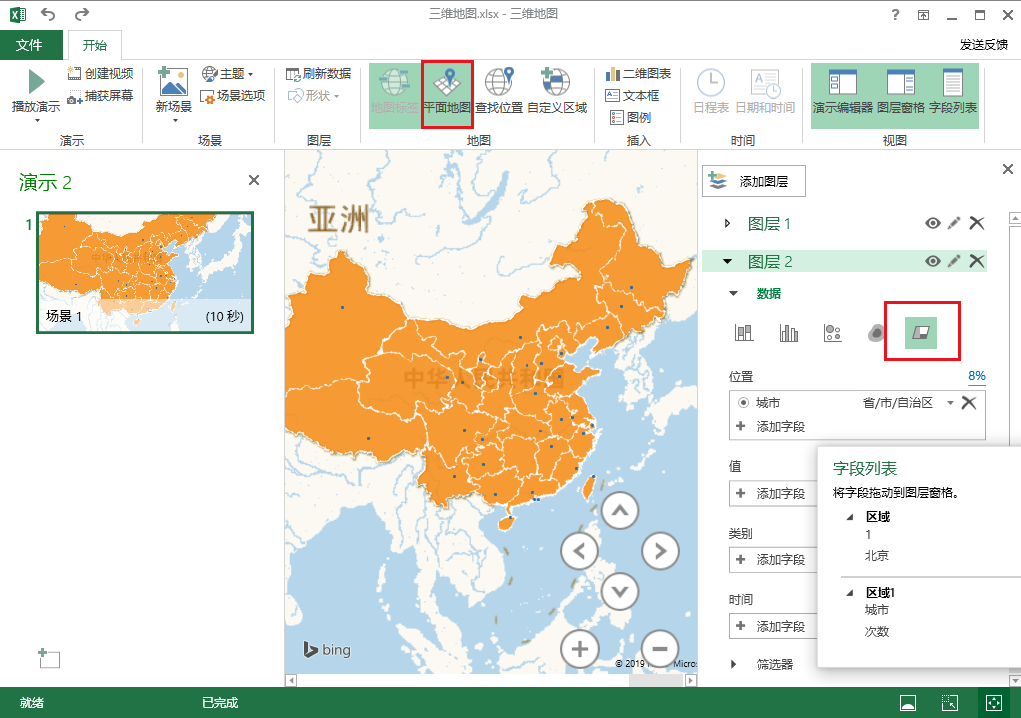
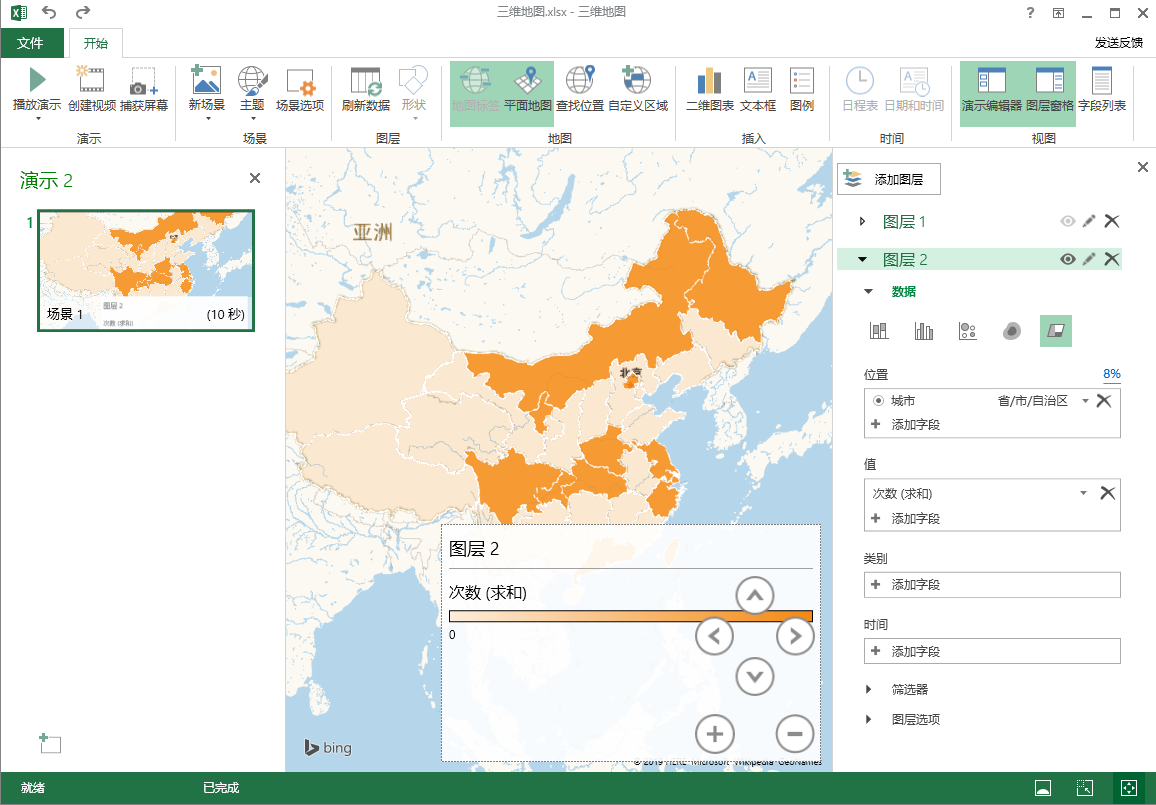
Then select [Number] - [Sum] in the [Value] column, so that we can get such a map, and the color can be modified according to your preferences! Such a map is particularly intuitive when used to display national data!
2. Map PPT template
1. Template website
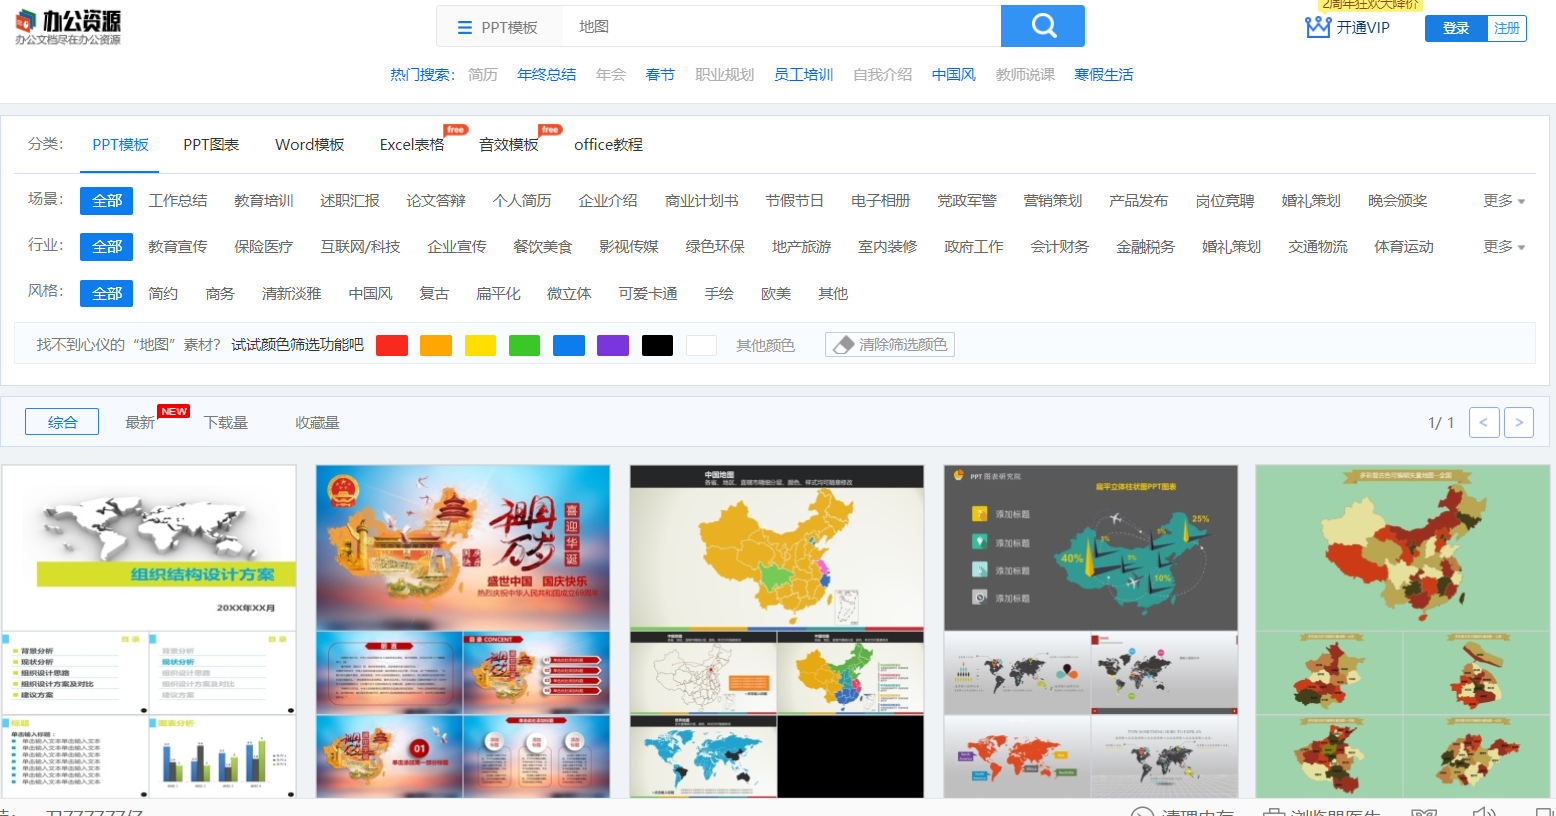
If the time is urgent and it is too late to make it yourself, we can directly apply the template. Here, I will share with you a very good PPT template website—【Office Resource Network】. There are many useful templates on this website. template!

2. Search template
We can search by entering keywords in the search box.
3. Download the template
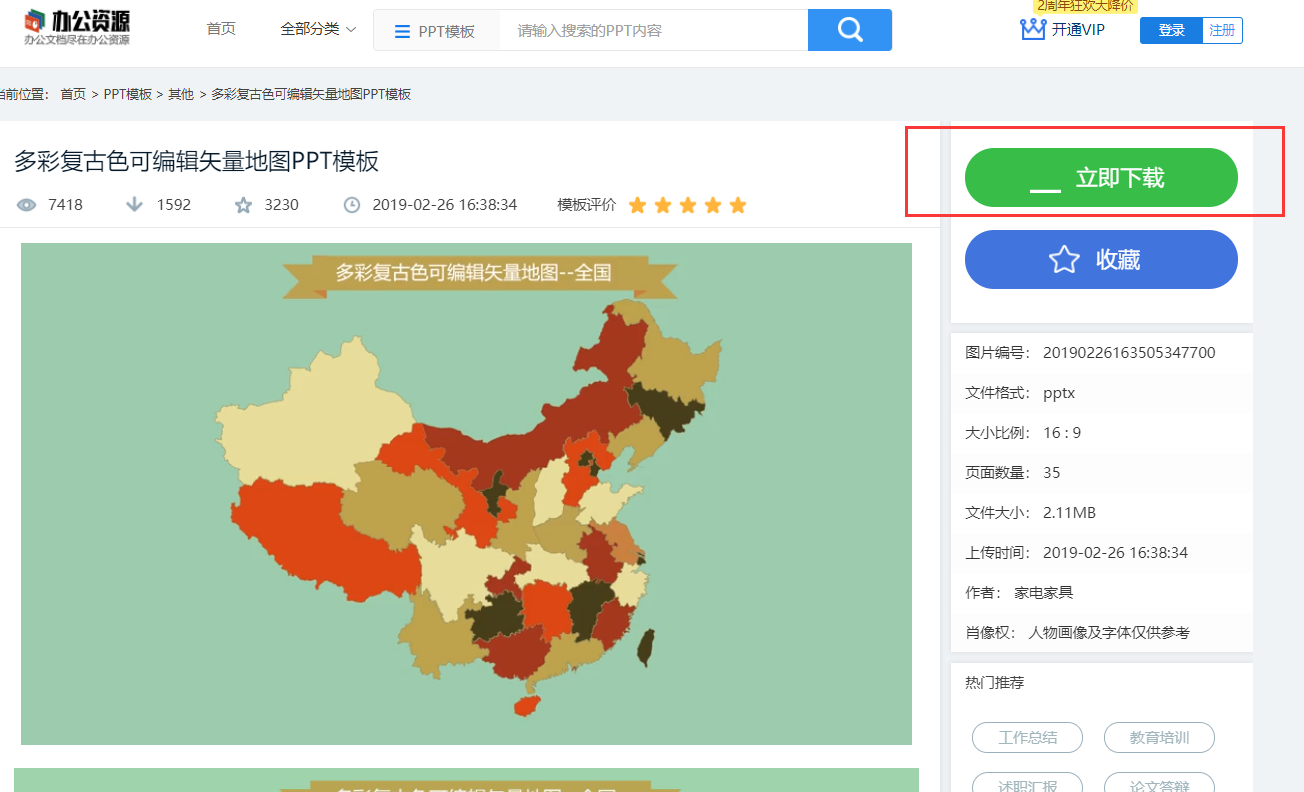
After previewing the template, we click on the [] on the right to download the template~
Well, this is what the editor wants to share in this issue! Finally, remind everyone to wash your hands frequently! Don't go out! wear mask!

 支付宝扫一扫
评论列表(196条)
测试