Introduction
Many times, we all have a certain curiosity about data visualization. How can we better express a large amount of data? When we deal with things in our daily life, because of its simplicity, the basic charts we come into contact with may be the simple tables in Excel, but there will be more data in the more complex visual large screen, which means that we will encounter There are more and more different chart forms, and different chart forms will have different meanings, so we must be clear about the specific use, advantages and disadvantages of each chart when using large-screen visual charts, in order to better tell the story The data in it is clear and good~ Next we will publish a few articles on the advantages and disadvantages of commonly used charts for data communication, so that everyone can be more clear when designing large-screen data visualization.
Apply for a free trial of the data visualization EasyV tool: https://easyv.dtstack.com/jiuqi
You can also click "Learn More" at the bottom of the article to quickly jump
Not much to say, open our EasyV tool to compare various chart forms to make a better large-screen design~
This feature article is divided into two parts 1/2. This part mainly focuses on three of the six charts in the following figure:
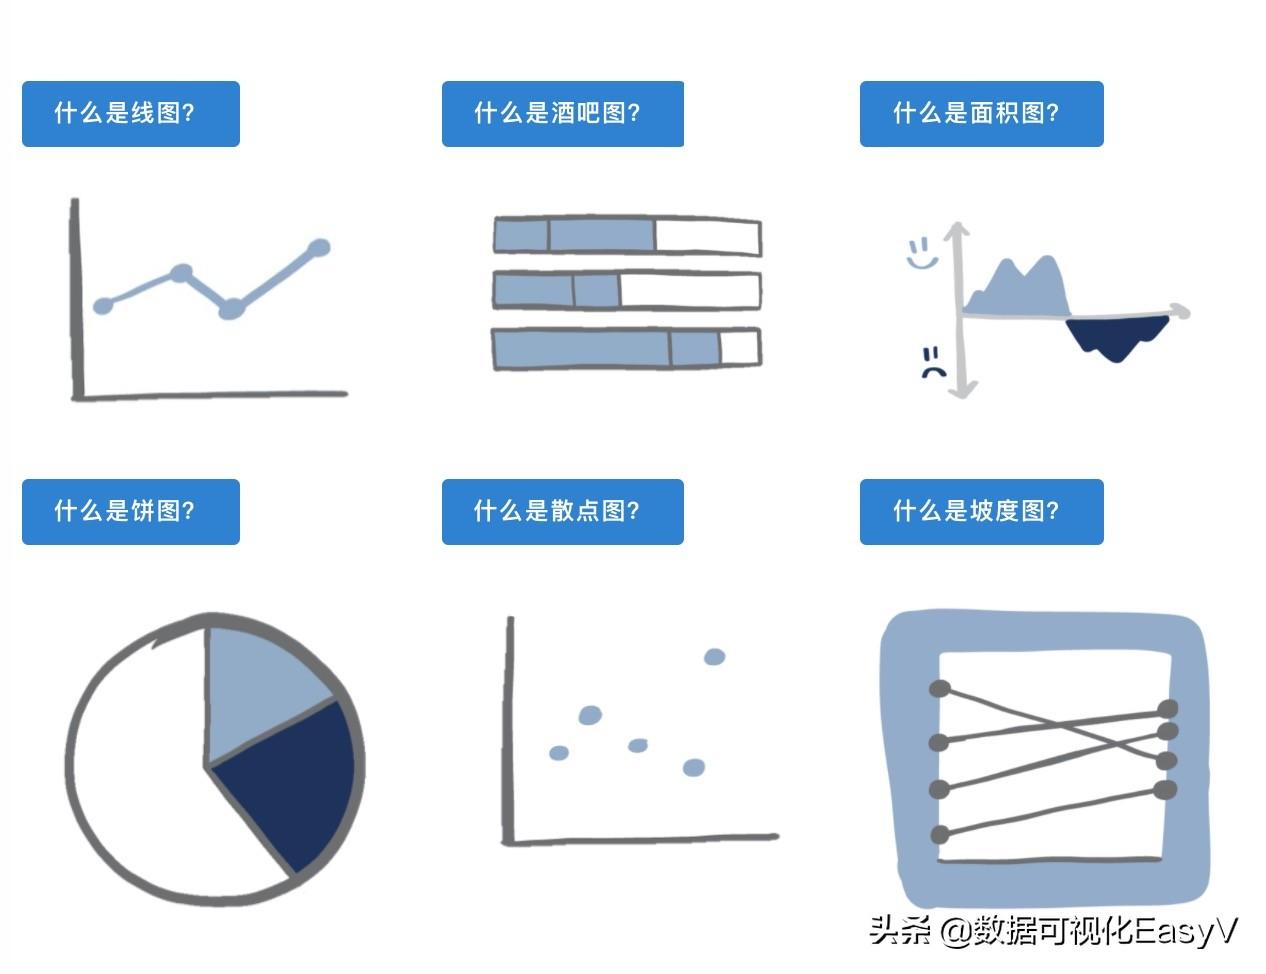
Mainly introduce the above six commonly used data chart forms
What is a line chart?
A line chart (or line chart) is best used to show the value of an item over time or to compare the relative changes of several items over time. Whenever you hear the keywords "over time," that's a clue to consider using a line chart for your data.
Simple, easy to understand and effective, line charts are common and effective charts. Line charts are great for:
- Comparing large amounts of data,all at once
- Showing changes and trends over time
- Includes Important context and notes
- Displays forecast data and uncertainties
- Highlights differences within and between data series Exception
On the other hand, they are not necessarily the best choice for you:
- Display item quantity
- Process category data
- Make parts into a whole A comparison of >
- shows sparse datasets
In this article, we'll discuss how line charts work, and how to build line charts that provide users with meaningful information and context.
Then, we'll answer some common questions about line charts:
- What data can be displayed on the line chart?
- How many lines can be displayed at a time?
- Does my y-axis have to start at zero?
- How much space should I leave at the top and bottom of my chart?
In future articles, we will detail some special variants of line charts, such as slope and area charts.
How does a line chart work?
Think of the lines on a line chart as little history.
- First, we measure the value of the thing we want to track at different points in time. For example, at the end of each month, our store wants to record the revenue we bring in from sales.
- Once you have a lot of these measurements, you can plot the points on a graph and then draw a line connecting the points to more easily see how the values change over time Situations that rise, fall, or stay the same.

But that's not all a line chart can do!
In addition to drawing that line, we can include other important contextual information on the graph. We can choose to mark, label, and/or annotate individual points on our line; we can add reference lines and regions; we can even include forecasted data points, and change the The appearance of the lines and data markers to distinguish actual data from forecasted data.
Here is a similar chart.
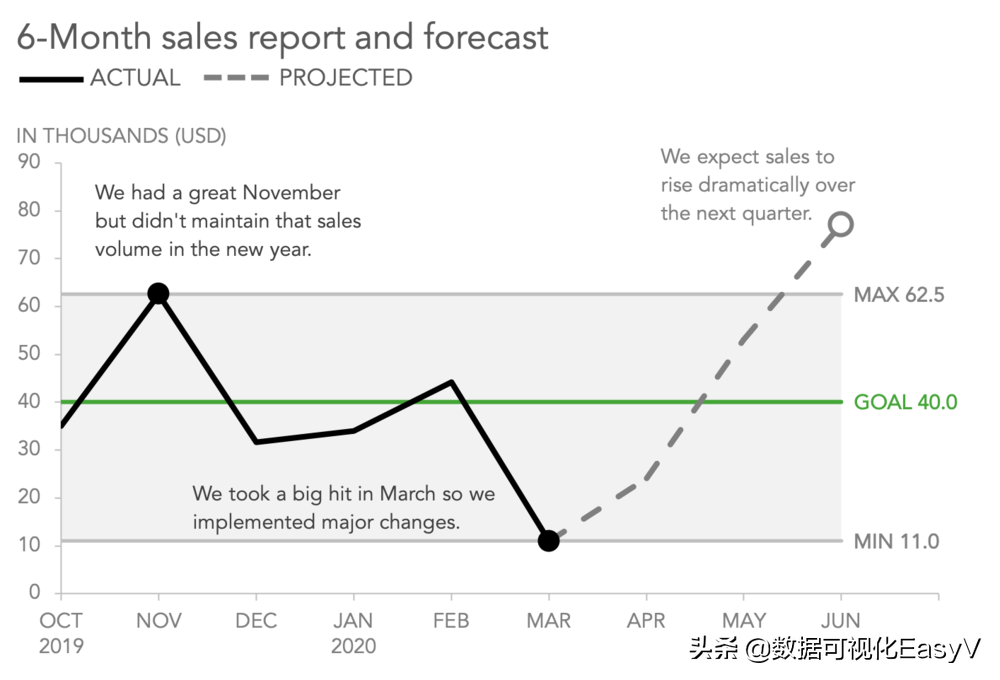
The sales data we collected is still shown on the graph, as shown by the solid black line, but now we've been able to put that data in context.
- The gray reference band shows the range of the Monthly Total Sales, and we have also marked these specific values.
- The green line tells us what our sales goals are, making it easy to see if our sales numbers are worth celebrating in any given month.
- To reduce visual clutter, we removed the data labels and most markers for the points on the row. Only keep markers for the months in which we had our highest and lowest sales, as they are important to the story we plan to tell with this graph.
- The dotted line shows projected sales for the next three months.
- The notes of key moments explain the reasons for the numbers, the actions we are taking in response to those numbers, and our expectations.
Remember: Line charts work by emphasizing the way our measurements change over time or as a specified independent variable. We can use the white space in the line chart to include informative context to help the audience understand the significance of these specific changes.
What kind of data can be used on the line chart?
A typical line graph will have continuous data in both the vertical (y-axis) and horizontal (x-axis) dimensions. The y-axis usually shows the value of the variable we are measuring; the x-axis is most often used to show when we are measuring, whether it is Chronological or based on some independent variable (for example, when we replace an engine in an older car, we all measure decibel levels at different RPMs) .
While some line charts do not use continuous data on the x-axis (notably the diagonal and parallel coordinate charts, which are special variants of line charts), what we absolutely cannot use on the x-axis is one of the categories that are not shown any meaningful relationship between them.
Let's say we have a list for the first six months of 2020:January, February, March, April, May, June. Listing them in any other order would be an error, since they are contiguous and have an inherent order. January 2020 to February 2020, then March 2020, and so on.
Suppose we have a collection of products: apples, pears, limes, lemons, dates, grapes. Unlike our monthly lists, one product doesn't necessarily lead to the next. We can sort them alphabetically, by size, by color, or in random order without feeling unusual, since they have no intrinsic order, nor are they sequential - they are categorical.
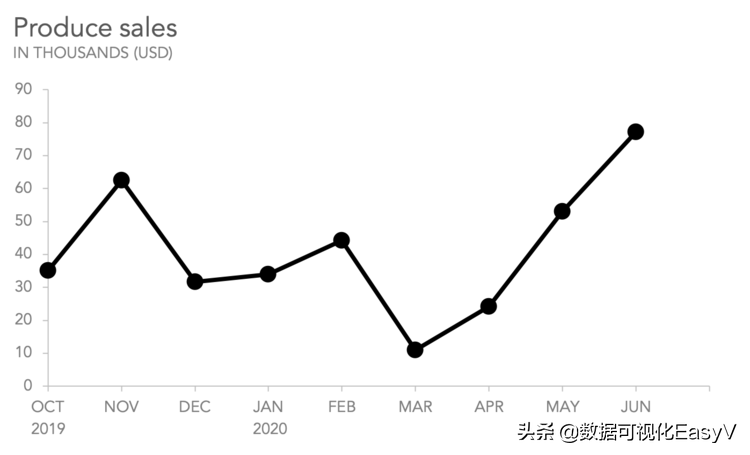
Do: Show sales by month.
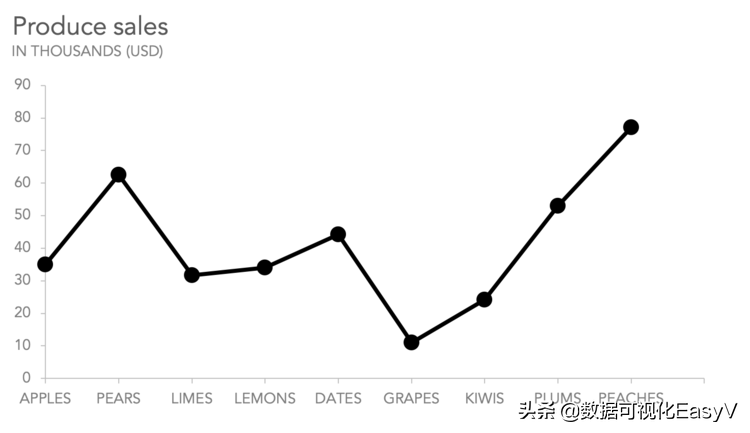
DO NOT: Show sales lines by category.
A line chart is only meaningful when there is a meaningful relationship between successive points on the line. Thus, a grocer can reasonably use a line chart to show their produce sales data by month, but it is not recommended to use a line chart to show the sales variance between various produce. This is best done in a bar chart.
How many different lines can be placed in one graph?
It's difficult for people to keep track of four or five things at once, so consider using this as a guideline. If you absolutely need to show more lines, try using color, line thickness, and labels to focus on the most important lines or points.
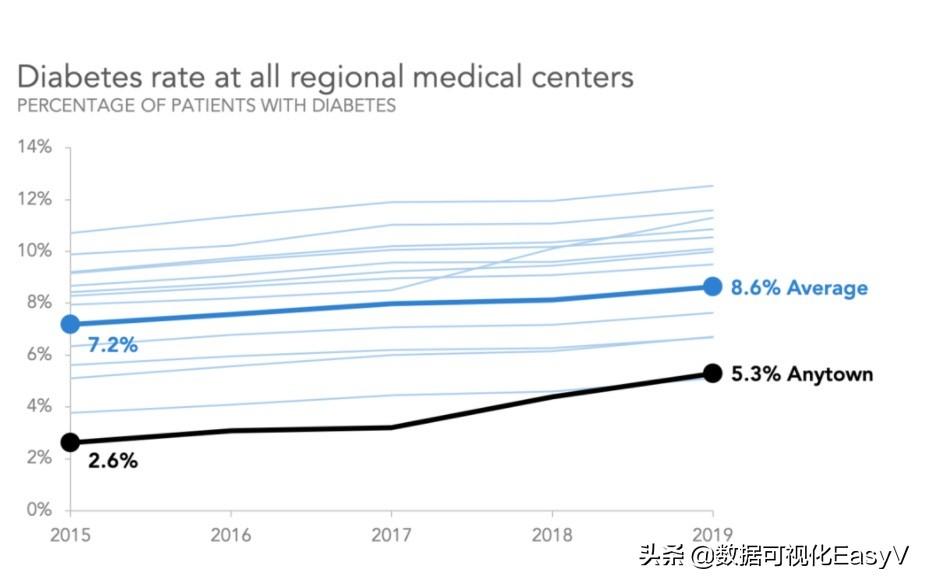
The graph above shows five years of annual diabetes patient data from Anytown Medical, our local medical center, along with diabetes data from 12 other centers in the region. Since we are most concerned with our own center (especially since we have a low ratio), we use colours, weights and labels to focus on Anytown and area averages, while also including all values from other centers.
Does the y-axis of the line chart have to start from zero?
When we look at a line chart, we are comparing the distance between the lines, not their height relative to the x-axis. By their very nature, line charts are better at showing how values change over time than the precise number of each measurement point.
Therefore, the baseline of a line chart does not have to be zero; but in most cases it is recommended. If the y-axis starts at zero, it won't confuse the viewer, as that is the normal expectation when seeing the chart for the first time. There should be compelling reasons to subvert those expectations.
Here are some specific cases for which a zero baseline may not be optimal:
The measurement range is small, but the distance from the minimum of these measurements to zero is large.
If our y-axis went all the way down to zero, these meaningful fluctuations would not be perceivable.
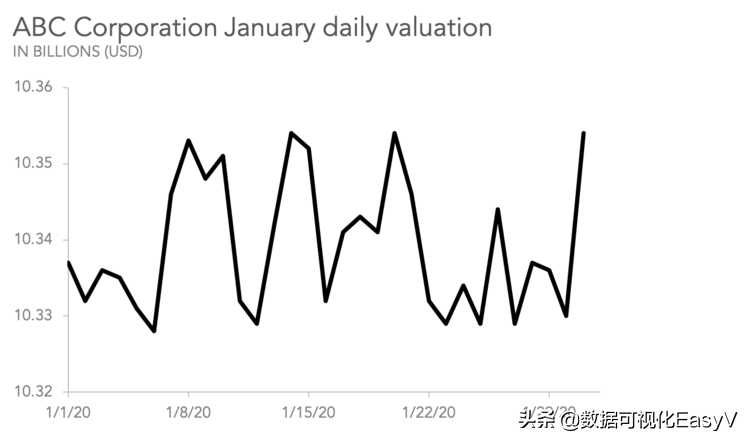
DO: Start the axis with a logical value.
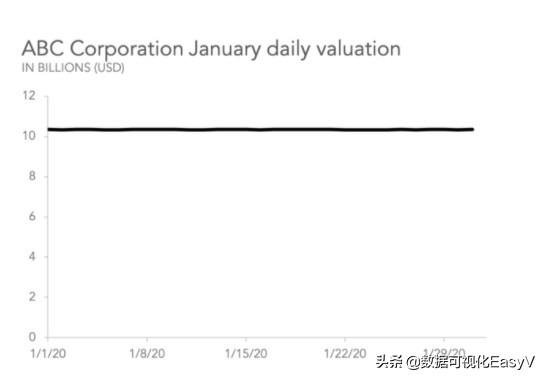
DO NOT: If you include zero, include zero.
The relation to zero is meaningless.
On some scales, such as the Fahrenheit scale, the location of "zero" is somewhat arbitrary (50 degrees is not twice 25 degrees), so if no data point is close to zero, we don't feel compelled to use it as our benchmark. Our charts should contain a range of reasonable values to provide the most meaningful context to the viewer.
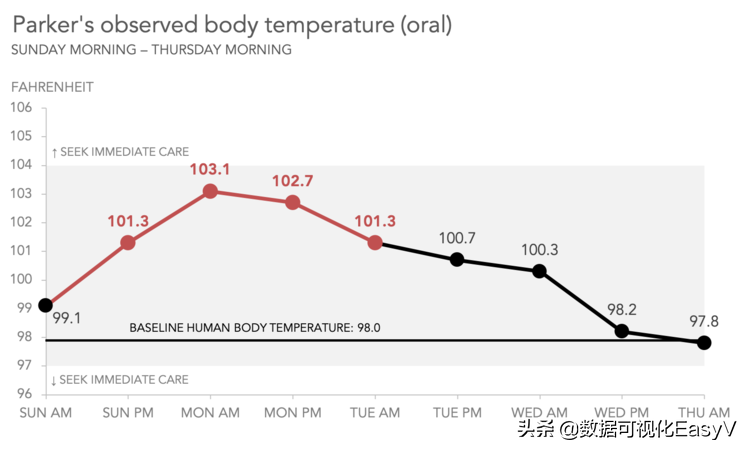
DO: Use a reasonable range of values.
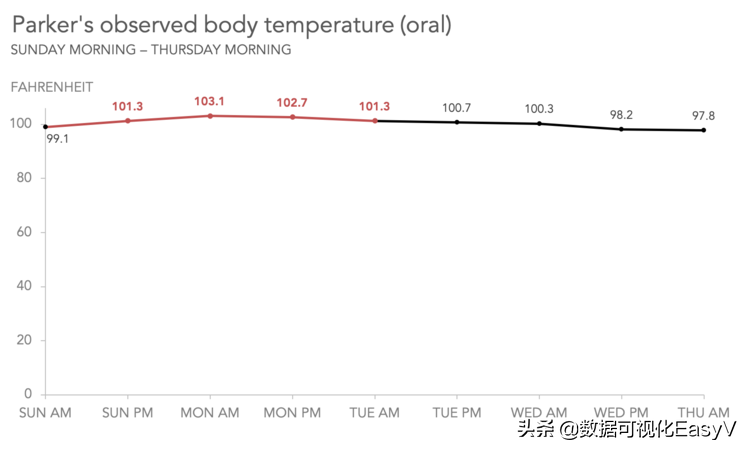
DO NOT: Include zero if it is a nonsense value.
Some of your measurements were negative.
It may be important to include a horizontal line as a reference point for zero, but no data series on our graph should cross any of our axes. It's best to keep the minimum of the y-axis below the minimum measurement of the data so that our baseline becomes the boundary line of the data.
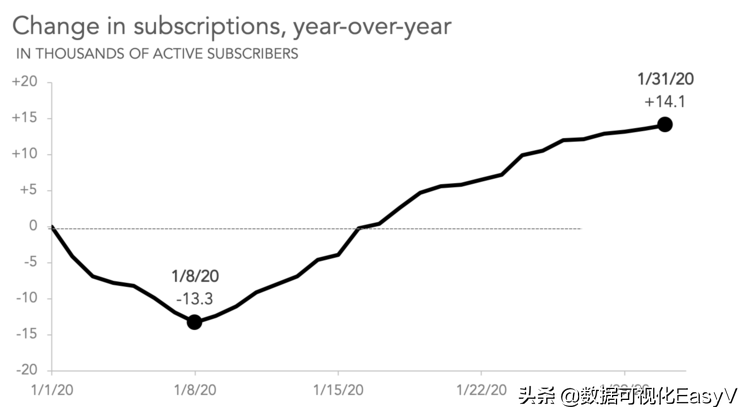
Do: Keep the axes below the minimum data.
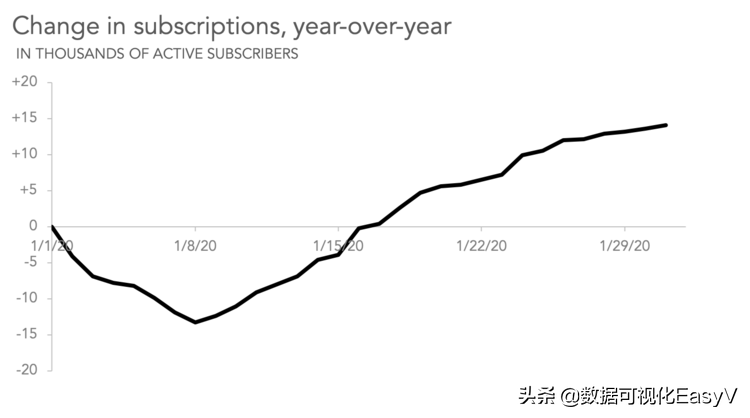
Don't: Let the axes cut into the data.
Important! In cases where the baseline of the line chart is not zero, it is important to make the facts obvious to the viewer, so they are not misled by the enlarged pivot chart.
How much space should I leave at the top and bottom of my chart?
The exact answer to this question will vary with each graph you make. A useful starting point is to have the min to max range approximately 70-80% of the available vertical space for the graph, with roughly equal spaces above and below.
From there, you can modify the axis ranges and the position of one or more lines drawn on the graph to suit your specific needs. The relative slope of the line doesn't change, so do your best to choose an axis range that has integers for the axis labels, includes a certain amount of whitespace in the chart to contain data labels and annotations, and is wide enough (if necessary) to show A reference line (such as a target or forecast), which may be greater or less than your minimum or maximum measurements.
In each case, it is important to present the data in a manner that is thoughtful and thoughtful so that your message is clearly understood by your audience.
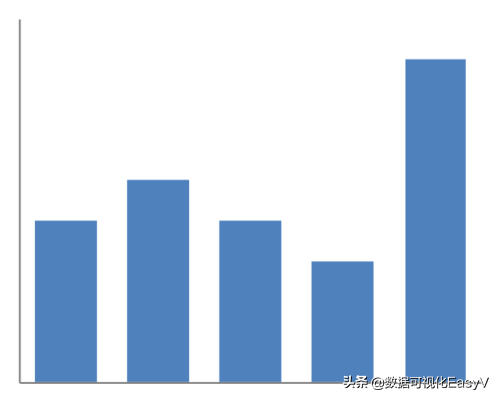
What is a bar graph?
A bar chart is a common type of chart used to plot categorical data or data categorized into groups. It consists of multiple rectangles aligned to a common baseline. The length of each element is proportional to the value it represents, in other words, in a bar chart, the data is encoded by length. Our eyes are pretty good at comparing lengths when objects line up, which makes the graph easy to understand - which is just one reason bar graphs are so common.
Our eyes start at the bottom and scan towards the end of each bar. We measure the length relative to the base line and other bars, so determining the minimum or maximum bars is a simple process. We can also see the negative space between the different heights of the bars to compare the incremental difference between them.
These graphics are not only easy to read, but also widely recognized. You may have come across standard horizontal or vertical bar charts. But bars come in many shapes and sizes. I'll list some of the most common variations below, with links to examples.
What are the common types of bar charts?
Vertical Bar Charts Standard vertical bar charts (also known as column charts) are one of the most common varieties, and almost all tools have built-in functionality to create them. Just because they're common doesn't mean they're boring. Read more about how to use the basic vertical bar to tell multiple stories.
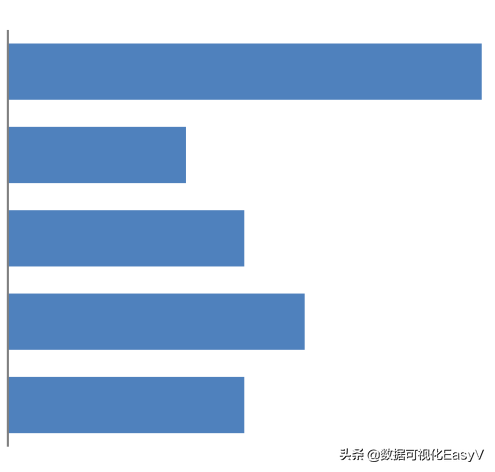
A horizontal bar chart is similar to a vertical bar flipped on its side. This is a good choice for long category names, as the space on the left enables horizontally placed text (replacing diagonal text on the x-axis for vertical bar graphs). Horizontal bars are easy to read because the structure mimics how we process information (in Western culture), we read from left to right starting at the top. Check out this article for easy horizontal bar makeovers.
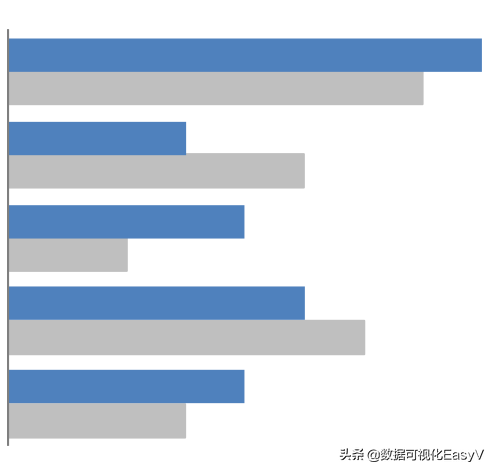
Cluster bar vertical and horizontal variations can display multiple series. Note that adding many data series on a bar chart can make it difficult to focus and identify key points. It is also important to note that there is a natural grouping, so note the order of the series within each cluster. Read more to learn how to use clustered bar charts to compare multiple series.
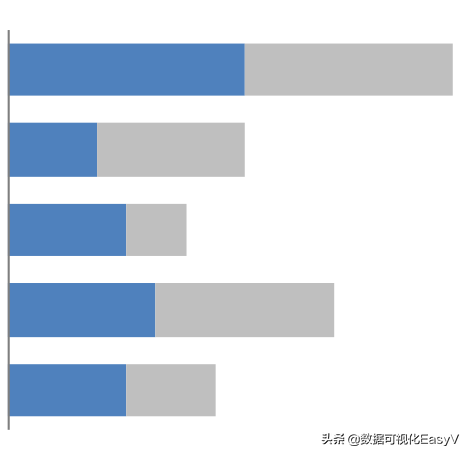
Stacked Bar Charts Stacked bars come in vertical and horizontal forms. They allow you to compare totals by scanning both ends, and also display subcomponents within each category. The challenge with stacked bar charts is that it is difficult to compare subcomponents within categories that are not aligned to the same baseline. Here's an article with more examples of working hours for a stacked bar chart.
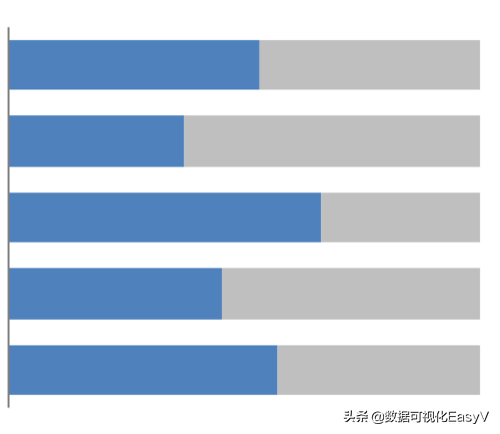
100% Stacked Bar Chart A 100% stacked bar chart (showing horizontal change on the left) is an alternative to the standard stacked bar chart, where relative percentages are shown instead of absolute values. The nice thing about this version is that it gives you two consistent bases of comparison: one on the left and one on the right. Read more to learn why this is a great way to visualize survey data.
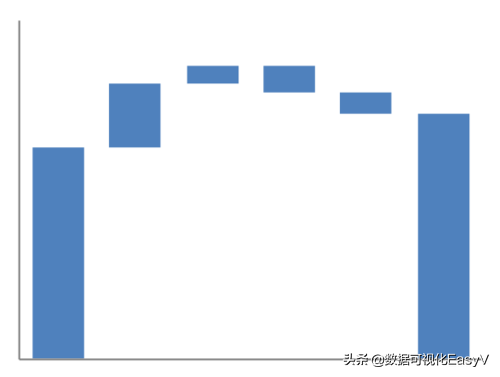
Waterfall Charts Waterfall charts are a more advanced variant of bar charts that are not widely used. This chart can sometimes be used to visualize changes, where the first bar represents the starting value and the last bar represents the ending amount. Small bars in the middle represent incremental changes from start to finish. Learn how to create a waterfall chart in Excel.
What tools can make bar charts?
Most visualization and analysis tools have built-in functionality to easily create standard bar charts. Here are some general bits of knowledge and source links to get you started.
- Spreadsheet
- Data Wrapper
- Boom
- Screen
- PowerBI
- Microsoft Slideshow software
- data room
- information newspaper
See Exercise 2.2 in Let's Practice for an example of a tool-specific bar chart! The solution features the same vertical bar chart created in several different tools: Excel, Datawrapper, Flourish, Google Data Studio, PowerBI, R, Python, and Tableau.
What are the tips for designing bar charts?
Here are some formatting steps to consider when designing a bar chart.
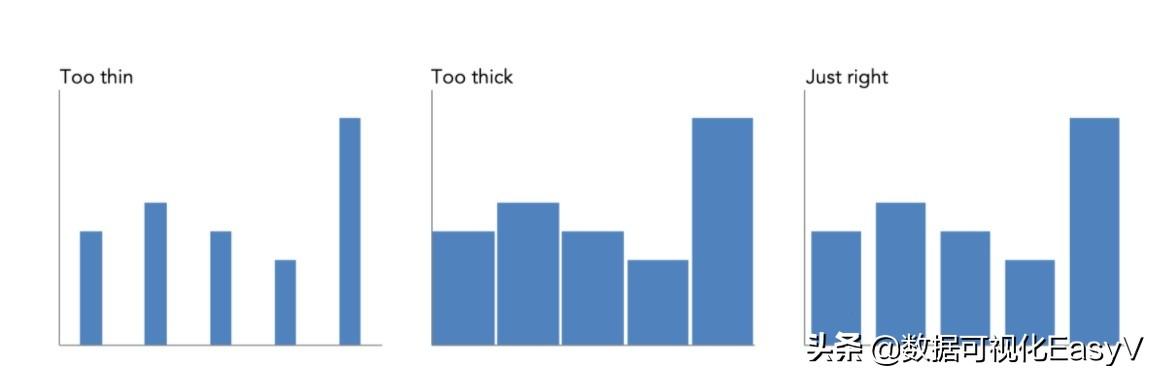
- Adjusts the gap between the bars. There are no specific rules here, but in general, the gap should be thinner than the width of the bar. In Excel, you usually choose a gap width percentage between 30%-40%. The goal is to maintain a healthy balance: you don't want to have so much white space that the data doesn't stand out, but you also don't want the bars to fit so tightly together that they appear as a single shape than distinct elements. Use good judgment here! (This is an exception if you are creating a histogram, which is a special use case to show the underlying distribution of a data set. Histograms are popular among techies, and the bars are intentionally placed between the lack of space, so the distribution is considered as a whole)
- Consider the order of the bars and how the reader will understand them. If there is an inherent order in the data (for example, ordinal categories like age ranges or Likert scales), consider using this natural order. If this is not the case, consider ranking according to the data, for example, largest to smallest, or smallest to largest, based on what you want to convey.
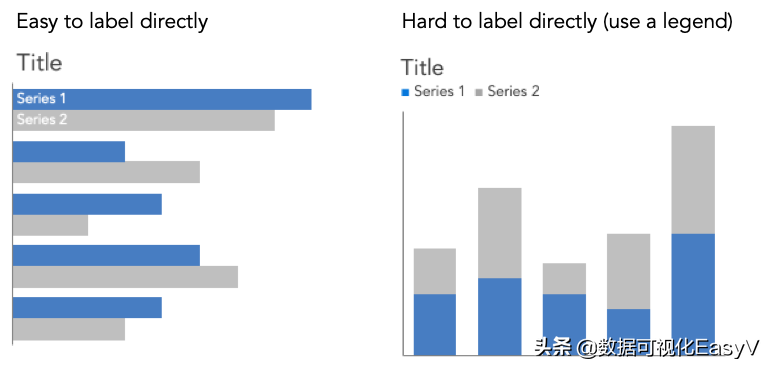
- The label for the bar chart. I often find myself preferring bar chart labels over other chart types, especially when I'm not using the axis to label categories. Bar charts usually don't have a lot of white space, so to prevent confusion, I prefer to label the category names in the bar chart. This is sometimes difficult to do with vertical or stacked bars where horizontal space is limited. So it's not uncommon to add a legend to a bar chart if I can't add labels to the bar or place them directly to the side in a visually appealing way. When using a graph, I like to place it under the heading so the reader is confronted with how to read the graph before touching the data. In the visual below, you can see how I typically label series in horizontal and vertical bar charts.
- Moves the direct data label within the column. The strips can feel heavy and take up a lot of ink. If you label the values of each bar directly, consider moving the data labels to the bar ends to prevent confusion. This small change in position can trick our eyes into thinking there is less while retaining the same amount of detail.
- Use a zero baseline. This is an important rule to follow. Since the data is length-encoded, the entire bar range needs to be shown. Otherwise, our relative measurements will be inaccurate. If you need to change the baseline to convey minor differences, there may be another chart type that better suits your needs.
What is an area chart?
An area chart is a special form of a line chart in which we not only connect the data points with a continuous line, but also fill the area under that line with a solid color. It might seem like a small cosmetic change, but it has a big impact on how we see the data in the chart.
Area charts can be effectively used for:
- Shows the rise and fall of various data series over time
- over time conveys the total amount< /strong>and subdivision of some subcategories (but only to a point)
- When parts are large or go from large to small, over time Override to emphasize relationships of parts to the whole
- Displaypanels in small multi-diagrams >Changes over time
Area charts are not ideal for the following situations:
- The dataset on the scale has no meaningful relationship to zero
- shows some volatile over time Dataset
- displays slight differences
In this article, we'll discuss how area charts work, and some of the challenges to keep in mind when considering creating an area chart.
How do area charts work?
Area charts are the same as regular line charts, with two exceptions:
- The space between the x-axis and each line in the graph is filled with some color (the color or opacity may vary depending on the designer's preference).
- The x-axis must be zero.
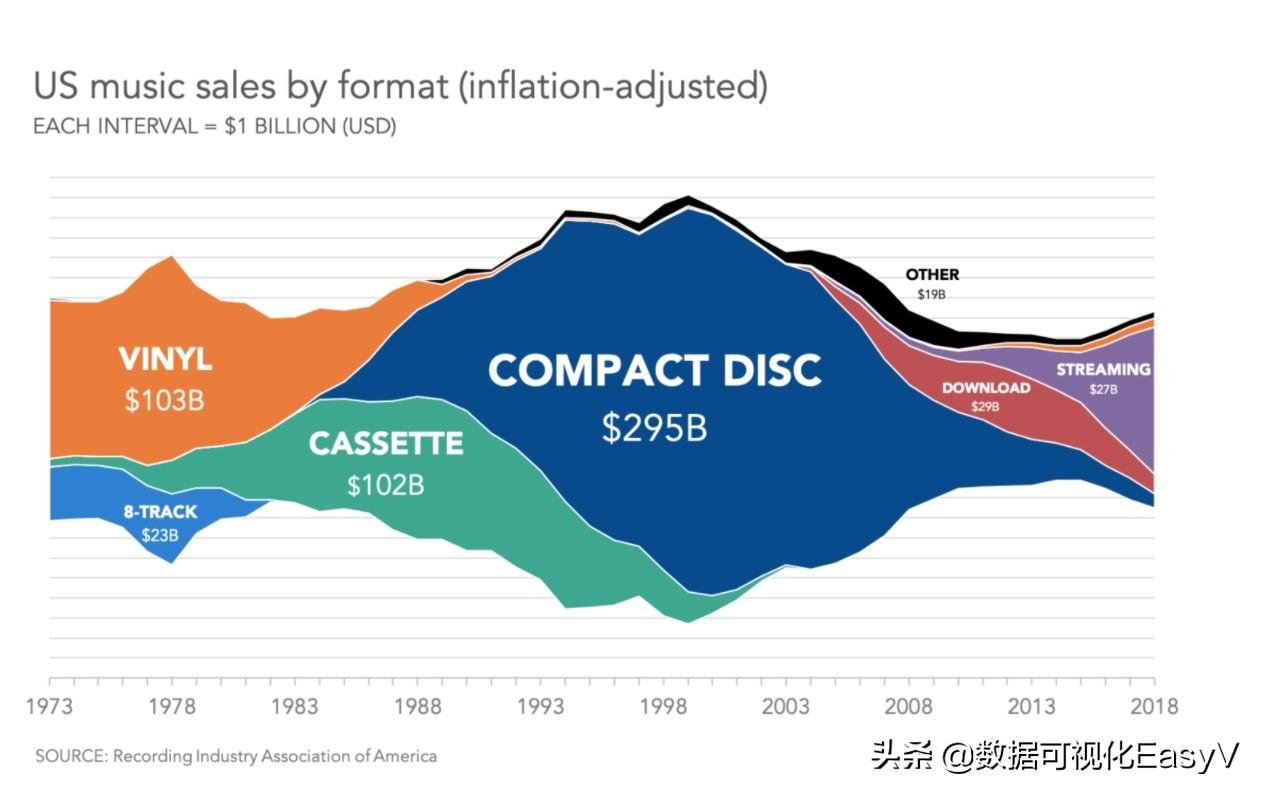
Here's a line chart of U.S. music sales over time, broken down by format:
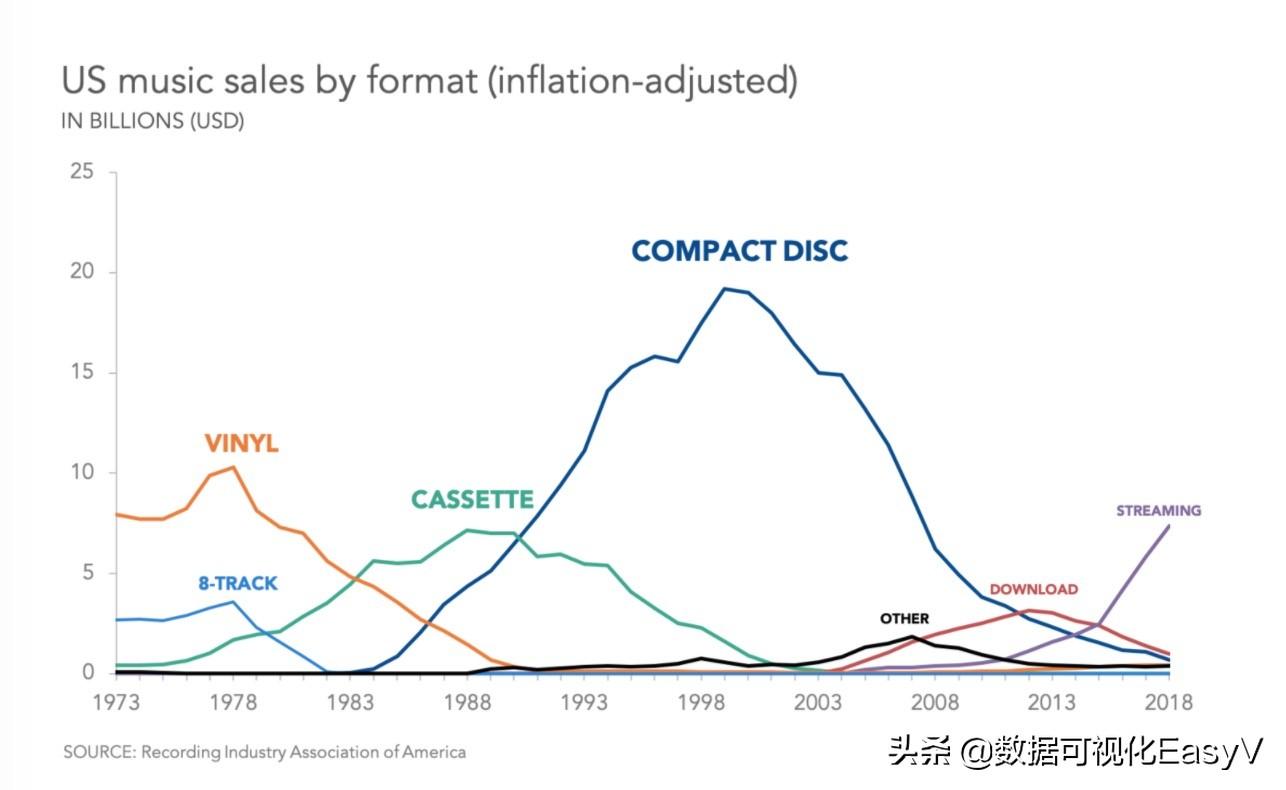
Remember that when we're looking at a line chart, we're looking at how the values on the vertical axis go up and down as we go from left to right along the horizontal axis, and we're comparing the lines to each other, not the compare them to each other. Height from the x-axis. By their very nature, line charts are better at showing how values change over time than the precise number of each measurement point.
However, our perception changes when the chart creator adds a color fill between the line and the baseline, turning a line chart into an area chart.
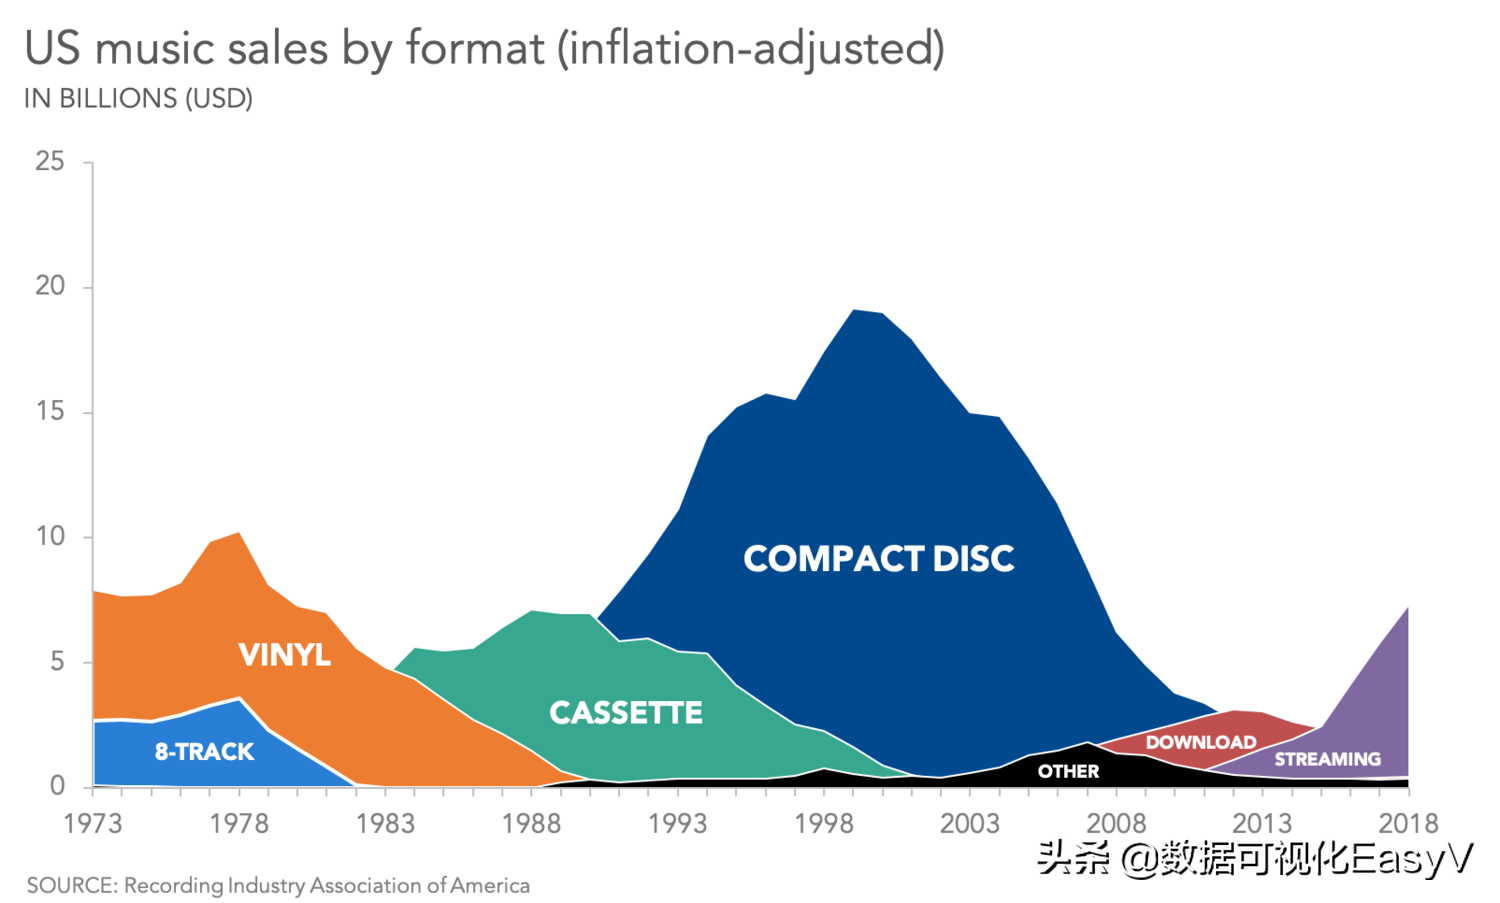
Instead of seeing lines, we see each data series as a polygon, a shape; and we judge each data series less by how it changes over time and more by our perception of colored Judgment based on the overall area of the area.
Area charts change the purpose of line charts from simply showing relative change over time to additionally showing volume or quantity.
Therefore, we cannot use scale bars on area charts that have no meaningful relationship to 0. Again, just like bar charts, we must use a zero baseline.
When are area charts useful?
Area charts would love to replace line charts. They're colorful, eye-catching, and uncommon enough that the novelty factor tends to grab attention. However, as we discussed earlier, line charts and area charts are not interchangeable due to the different representations of how the data is perceived by the viewer. We rarely (but never!) find an ideal use case for area charts. In some cases, though, an area chart might be a reasonable choice.
Show multiple series for several different time periods if there are significant differences between the series and over time
Sometimes it is important to show how quantities in multiple related data series change over time. Bar charts are good at showing quantities at a point in time, but multiple series spanning multiple time points are difficult to display as a bar chart. The graph becomes very crowded and confusing.
Area charts attempt to provide a sense of quantity at all points in time by creating irregular polygons filled with color. However, where the data series overlap, it may be difficult for the viewer to understand that two (or more) fills occupy the same space.
Continuing with the example we've been using showing inflation-adjusted music sales by format over time, we try to mitigate this by making a small change to the opacity of the "fill" color challenge, as shown below.
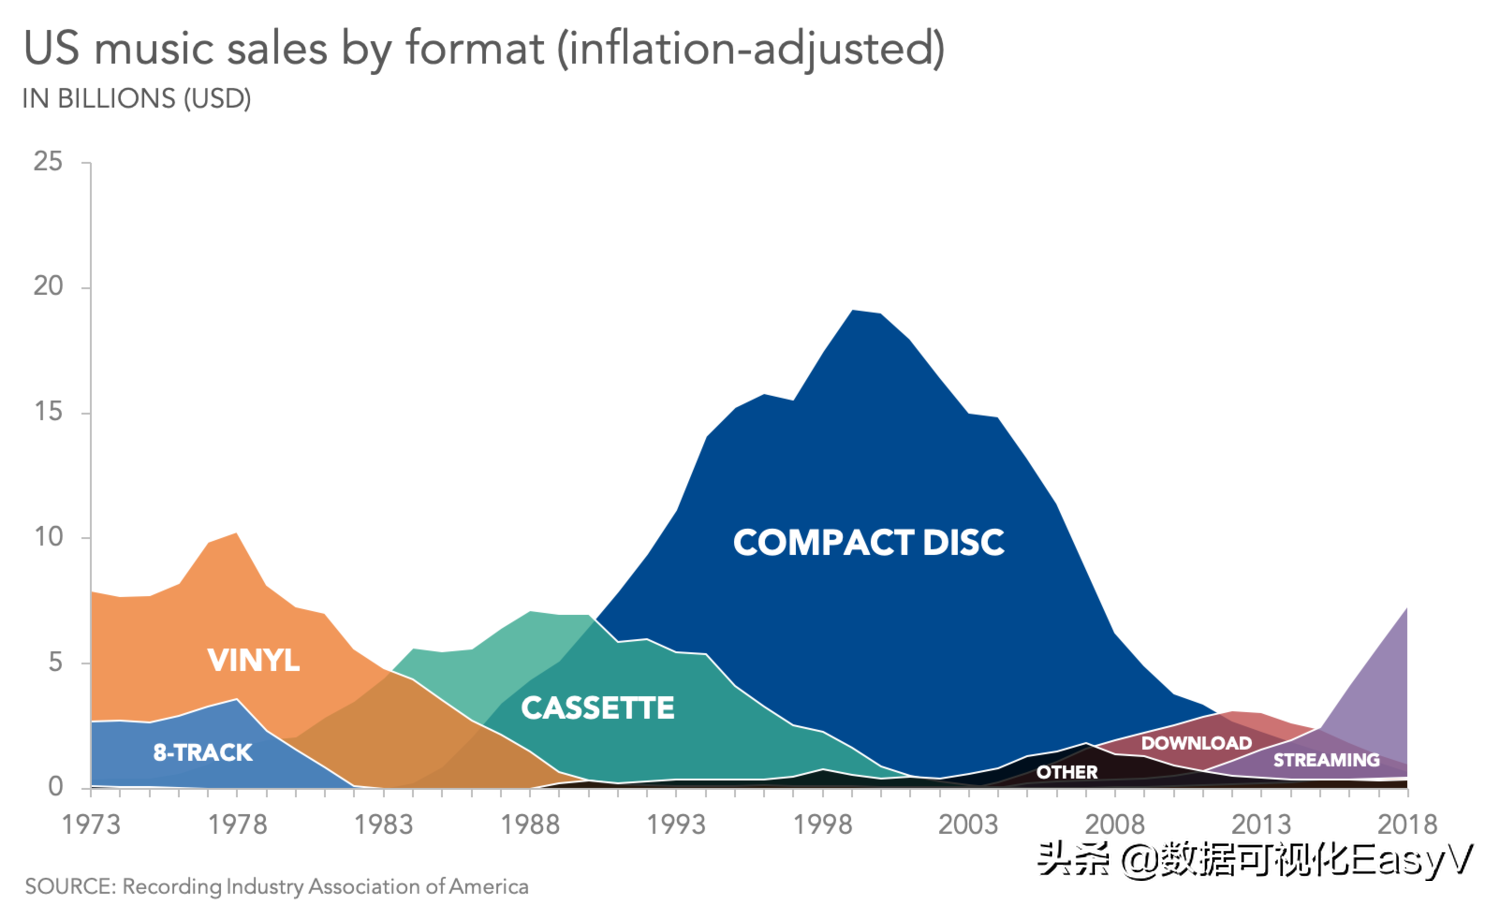
For pure opaque fill, for example, we don't know how many cassette tapes were sold before 1983, or how many CDs were sold before 1990. (It is difficult to know how many cassette tapes were sold before 1979 because the three series overlap. , and the "cassette" data series is pushed to the furthest back. This type of chart also requires the designer to The order of the data series is chosen carefully.)
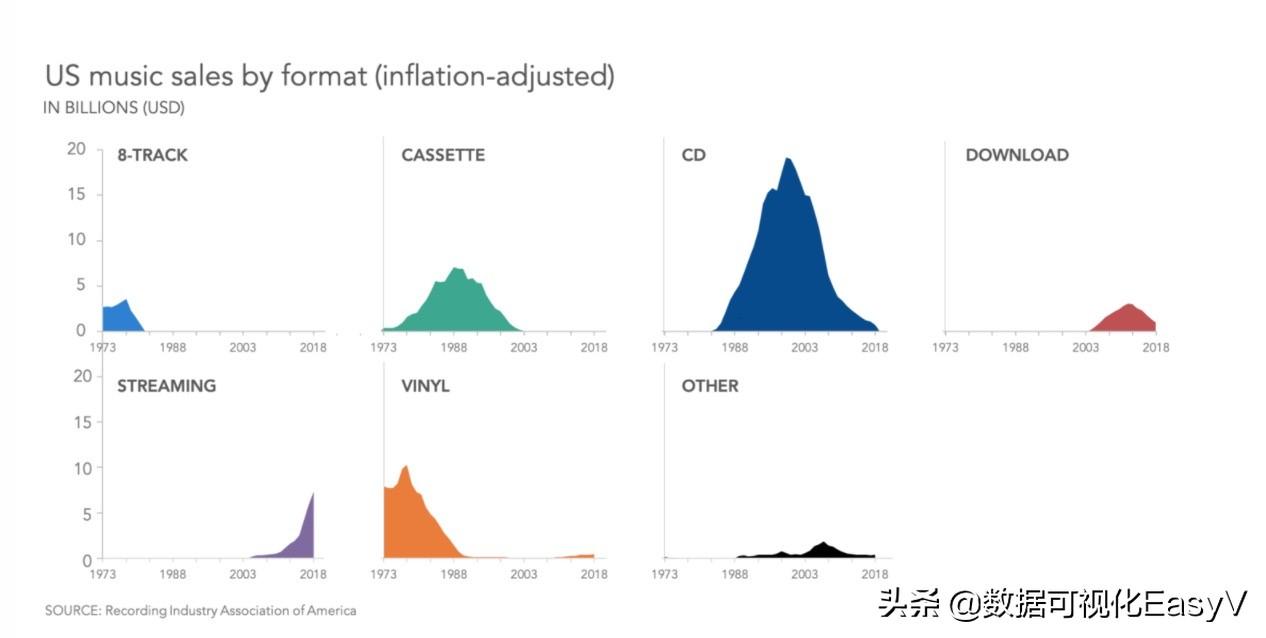
Display several (or dozens) of series over time in small multiple charts
Area charts are useful in small multiple charts (also known as panel or grid charts). When you have multiple data series, instead of overlaying them all on one graph, you can display them as a small single graph in a regular chart-like series. Area charts can help viewers compare volume and time changes on these panels.
Show the difference between two series or between a series and 100%
They can also be useful if you are trying to show the gap between two (and only two) series or between a series and 100%; and that gap is more important than the absolute value between the lines. The area between the shaded lines can emphasize that gap.
What are the challenges of area charts?
This particular chart type combines controversial visualizations such as bubble charts (comparing by area), stacked bar charts (comparing subcategories by category), and scatterplots (allowing some data to be hidden behind others) quality, while encouraging the use of color as a classifier rather than a focus tool. Therefore, it is only natural that area charts have some drawbacks.
In most cases, some of your information will be hidden
Because your data series occupy the same space in the graph, they will inevitably overlap. Best case, your data series never cross each other, so the chart looks like a mountain range with all peaks visible. More likely, you'll see at least one instance of data series crossing each other in the chart, and then inevitably there will be hidden data.
Viewers cannot always determine what baseline value each series is using
Much like a stacked bar chart, the stacked area chart includes subcategories for each value that add up to the total value on the x-axis. Instead of each data series dropping to zero, they are all stacked together.
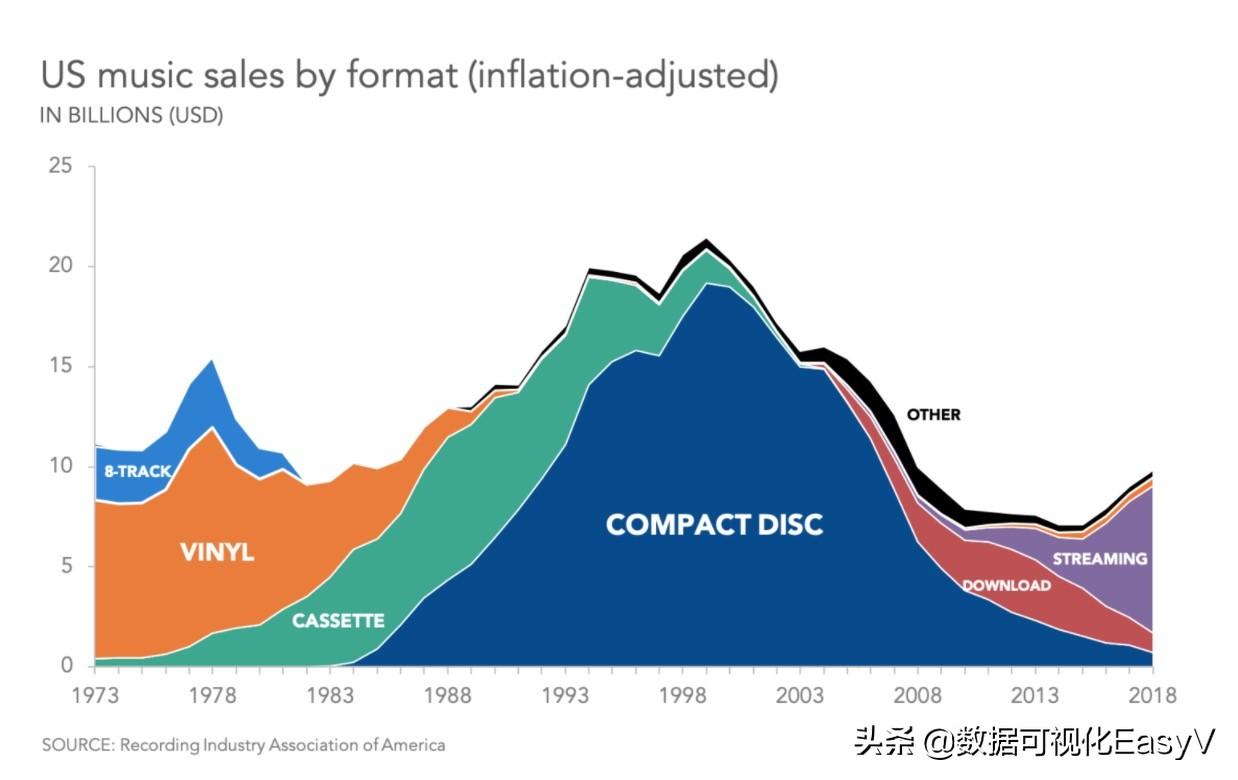
Question: In this chart, which 8 tracks sold tens of billions of dollars in 1973? Over $10 billion, or around $3 billion? We can't be sure because we don't know if the chart we're looking at has all the data series superimposed on top of each other (so the "8-track" series has a baseline at the "vinyl" series), or if every series uses a common baseline of zero (so , the "8-track" series is often hidden behind "vinyl" and "cassette tape").
If the same baseline is used for each series, having a semi-transparent fill color will make that fact clear. On the other hand, a stacked area chart can never convince you with 100% confidence that it is actually a stacked area chart, because there is always the possibility that it is just a regular area chart with an opaque fill color.
Sometimes you'll see a variation of a stacked area chart called a Stream chart. In this version, instead of stacking in one direction, they grow symmetrically up and down.
With a flow graph, it's less likely to be mistaken for a pure area graph, but this comes at a high price: you lose the ability to see fine details (including a labeled y-axis) for years to come Compare. ...using such a graph might draw attention and encourage the viewer to use the data, but any real insight would likely require additional graphs, labels, and annotations.
It is difficult to judge the area
People have a hard time judging relative areas, whether it's how big one circle is relative to another, how slices of a pie chart compare, or the size of squares and rectangles that don't have a common baseline. In area charts, we have a more difficult task: comparing partially covered, irregularly shaped areas. As you might imagine, it's nearly impossible to do this exactly.
For example, it is difficult to make a multi-year visual comparison of any data series that does not use a zero baseline. (On streaming, this applies to every series.) Obviously, 8-track sales total more than downloads or streaming? Is it easy to see that sales of VInyl and Cassette are within 1% of each other? Not without data labels. The continuous and irregular nature of the boundaries of each region in a stacked area chart makes these comparisons more difficult.
More ink, more overlap, more clutter for attention
Finally, Area charts, by their very nature, require more "ink" to convey more information. Area charts with even just one data series are much messier than line charts. The more series we add, the more cluttered and difficult to read it becomes. It is more challenging to focus the viewer's attention on one element of an area chart.
Conclusion
The advantages and disadvantages of some of the charts used in the large-screen visualization in this issue are briefly introduced. In the next issue, we will introduce the remaining three charts. Only when we understand the advantages and disadvantages of various charts can we extract them in the large-screen design The graphic form suitable for our project makes the information conveyed by the large screen more specific and clear at a glance.
Disclaimer: This article is a reprint of a foreign language document. If there is any infringement, please contact to delete
Original: http://www.storytellingwithdata.com/chart-guide
Edit: nine seven
Free application for EasyV use click below
Articles are uploaded by users and are for non-commercial browsing only. Posted by: Lomu, please indicate the source: https://www.daogebangong.com/en/articles/detail/If%20you%20want%20to%20learn%20data%20visualization%20you%20should%20first%20understand%20the%20specific%20purpose%20of%20these%20charts1.html
 支付宝扫一扫
评论列表(196条)
测试