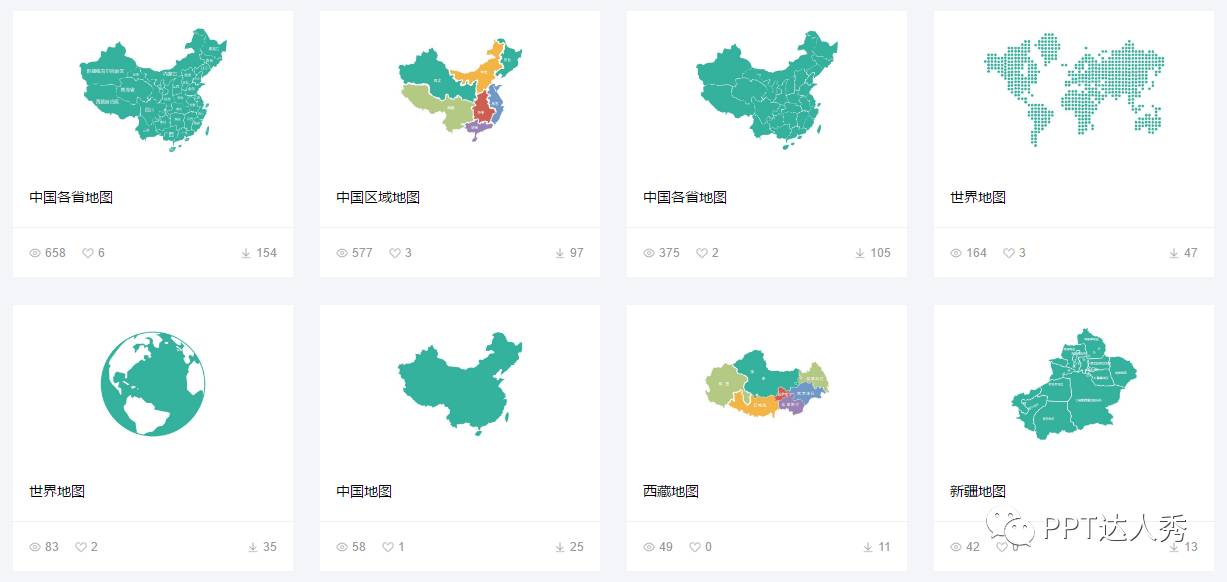
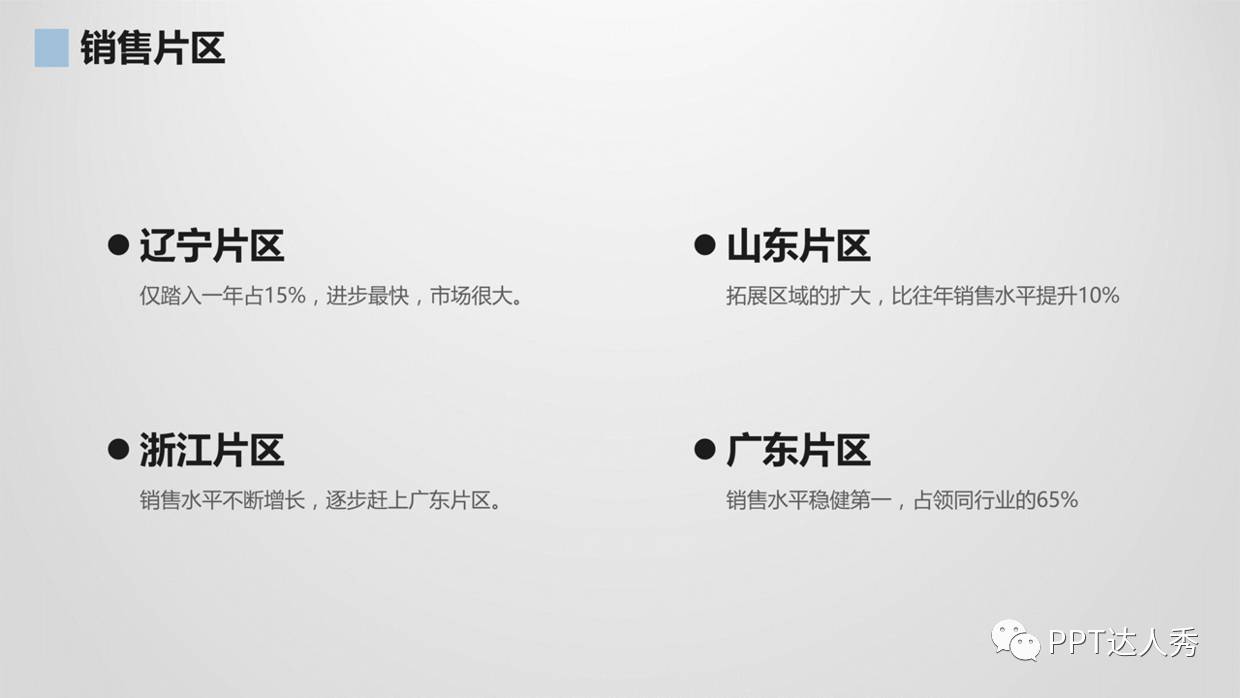
The most common category is the sales area category, which often appears in work reports about the sales development of a certain area, or the expansion of business to what area.
If it is displayed according to the general data, I think this is it.
A few dry text data, no desire to understand.
The product sells well overseas.

The world map can also be displayed, it can be seen that it is a product of Germany Sold to China, Australia, South Africa, Canada.
The sales situation at home and abroad is clear at a glance.
Graphical display, the audience will not look sleepy.
Of course there are other ways to display, let's look at the group data.
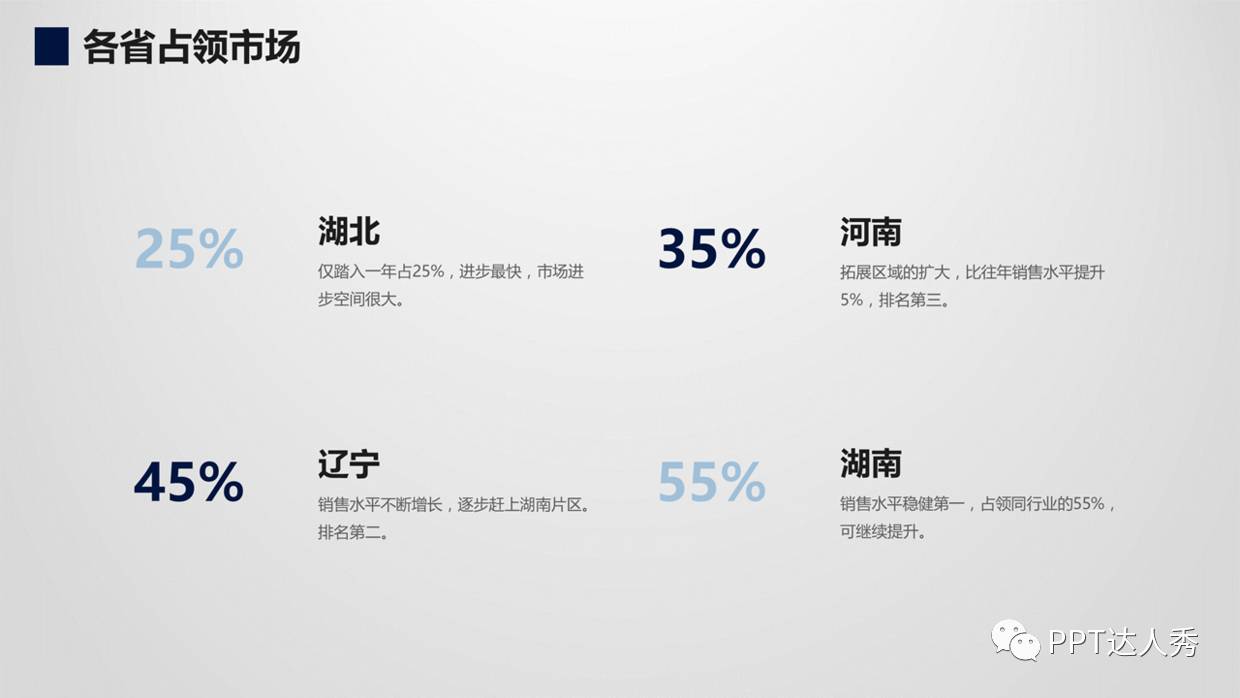
Obviously this data is bigger than the first plain text data good point.
The enlargement of the data allows the audience to grasp the key points at a glance.
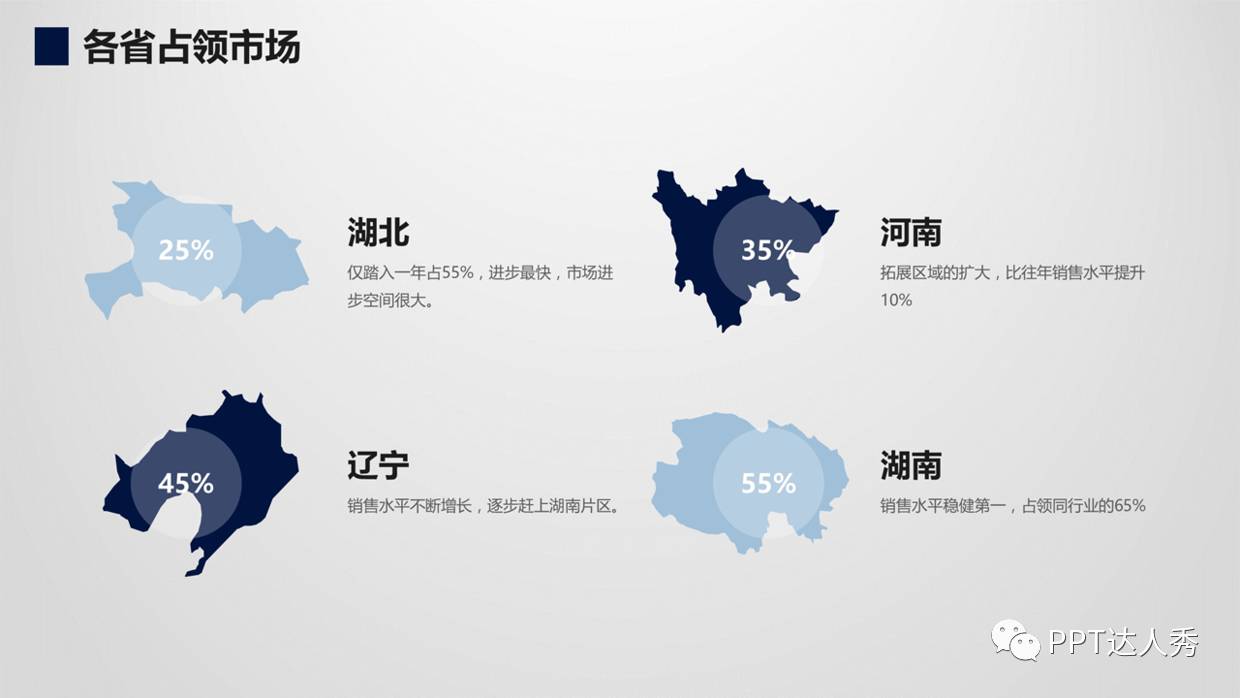
3. Economic growth
List the areas separately, the impression is more impressive, and the picture is richer.
Through the data display of the urban economic situation, plus small columns The combination of shapes and diagrams is also very effective.
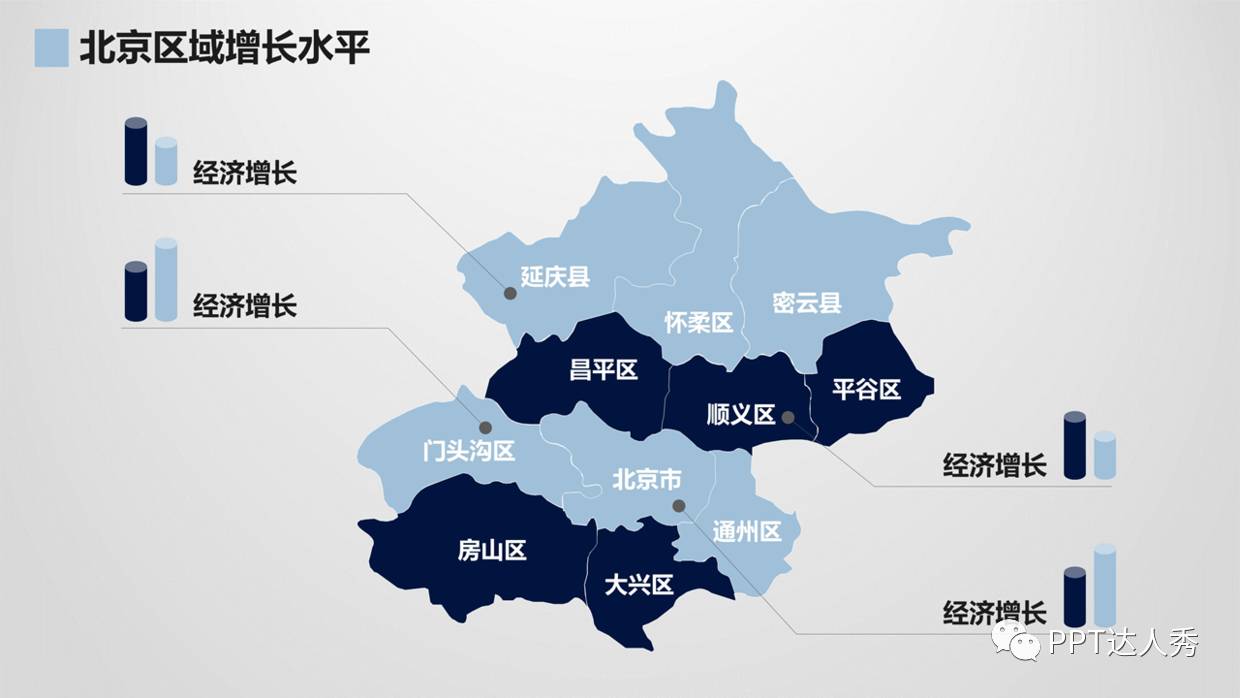
Four, geographical classification
The division of the country. Weather forecasters like to use this type.
5. Travel footprints
Self-introduction of the places where I have traveled and studied.
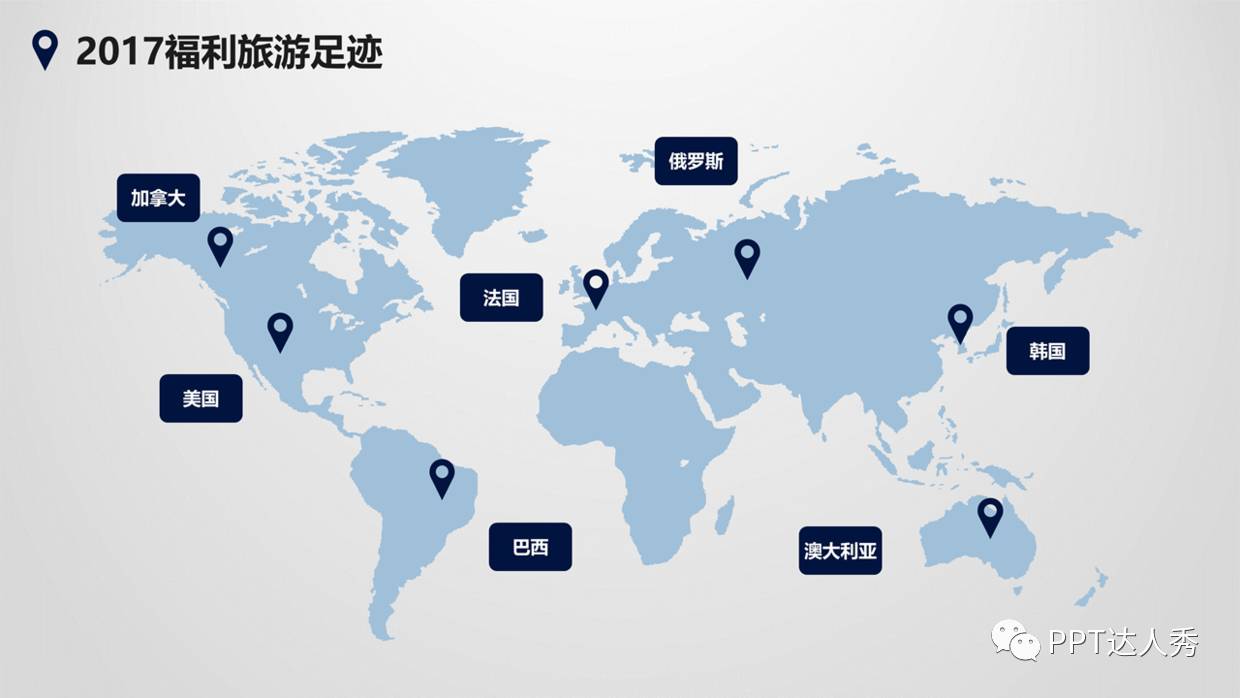
Self-introduction in PPT speech.
If the hometown is displayed in this way, I think it will definitely give Colleagues lead to impress.
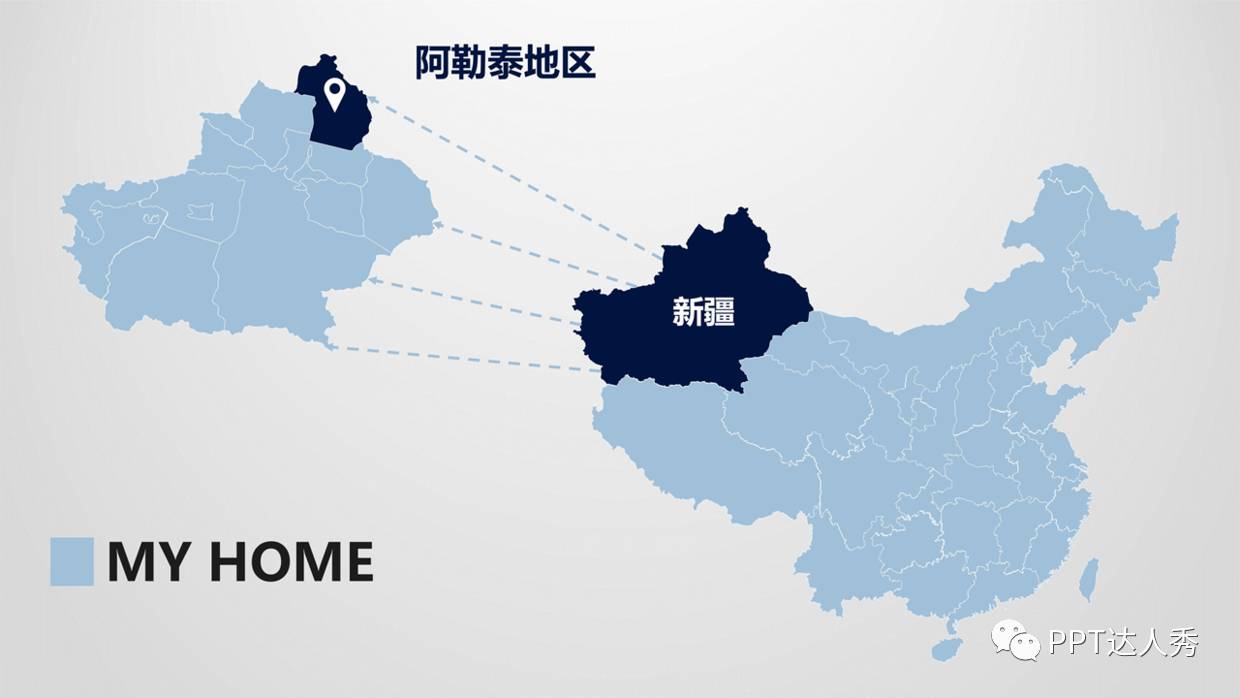
6. Population Planning
Party and government PPT may need some data display, such as demographic data.
Such a display is definitely much better than a set of data .
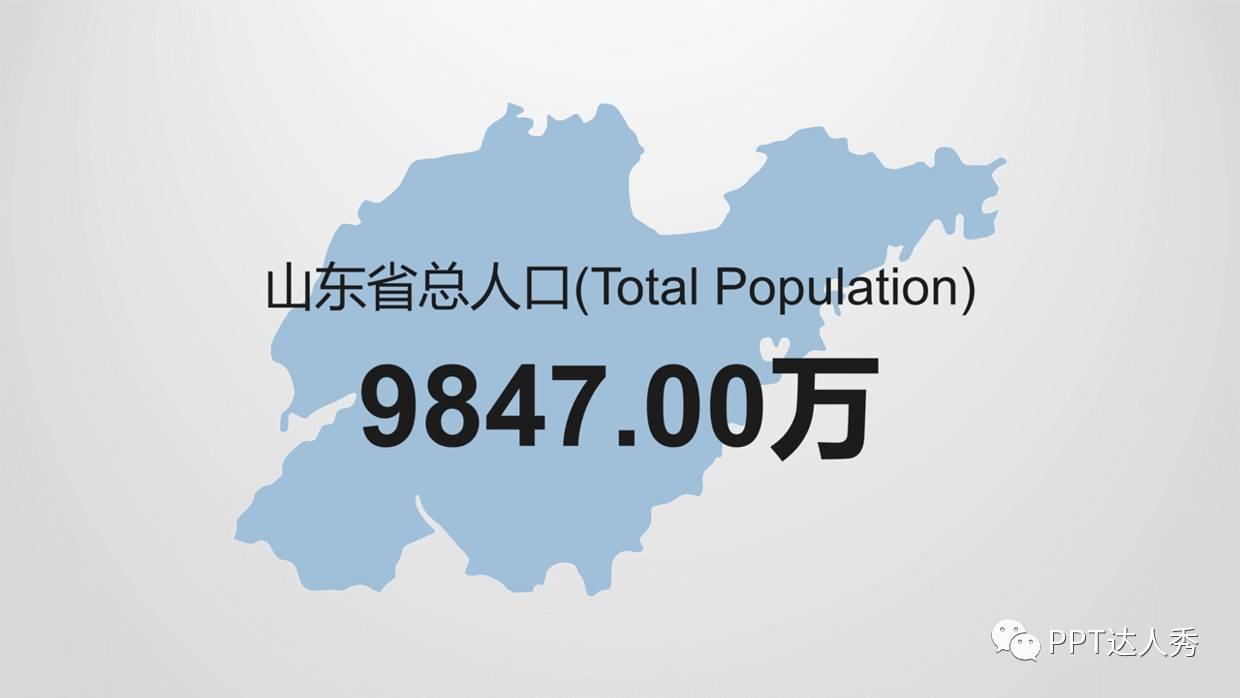
or something like this.
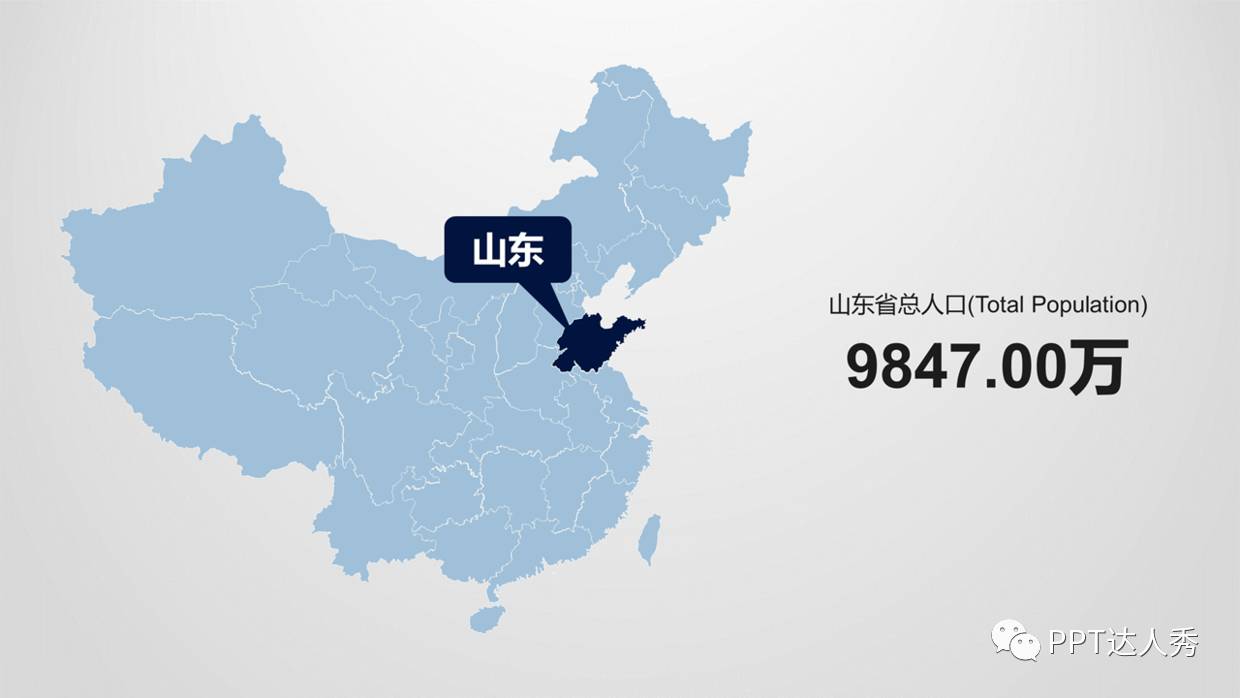
Seven, rich horizontal category
It is also common to display the production level of various products in the world region through maps.
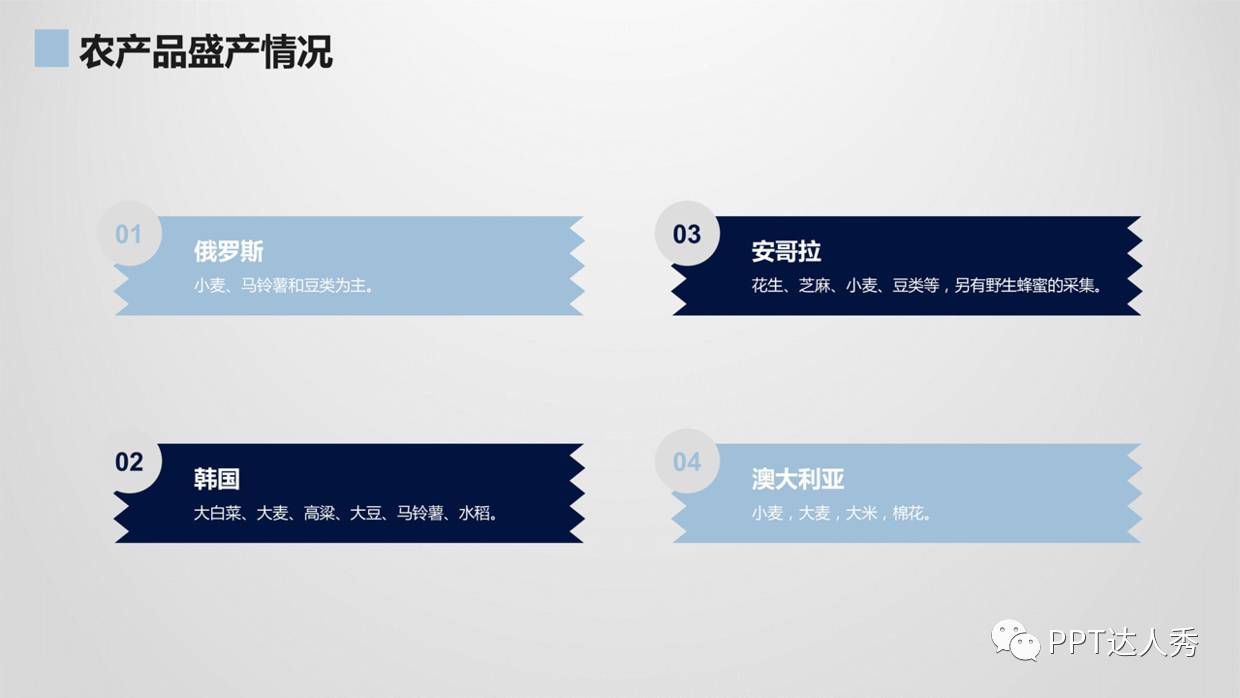
For example, the abundance of overseas agricultural products.
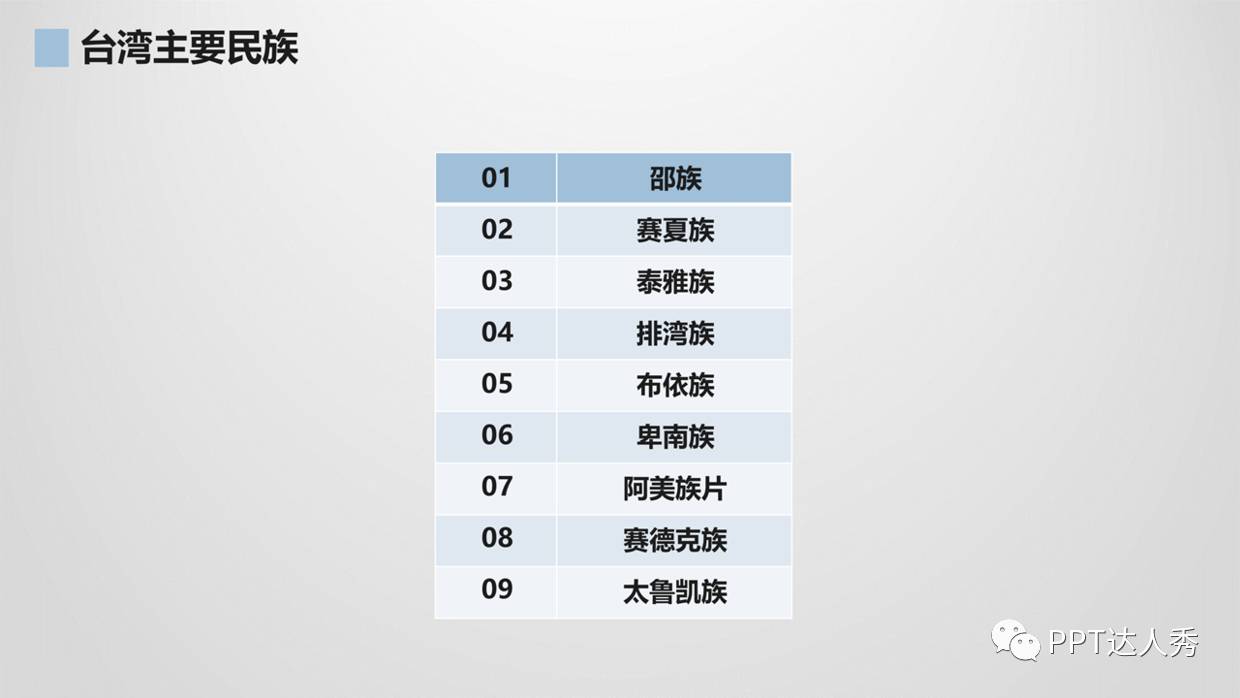
VIII. Ethnic distribution
What are the ethnic groups in Taiwan? A table will do the trick.
What about map?
What else can a map do?
; ; ; ; ; ; ; ; ; ; '>9. BackgroundHow to do it?
Summary~
Xiaowan said here The nine most commonly used map types in life and work.
1. Sales area < strong>2. Occupying the market 3. Economic growth
Fourth, geographical division < strong>5. Travel footprints 6. Population planning
Note: Xiaowan uses PowerPoint2016, and the material comes from KOPPT.
Articles are uploaded by users and are for non-commercial browsing only. Posted by: Lomu, please indicate the source: https://www.daogebangong.com/en/articles/detail/How%20to%20use%20the%20map%20in%20PPT.html

 支付宝扫一扫
评论列表(196条)
测试