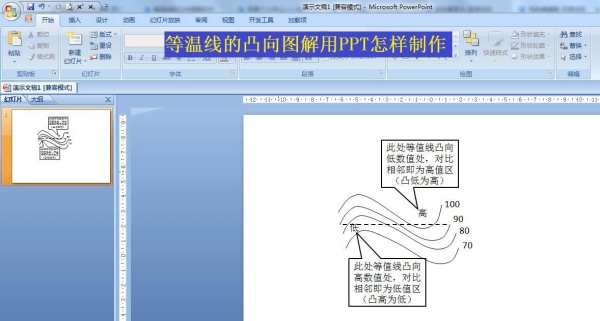
How to make the convex diagram of isotherm with PPT? Xiaobian will share with you the method of making convex diagram of isotherm with PPT today.
ppt template article recommendation:
How to use PPT to draw the cross section of the nut tree
How to make a three-line border with PPT
How to use PPT to make crystal clear snowflakes
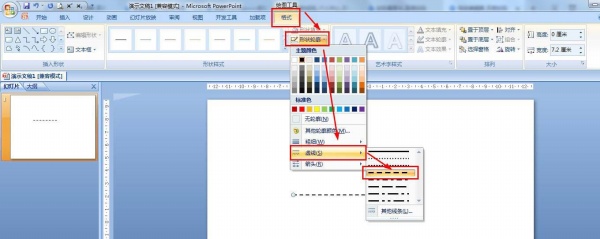
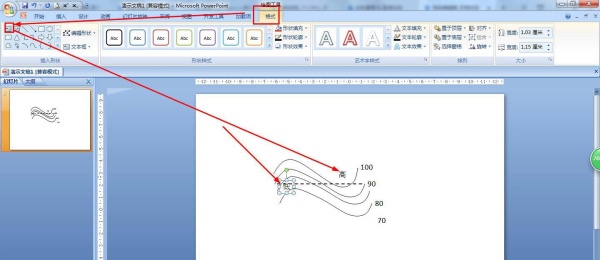
1. Select a straight line in the shape, draw a horizontal line - click Format - Shape Outline - Dashed Line - select Dash Line.
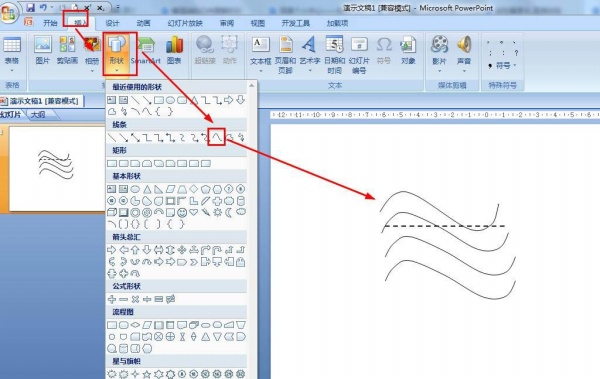
2. Click Insert - Shape - Select Curve - Draw Four Curves - Set the color of the shape outline to black in the format.
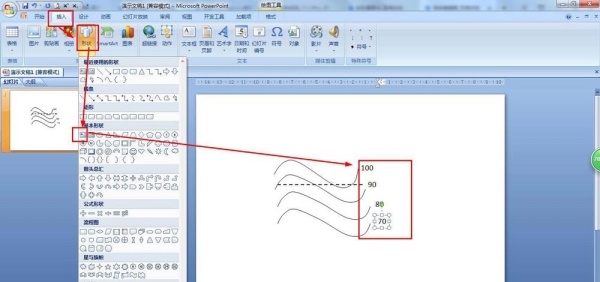
3. Then click Insert - Shape - Text Box, insert a text box at each isotherm - enter a number in the text box.
4. Click Insert - Text Box - insert a text box in the low raised place and enter "high" - also enter "low" in the high raised place.
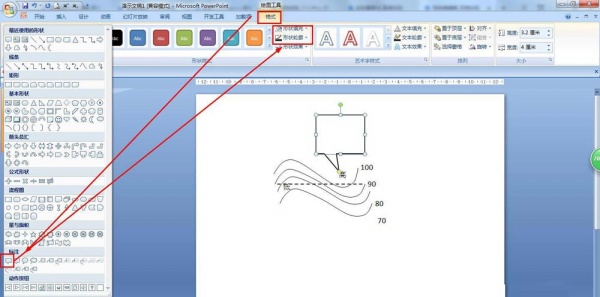
5. Select the logo in the insert shape of the format - draw a rectangle label above the "height" text - set the shape fill to no fill color, and the shape outline to black.
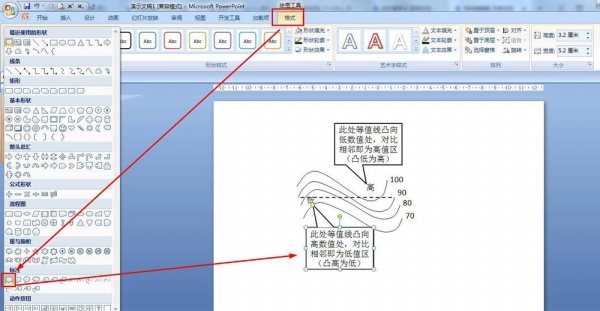
6. According to the method in step 5, insert a rectangular mark without a filled black outline under the "Low" text - enter relevant explanatory text in the rectangular mark respectively.
Articles are uploaded by users and are for non-commercial browsing only. Posted by: Lomu, please indicate the source: https://www.daogebangong.com/en/articles/detail/How%20to%20use%20ppt%20to%20draw%20convex%20diagrams%20of%20isotherms.html
 支付宝扫一扫
评论列表(196条)
测试