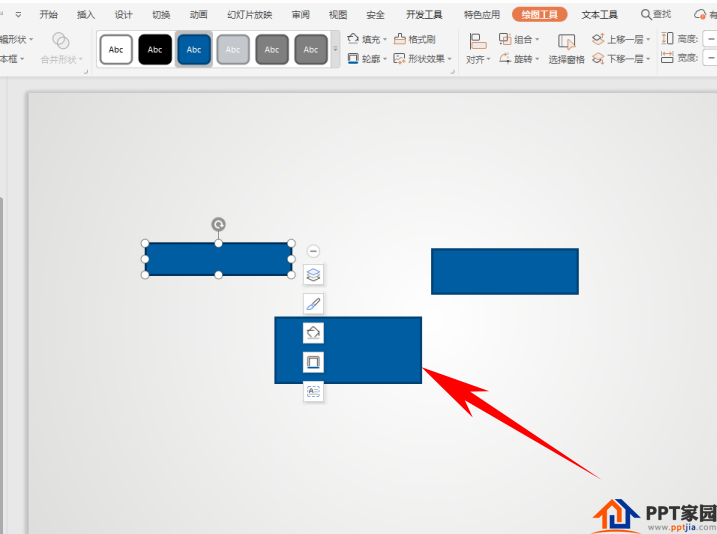
We see the following three rectangles, first set the format of a rectangle:
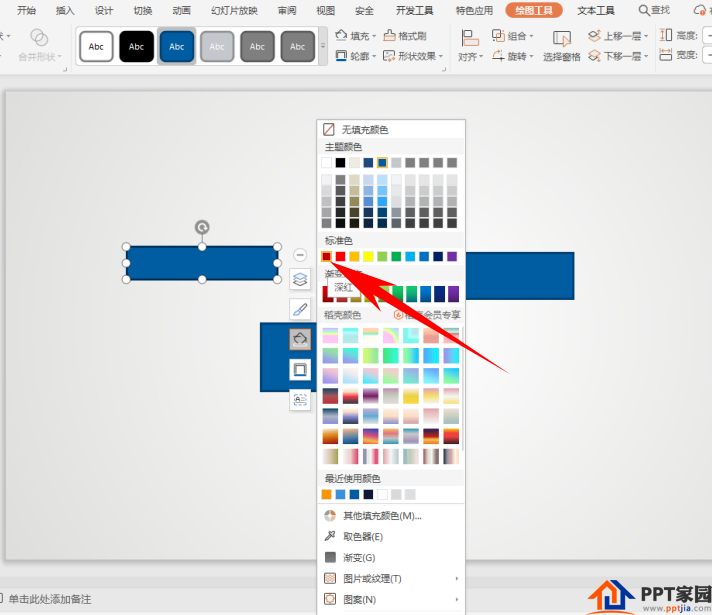
Select the graph, click the fill icon next to it, and choose dark red as the fill color:
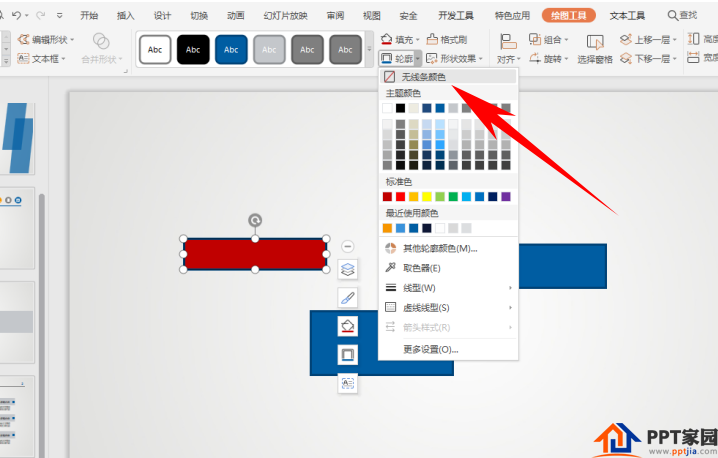
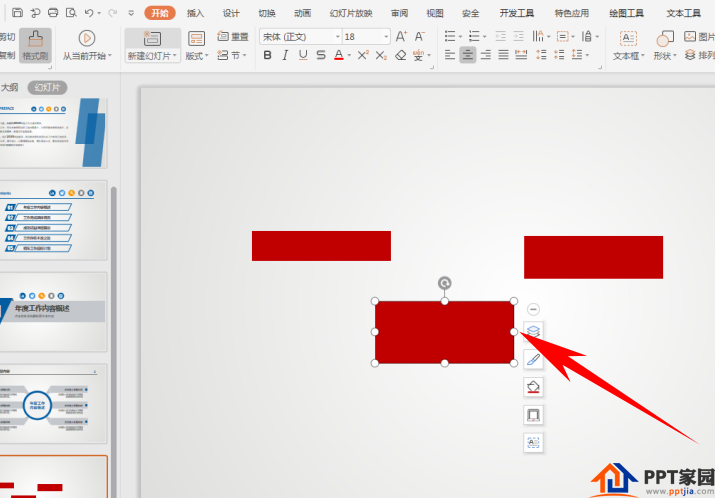
Then select the outline icon and set the graphic to have no line color:
At this time, if you need to set the other two graphics to the same format, click the [Format Painter] under the toolbar [Start], set one click, and if you set multiple graphics, double-click the Format Painter, as shown in the figure below Show:
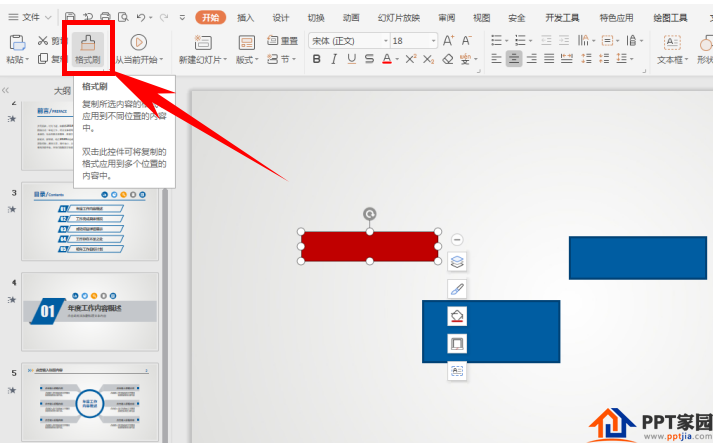
After double-clicking, click the graph to quickly set the same format, as shown in the figure below, all three graphs have become rectangles with red fill color and no outline color:
Articles are uploaded by users and are for non-commercial browsing only. Posted by: Lomu, please indicate the source: https://www.daogebangong.com/en/articles/detail/How%20to%20set%20the%20use%20of%20PPT%20slide%20format%20brush.html
 支付宝扫一扫
评论列表(196条)
测试