If you want to modify the data labels of the line chart made in ppt, how to modify the style of the data labels? Let's take a look at the detailed tutorial below. For more downloads, please click ppt home.
1. Open PPT and create a blank presentation.
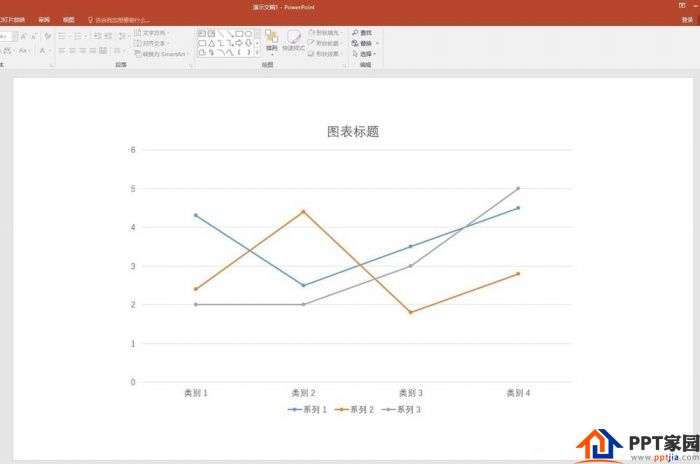
2. Click [Insert] - [Chart] - [Line Chart] - [Line Chart with Data Markers].

3. After clicking [OK], you will get the line chart in the default style.
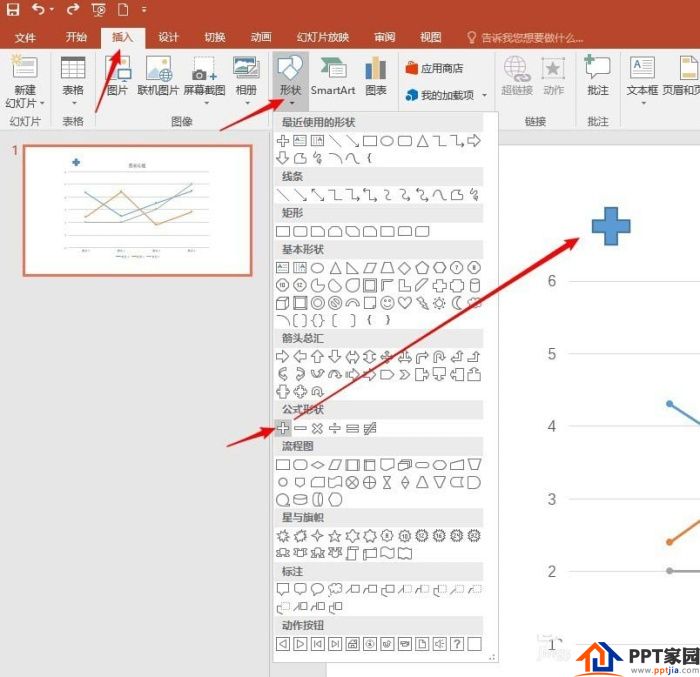
4. Click [Insert] - [Shape], select a shape, and draw a graph as a data label.
5. Set the fill color and border for this graph, then press Ctrl+C to copy, then click the data label in the polyline, and then press Ctrl+V to paste, and replace the built-in data label with this graph.
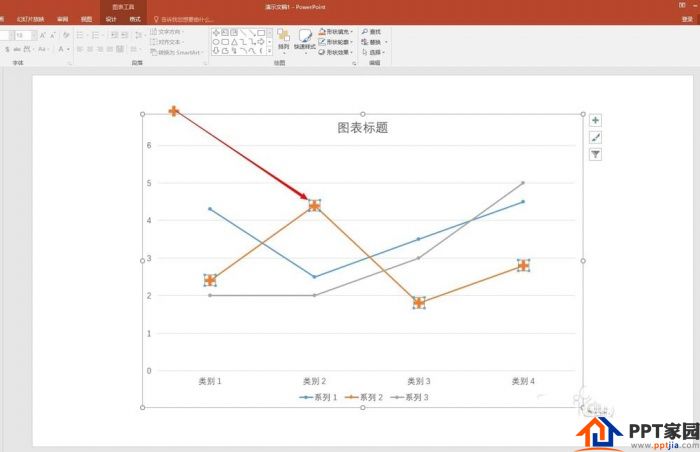
6. Similarly, other graphics can be used, copied and pasted into the data labels of other polylines.

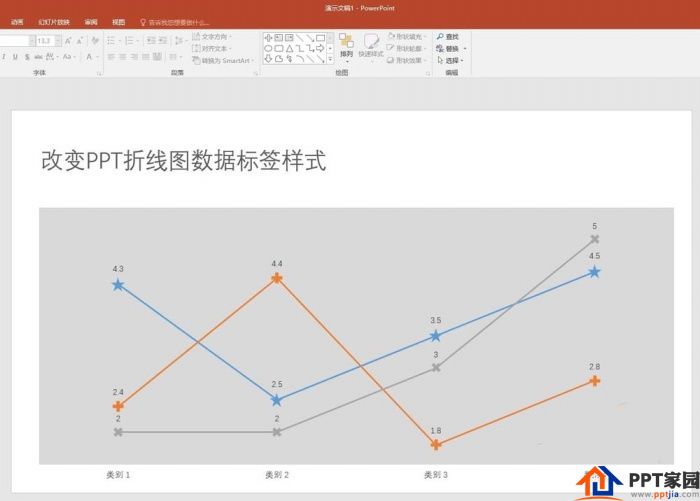
7. Finally, beautify other elements of the chart to get the final rendering.
ppt template article recommendation:
How to add labels with ActiveX control in ppt
How to make tabbed labels in PPT
PPT making tabbed labels
Articles are uploaded by users and are for non-commercial browsing only. Posted by: Lomu, please indicate the source: https://www.daogebangong.com/en/articles/detail/How%20to%20set%20the%20data%20label%20style%20of%20PPT%20line%20chart.html
 支付宝扫一扫
评论列表(196条)
测试