Today, I will give you a little trick: how to use PPT to make dynamic charts. Let's demonstrate how to make dynamic charts with PPT.
ppt template article recommendation:
How to use ppt to make animation diagram of balance beam
How to adjust the transparency of the font border in the text box in ppt
How to make a mind map with ppt
1. Open the PPT first, then click Insert in the top menu bar, and insert a chart below:
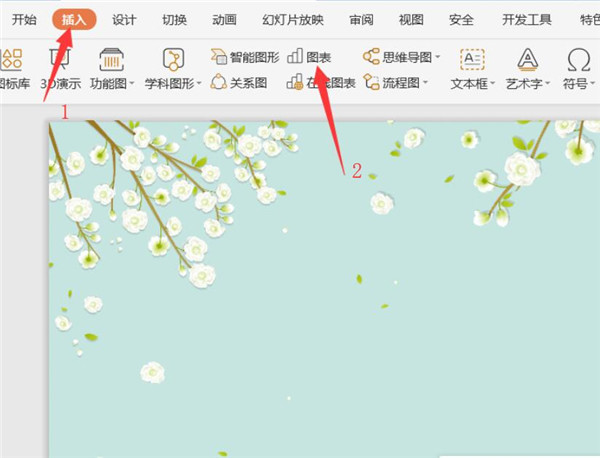
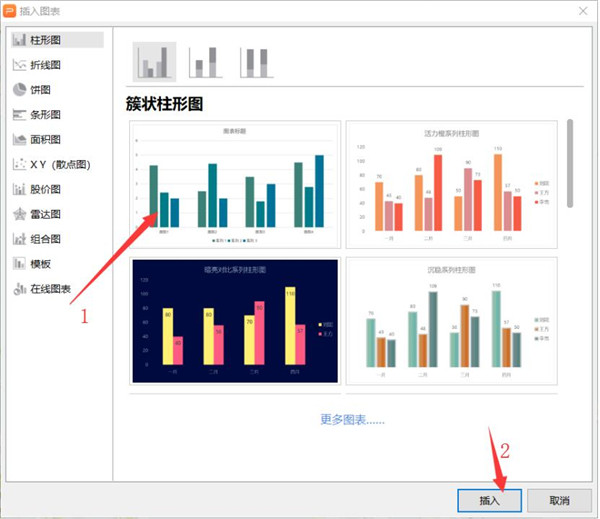
2. In the pop-up Insert Chart dialog box, we select a chart and click Insert. The specific operation is shown in the figure below:
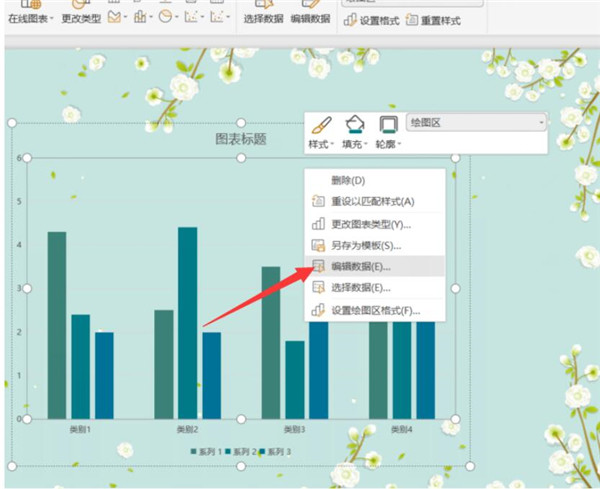
3. Then we right-click to edit the data:
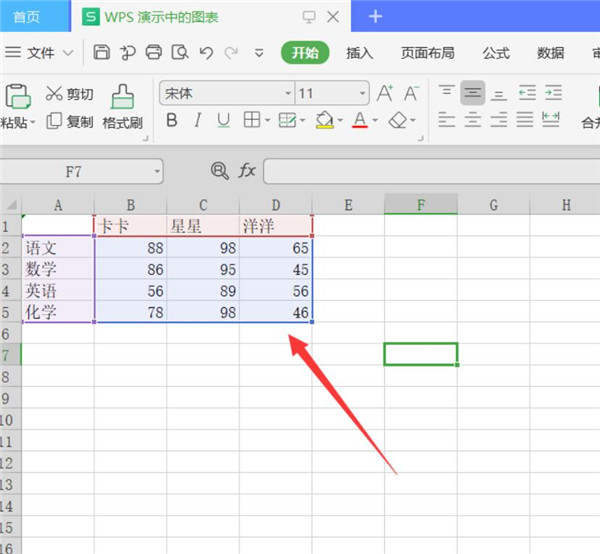
4. At this time, an Excel table of the chart in the WPS demo will pop up, edit the required data here:
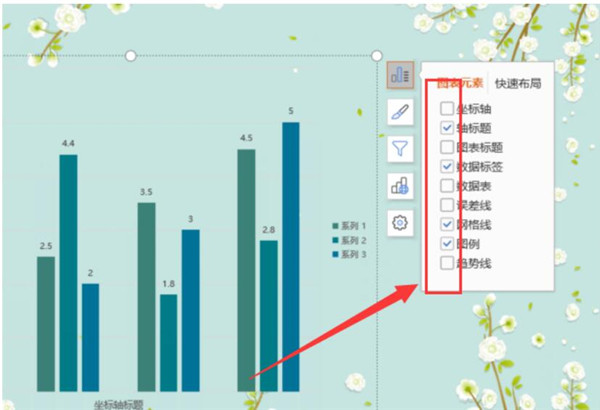
5. In this way, the chart is completed. Next, we select the chart, click the icon element, and uncheck the unnecessary elements:
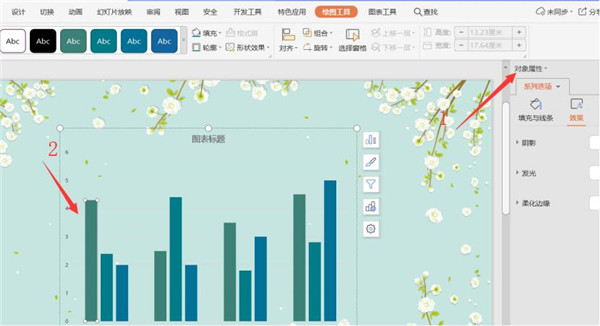
6. Then double-click the chart and a toolbar will appear on the right, click on the object properties:
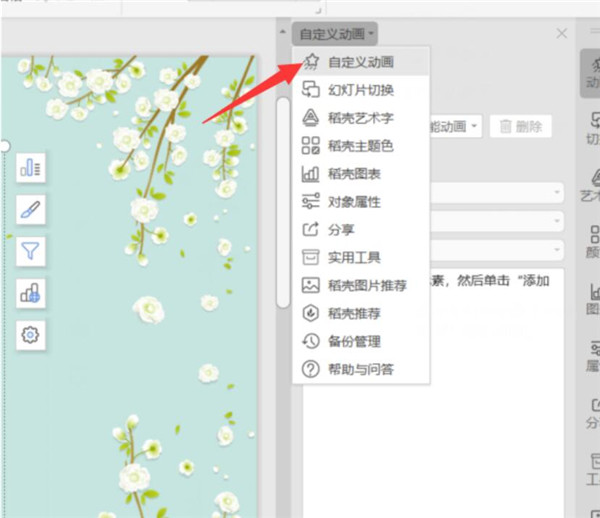
7. Then select custom animation in the drop-down list:
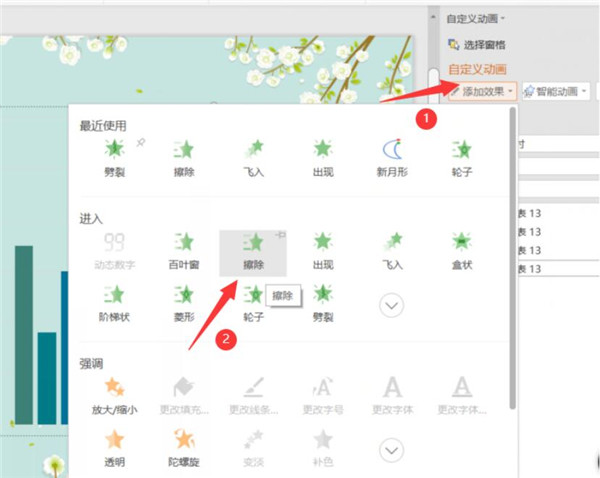
8. Add effects and choose to erase animation:
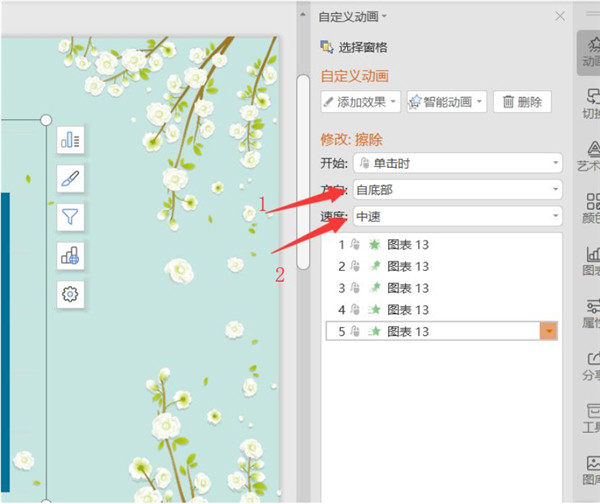
9. Then modify the format of the animation, we can choose according to our needs:
Articles are uploaded by users and are for non-commercial browsing only. Posted by: Lomu, please indicate the source: https://www.daogebangong.com/en/articles/detail/How%20to%20make%20dynamic%20charts%20in%20PPT.html
 支付宝扫一扫
评论列表(196条)
测试