The charts made in ppt want to display each series dynamically one by one, how to make it? For more downloads, please click ppt home.
1. Open the PowerPoint software, add a chart to the slide, and set the corresponding color.

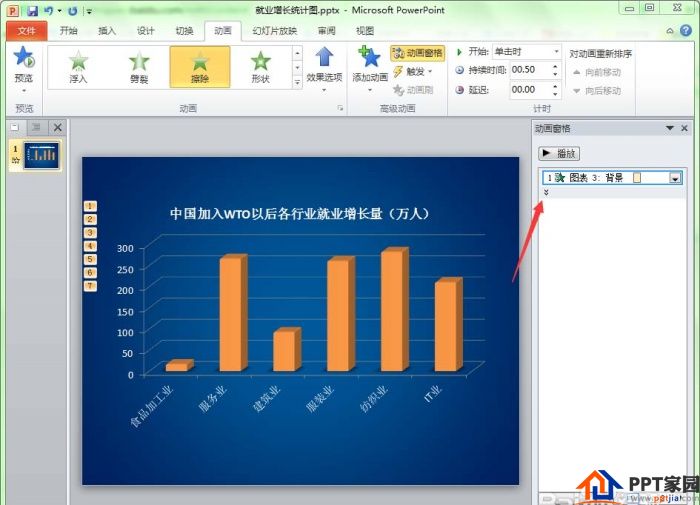
2. Select the chart, add a "erase" animation to it, and use the default value for the effect option. At this time, the chart appears as a whole, which is not the effect we want.
3. Click "Animation Pane" under the Animation menu to open the Animation Pane dialog box.
4. Right-click "Chart 3" in the animation pane, and select "Effect Options..." in the pop-up quick menu.
5. There are three tabs in the pop-up Effect Options dialog box, select the third tab "Chart Animation".
6. There is a combination chart under the chart animation option, and select the "by category" option in the drop-down list. Then press the OK button to return.
7. In the animation pane, click the expansion arrow under Chart 3 to display all the animations that have been set.
ppt template article recommendation:
How to make two 3D charts in PPT
How to insert radar chart in PPT
How to fill the personalized bar chart in PPT
Articles are uploaded by users and are for non-commercial browsing only. Posted by: Lomu, please indicate the source: https://www.daogebangong.com/en/articles/detail/How%20to%20make%20dynamic%20charts%20displayed%20one%20by%20one%20in%20PPT.html
 支付宝扫一扫
评论列表(196条)
测试