If you want to draw a pie chart icon in PPT, how to make the area of the pie chart represent the size of the data? For more downloads, please click ppt home.
ppt template article recommendation:
How to draw windmill rotation animation in PPT
PPT midline tutorial for drawing triangles
PPT tutorial on drawing equilateral triangle
1. Open PPT and create a blank presentation.

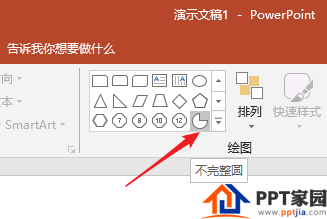
2. In [Start] - [Drawing], click the shape named [Incomplete Circle].

3. Hold down Shift and drag the mouse to draw an [incomplete circle].

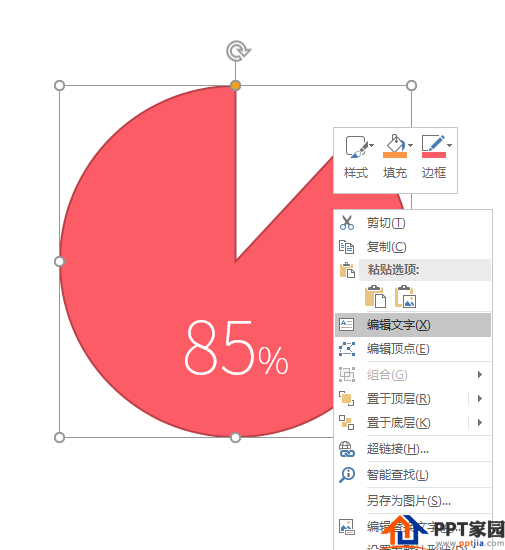
4. Click and drag the yellow control point at the lower endpoint of the graph to reduce the pie area, and you can get pie charts of different sizes.

5. Then, right-click on the pie chart - [Edit Text] to enter data.

6. In this way, a pie chart with a schematic effect is quickly produced.

Articles are uploaded by users and are for non-commercial browsing only. Posted by: Lomu, please indicate the source: https://www.daogebangong.com/en/articles/detail/How%20to%20make%20an%20incomplete%20pie%20chart%20in%20PPT.html

 支付宝扫一扫
评论列表(196条)
测试