The data in the ppt table wants to be made into a histogram, but I don’t want a histogram. I want to change it to an icon style. How to achieve it? For more downloads, please click ppt home.
ppt template article recommendation:
How to make a beautiful light beam in PPT
PPT transparent texture glass ball production tutorial
How to make a realistic wooden board in PPT
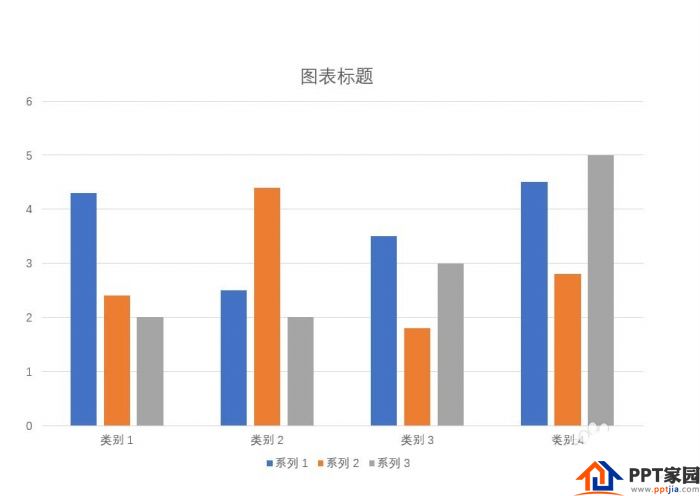
1. First, we open the histogram PPT prepared in advance, here for demonstration, the data can be ignored.
2. Then we insert the icon style we want into the PPT.
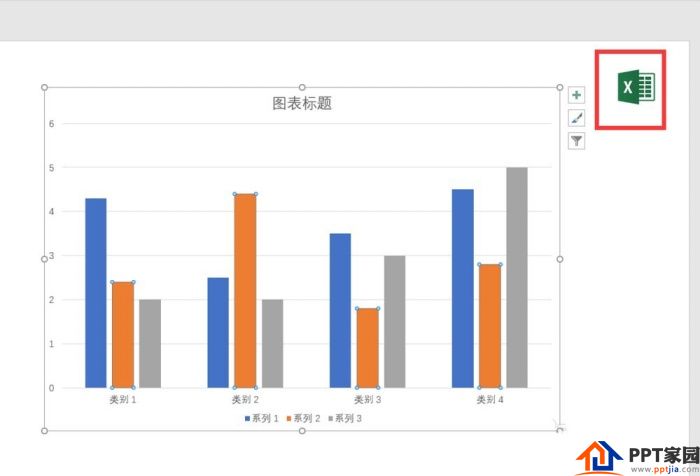
3. Then, we copy the icon, paste it into the bar chart, and insert it into the column where we want to change the icon style.
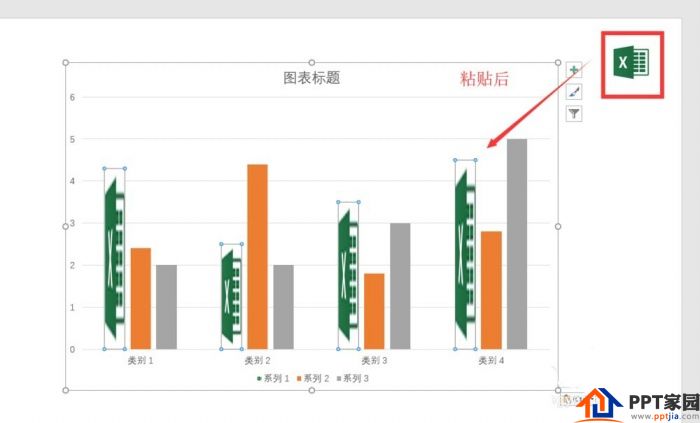
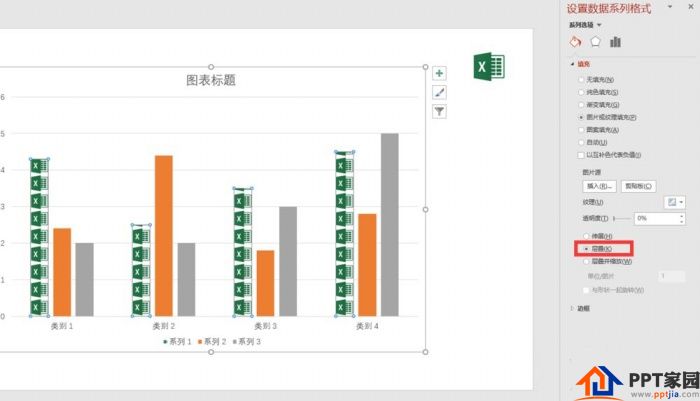
4. After that, we will see that the icon is distorted in the histogram, and we need to continue to set it up. Right-click the icon histogram and select "Format Data Series".

5. In the settings, find the "fill function".
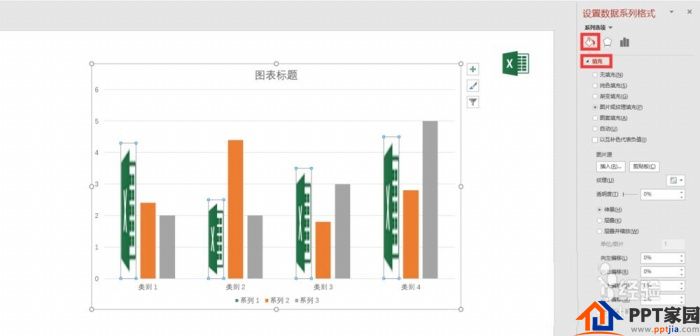
6. Finally, under the fill function option, modify the stretch to cascade. After that, you can see the histogram, and all the target histograms have become icons.
Articles are uploaded by users and are for non-commercial browsing only. Posted by: Lomu, please indicate the source: https://www.daogebangong.com/en/articles/detail/How%20to%20make%20an%20iconstyle%20histogram%20in%20PPT.html
 支付宝扫一扫
评论列表(196条)
测试