There are many styles of charts in the excel table. If you want to make a personalized percentage chart in ppt, how do you do it? Let's take a look at the detailed tutorial below. For more downloads, please click ppt home.
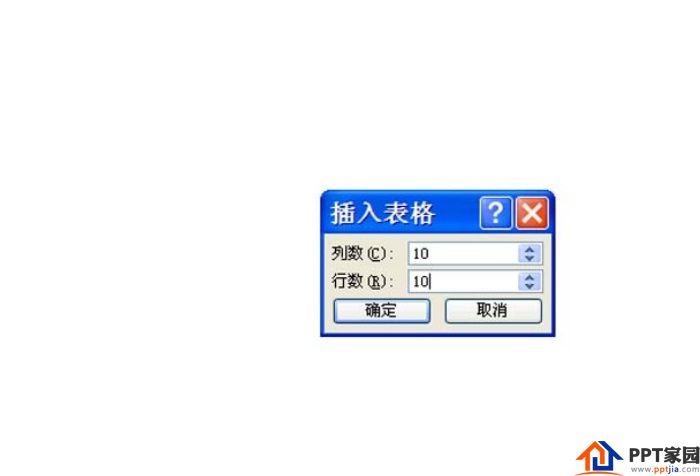
1. First start ppt2010, execute the Insert-Table command, select Insert Table, and insert a table with 10 rows and 10 columns.
2. Adjust the size of the table, execute the format menu, and set the shape fill to gray.

3. Execute the design menu, set the shading as a gradient, and choose a gradient you like.

4. Execute the Insert-Text Box command to insert a text box and enter the corresponding percentage.

5. Select 73 rectangles, set the shading to other gradients, and set the gradient color.

6. Use complex methods to make other charts and modify the corresponding percentage figures.

ppt template article recommendation:
How to use tables to divide PPT pages
PPT making tables to measure the importance and urgency of events
How to use tables to make vertical mathematical operations in PPT
Articles are uploaded by users and are for non-commercial browsing only. Posted by: Lomu, please indicate the source: https://www.daogebangong.com/en/articles/detail/How%20to%20make%20a%20percentage%20chart%20of%20personality%20in%20PPT.html
 支付宝扫一扫
评论列表(196条)
测试