PPT wants to make a lightning chart, how to make this effect? Let's take a look at the detailed tutorial below. For more downloads, please click ppt home.
ppt template article recommendation:
How to make a 3D stereo chart in ppt
PPT special chart tool tutorial
How to design a mountain column chart in PPT
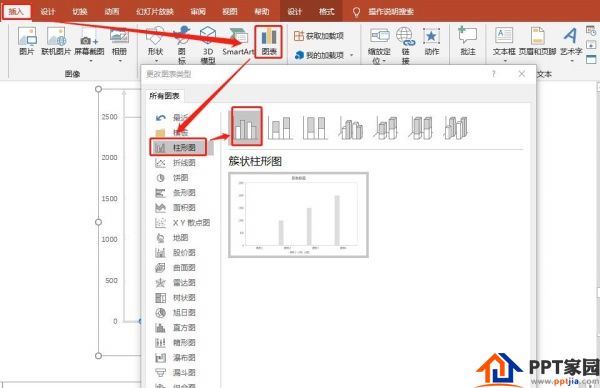
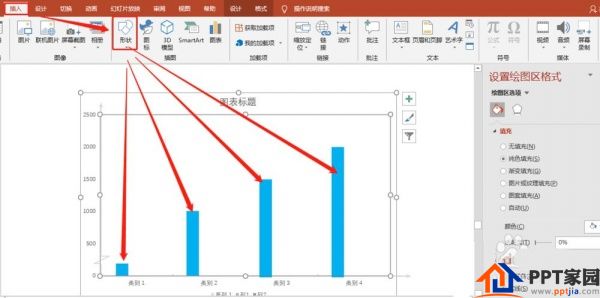
1. Insert the column chart first. As shown in the picture:
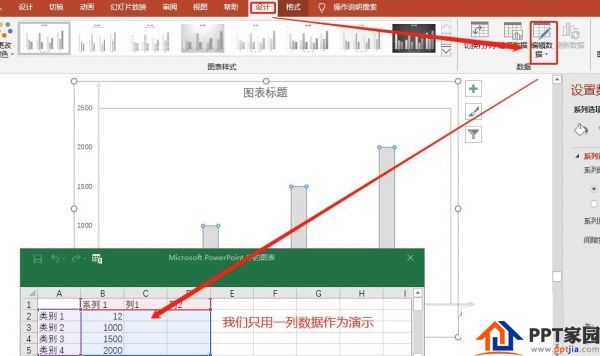
2. Click the Design tab and select Edit Data. As shown in the picture:
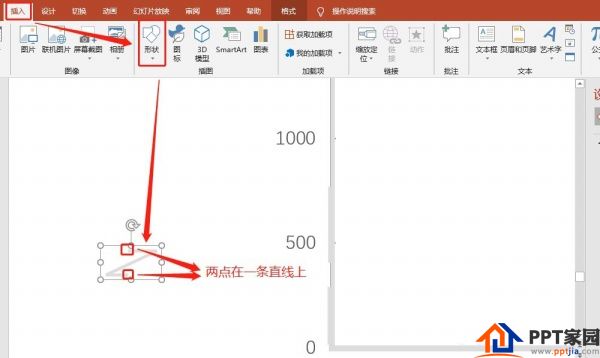
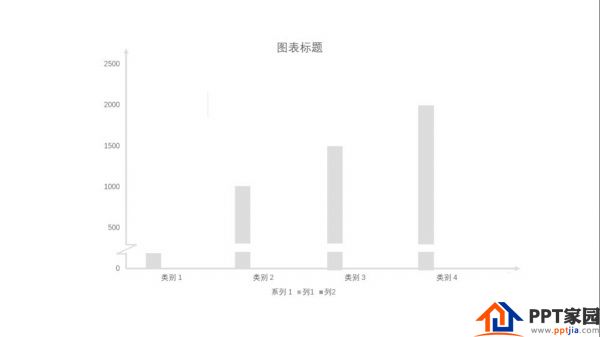
3. Use three straight lines to make the lightning coordinate axis. As shown in the picture:
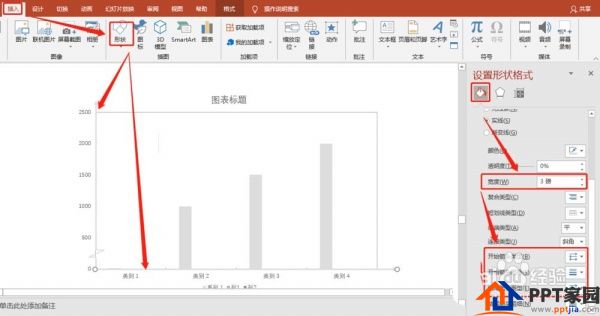
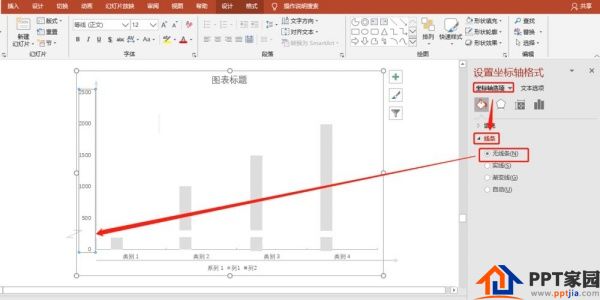
4. Using a straight line, draw a straight line coordinate axis. The format is set as shown in the figure:
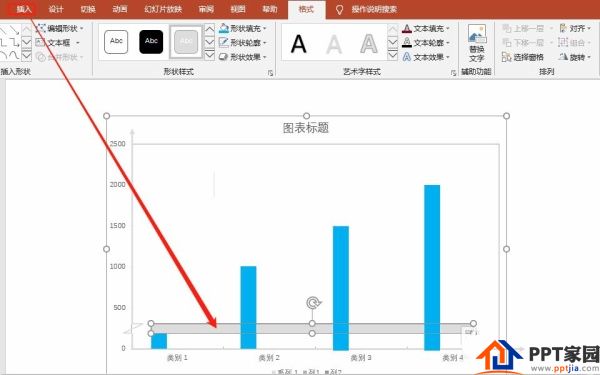
5. Draw a rectangle to cover the chart automatically generated by the previous chart. As shown in the picture:
6. Insert a rectangle and adjust the graphics to have no border. As shown in the picture:
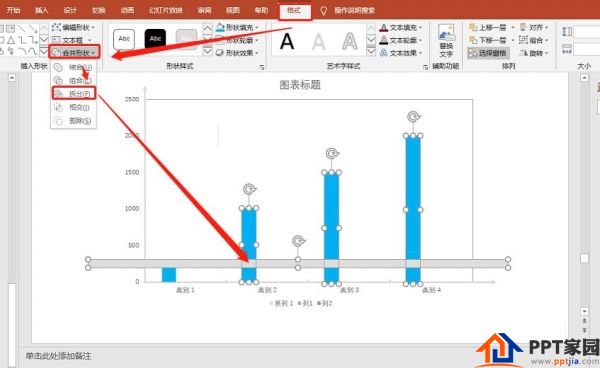
7. Select and split the 4 rectangles. As shown in the picture:
8. Set the chart as: no fill, no border. As shown in the picture:
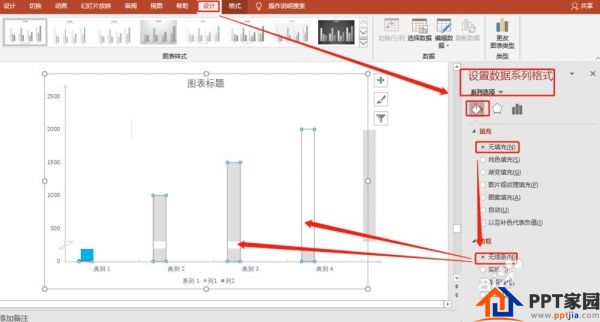
9. Set the horizontal and vertical axis format to: no lines. As shown in the picture:
10. Place the drawn graphics on the chart. As shown in the picture:
Articles are uploaded by users and are for non-commercial browsing only. Posted by: Lomu, please indicate the source: https://www.daogebangong.com/en/articles/detail/How%20to%20make%20a%20lightning%20coordinate%20axis%20chart%20in%20ppt.html
 支付宝扫一扫
评论列表(196条)
测试