PPT is a very commonly used software in work and life, but many people don't know how to make tables. The following editor will explain to you< /span>ppt dynamic column chart making method.
ppt template article recommendation:
How to add ppt custom animation
How to use ppt to make flowers rotate and bloom
How to use ppt to make memory animation effect
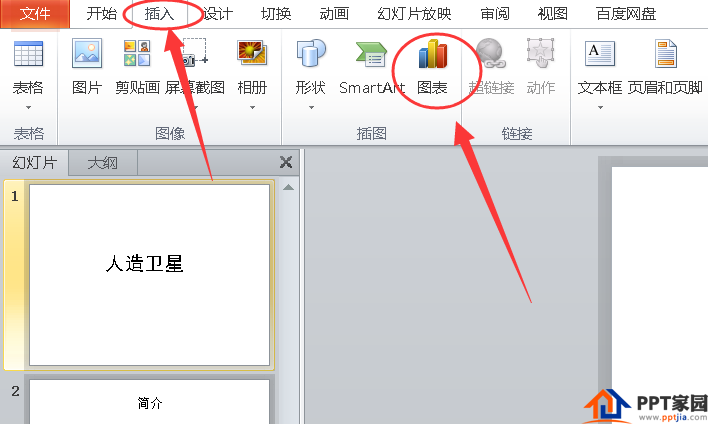
1. Click [Insert] on the top and select [Chart].
2. Insert a column chart.
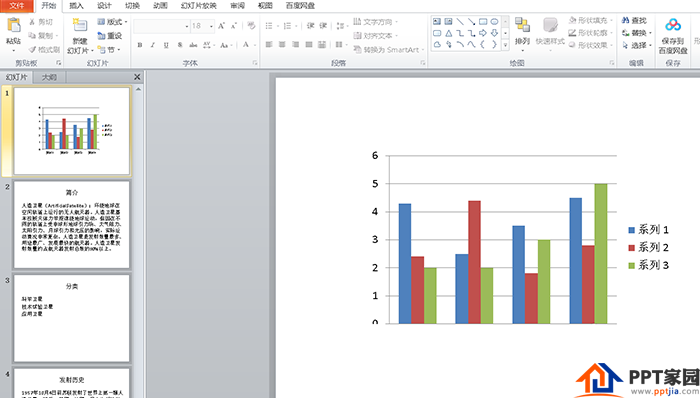
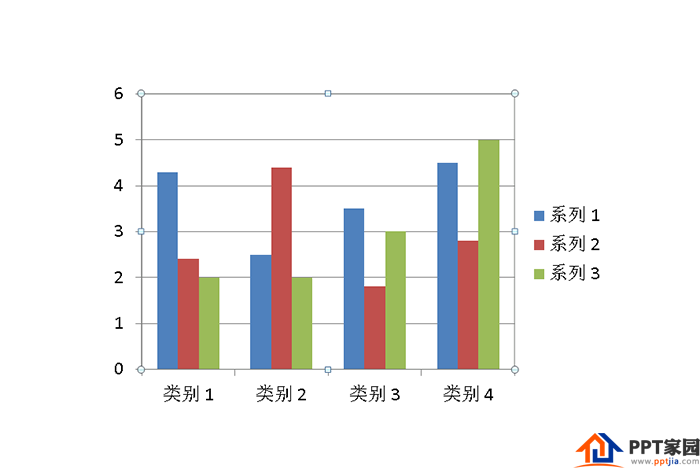
3. Click on the column chart to select it.
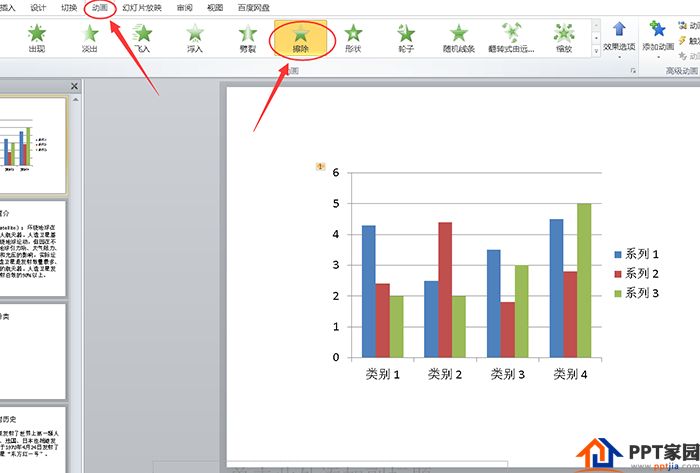
4. Click [Animation] at the top and select [Illustration].
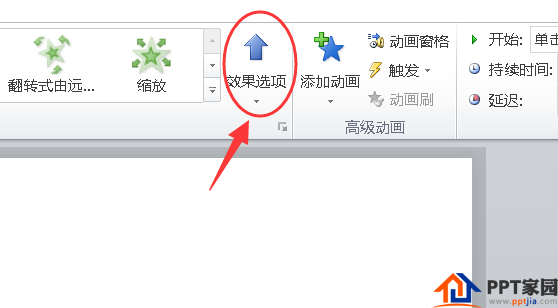
5. Click [Effect Options].
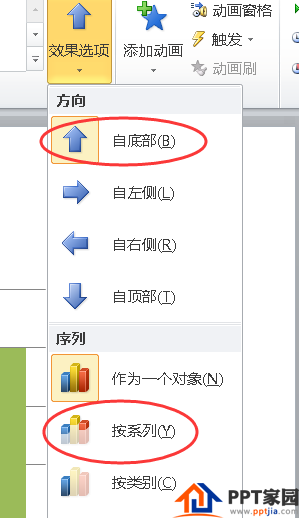
6. Select [From Bottom] for the direction, and [By series] for the sequence.
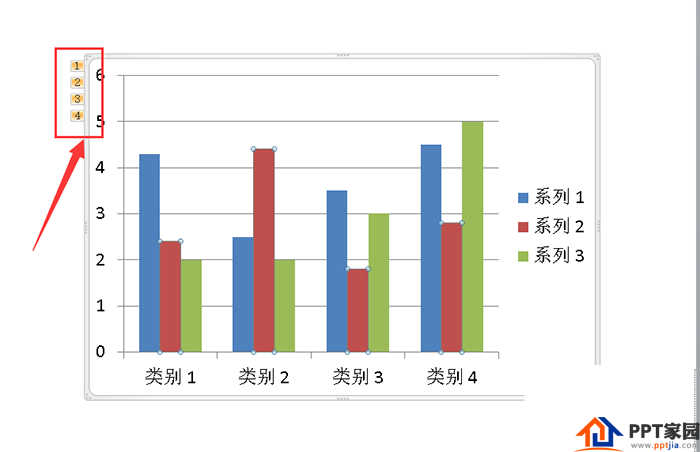
7. As shown in the figure, the animation of the column chart is ready.
Articles are uploaded by users and are for non-commercial browsing only. Posted by: Lomu, please indicate the source: https://www.daogebangong.com/en/articles/detail/How%20to%20make%20a%20column%20chart%20with%20ppt.html
 支付宝扫一扫
评论列表(196条)
测试