Various charts are often used in PPT presentations. Today, let’s discuss with you how to create the three-dimensional charts you want. For more downloads, please click ppt home.
ppt template article recommendation:
PPT special chart tool tutorial
How to design a mountain column chart in PPT
How to design a percentage ring chart in ppt
First, determine how many columns to use based on your actual data. The editor here assumes that eight columns are used. Switch to the "Insert" tab, click "Shape", and choose to draw a square. Copy this square, paste seven squares, and arrange them in a line.

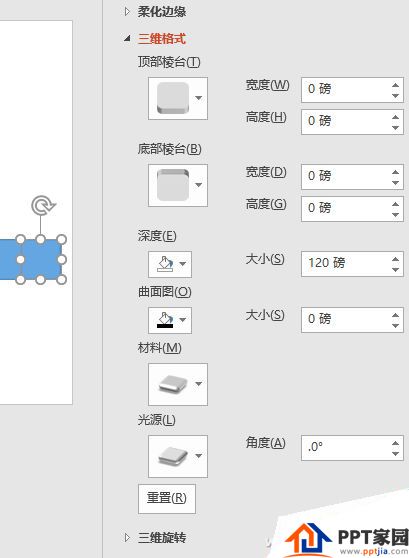
Select the first square on the left, then right-click, select "Format Shape", open the Format Shape pane on the right, switch to the "Effect" option (click the pentagon icon), and then expand "3D Format", set The "depth" size is set to 20 points, which is a base, and the size can be set arbitrarily.
Then select the second square, and set its "depth" size proportionally, for example, I set it to 30 points here. By analogy, the closer to the square on the right, the higher the value of "Depth".

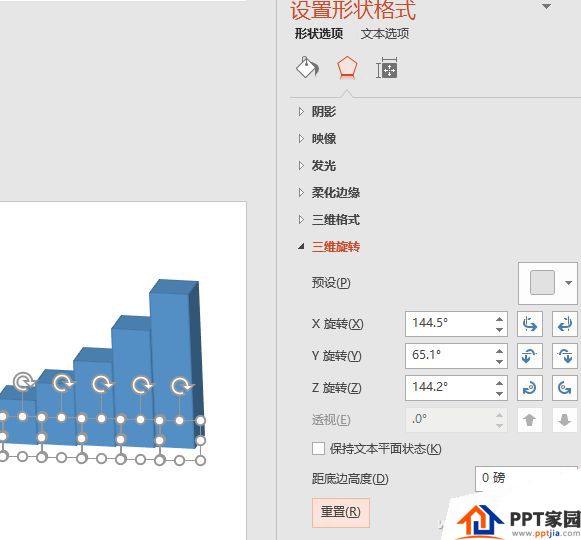
After setting the depth, press Ctrl+A to select all squares, and then expand the "3D Rotation" item in the right pane to set different rotation angles for X, Y, and Z, or directly click the corresponding rotation arrow button at the back, You can see the shape of the three-dimensional column.

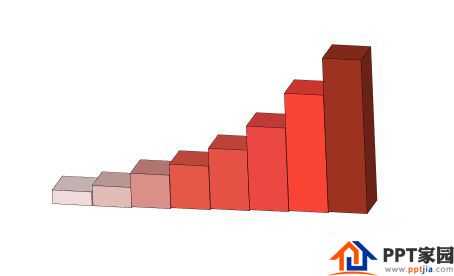
After adjusting the angle position, right-click each column separately to set different colors for them. Here the editor sets the gradient color from left to right.

The production of the three-dimensional trend arrow is similar to the above steps, except that at the very beginning, a curved arrow needs to be drawn. In "Shape", you can first choose to draw a curved arrow in the library. Then right-click it, select "Edit Vertex", and drag the vertices to make the arrow shape you want.

In the same way as above, increase the depth of the arrow shape, rotate it at different angles, set the color, and combine it with the three-dimensional column chart made above to get the chart effect shown at the beginning of the article.
Articles are uploaded by users and are for non-commercial browsing only. Posted by: Lomu, please indicate the source: https://www.daogebangong.com/en/articles/detail/How%20to%20make%203D%20stereo%20chart%20in%20ppt.html

 支付宝扫一扫
评论列表(196条)
测试