How to draw the number line diagram in the second grade? The editor will share with you how to draw the number line diagram in the second grade by combining an example of mathematics addition and subtraction. For more downloads, please click ppt home.
ppt template article recommendation:
How to set the rotation animation of pie chart in PPT
How to design digital countdown animation in PPT
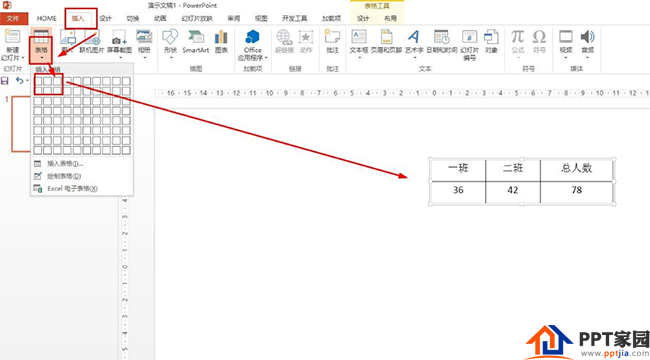
Insert a table with 3 columns and 2 rows, and set the number of people in the first class to be 36, and the number of people in the second class to be 42. Now it is necessary to use a number line diagram to represent the addition operation and calculate the total number of people.
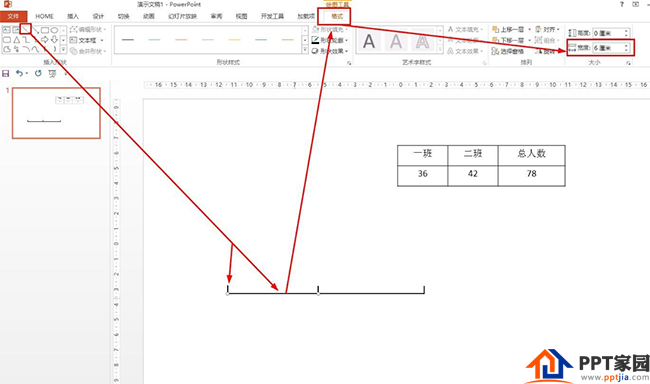
First use a straight line to draw a straight line - click Format - set the width to 6 cm in the size option (one centimeter scale represents 6 people) - and then use a straight line to draw the two ends of the line segment. Draw another 7 cm line segment in the same way.
Click Insert - Text Box - title class and number of people in the line segment, so that the number of people displayed in the two classes is on a straight line.
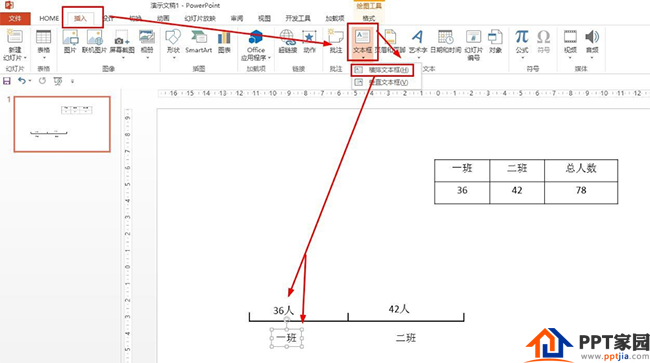
Click Insert-Shape-Select Braces, draw a brace-then click Format to rotate to down and enclose the range of line segments.

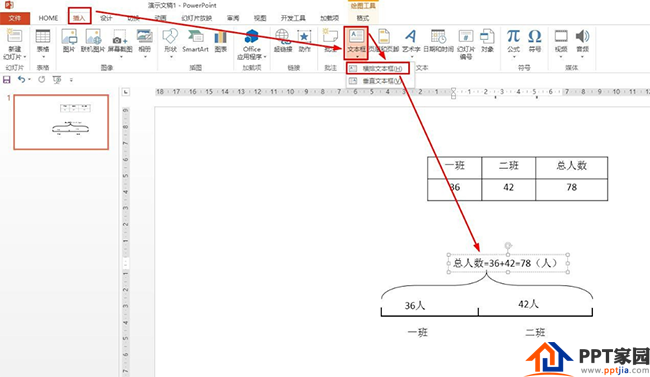
Click Insert - Text Box - Horizontal Text Box, insert a text box above the brackets, and enter:
Total number=36+42=78(people)
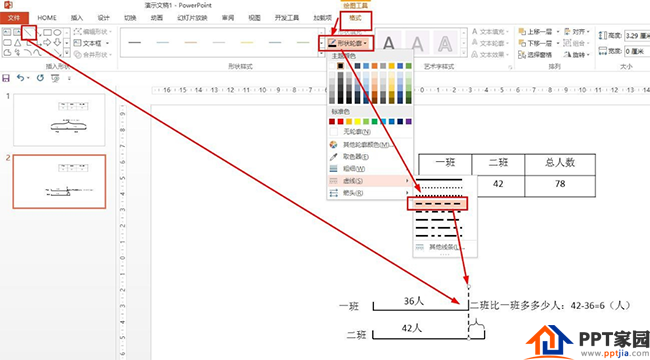
If it is a subtraction, align the line segments of Class 1 and Class 2 up and down - use a dotted line to draw them at the same straight line position - then insert braces to enclose the extra range - enter above the brackets:
How many more people are there in the second class than in the first class: 42-36=6 (people)
Articles are uploaded by users and are for non-commercial browsing only. Posted by: Lomu, please indicate the source: https://www.daogebangong.com/en/articles/detail/How%20to%20draw%20the%20second%20grade%20number%20line%20graph%20in%20PPT.html
 支付宝扫一扫
评论列表(196条)
测试