How to draw a funnel graph in ppt? If you want to draw a funnel graph in ppt, how to draw this graph? Let's take a look at how to draw a funnel icon in ppt.
ppt template article recommendation:
How to use ppt to add gradient glass wind effect to pictures
How to use ppt to make hand-painted chalk characters
How to use PPT to batch produce annual meeting coupons
How to use ppt to create a three-dimensional rotation effect for pictures
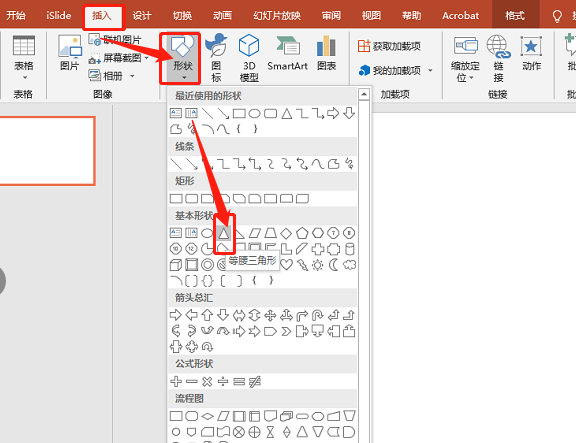
1. Insert the triangle. As shown in the picture:
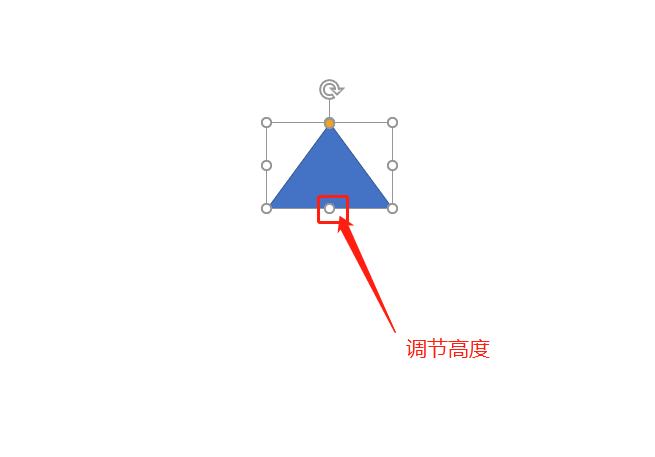
2. Adjust the length and width, just a little wider. As shown in the picture:
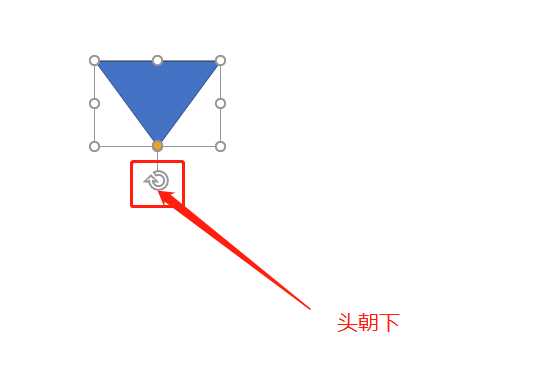
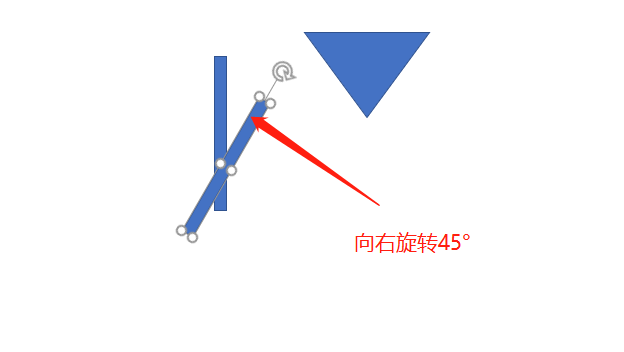
3. Rotate the graphics, as shown in the figure:
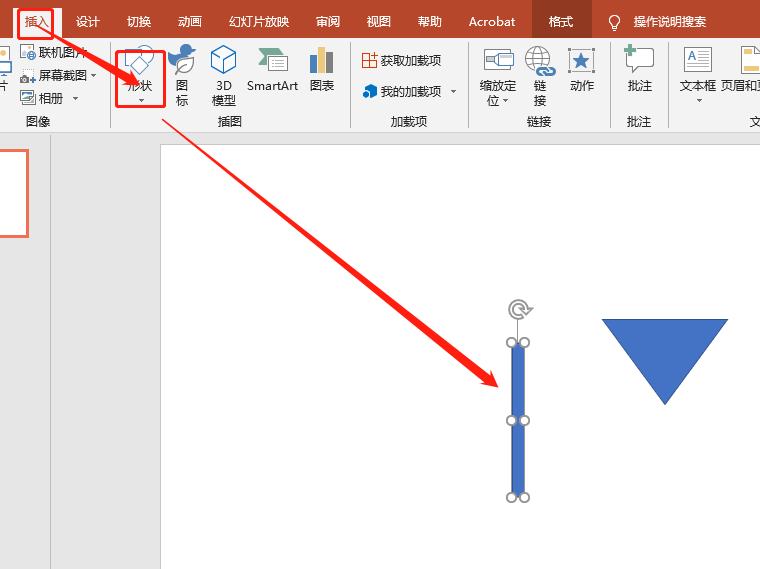
4. Insert the rectangle. As shown in the picture:
5. Copy another rectangle and place it as shown in the figure:
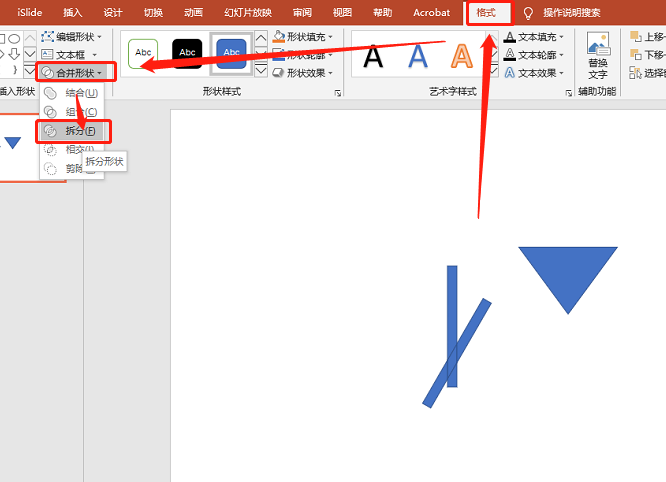
6. Split graphics. As shown in the picture:
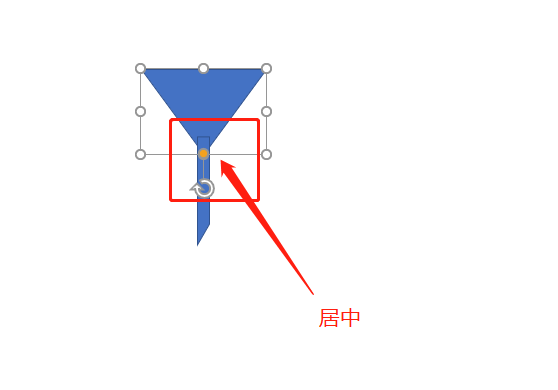
7. Center the split graphics relative to the triangle. As shown in the picture:
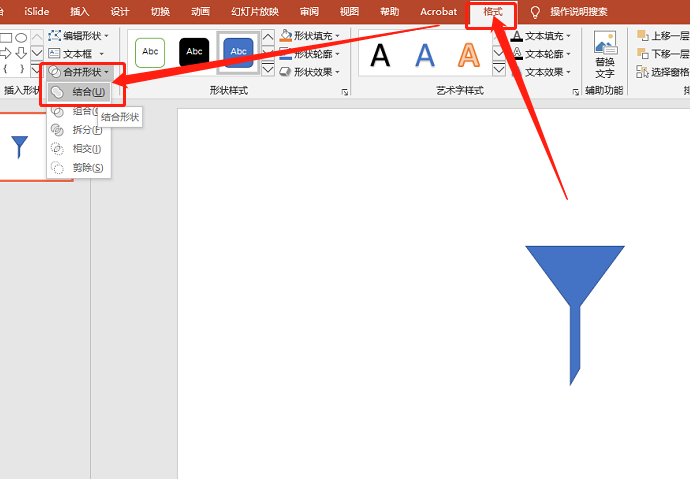
8. Combine graphics. As shown in the picture:
Articles are uploaded by users and are for non-commercial browsing only. Posted by: Lomu, please indicate the source: https://www.daogebangong.com/en/articles/detail/How%20to%20draw%20funnel%20graphics%20with%20ppt.html
 支付宝扫一扫
评论列表(196条)
测试